-
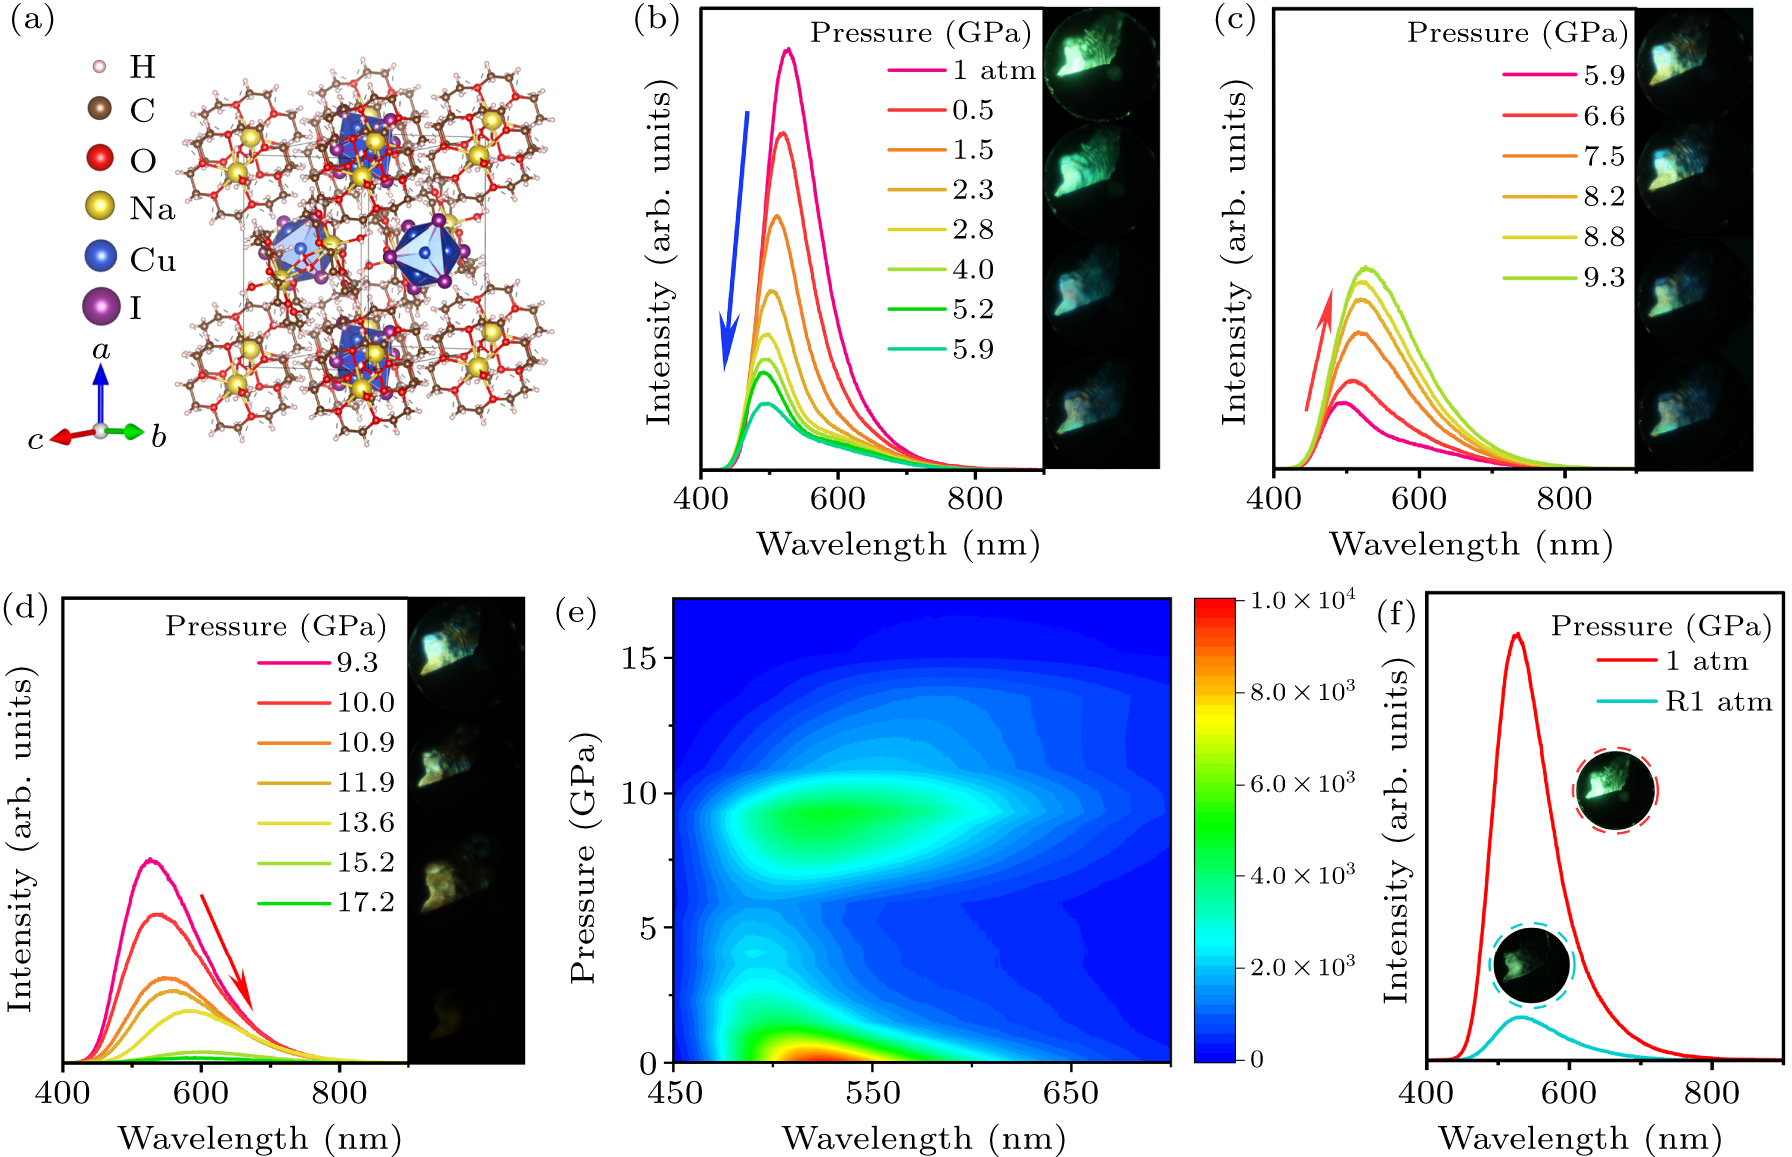
Figure 1. (a) Crystal structure of (C12H24O6)2Na2(H2O)3Cu4I6. (b)–(d) PL spectra of (C12H24O6)2Na2(H2O)3Cu4I6 under high pressure. (e) 2D heat-map of PL spectra of (C12H24O6)2Na2(H2O)3Cu4I6 upon compression. (f) Comparison of (C12H24O6)2Na2(H2O)3Cu4I6 emission intensity at 1 atm and R1 atm.
-
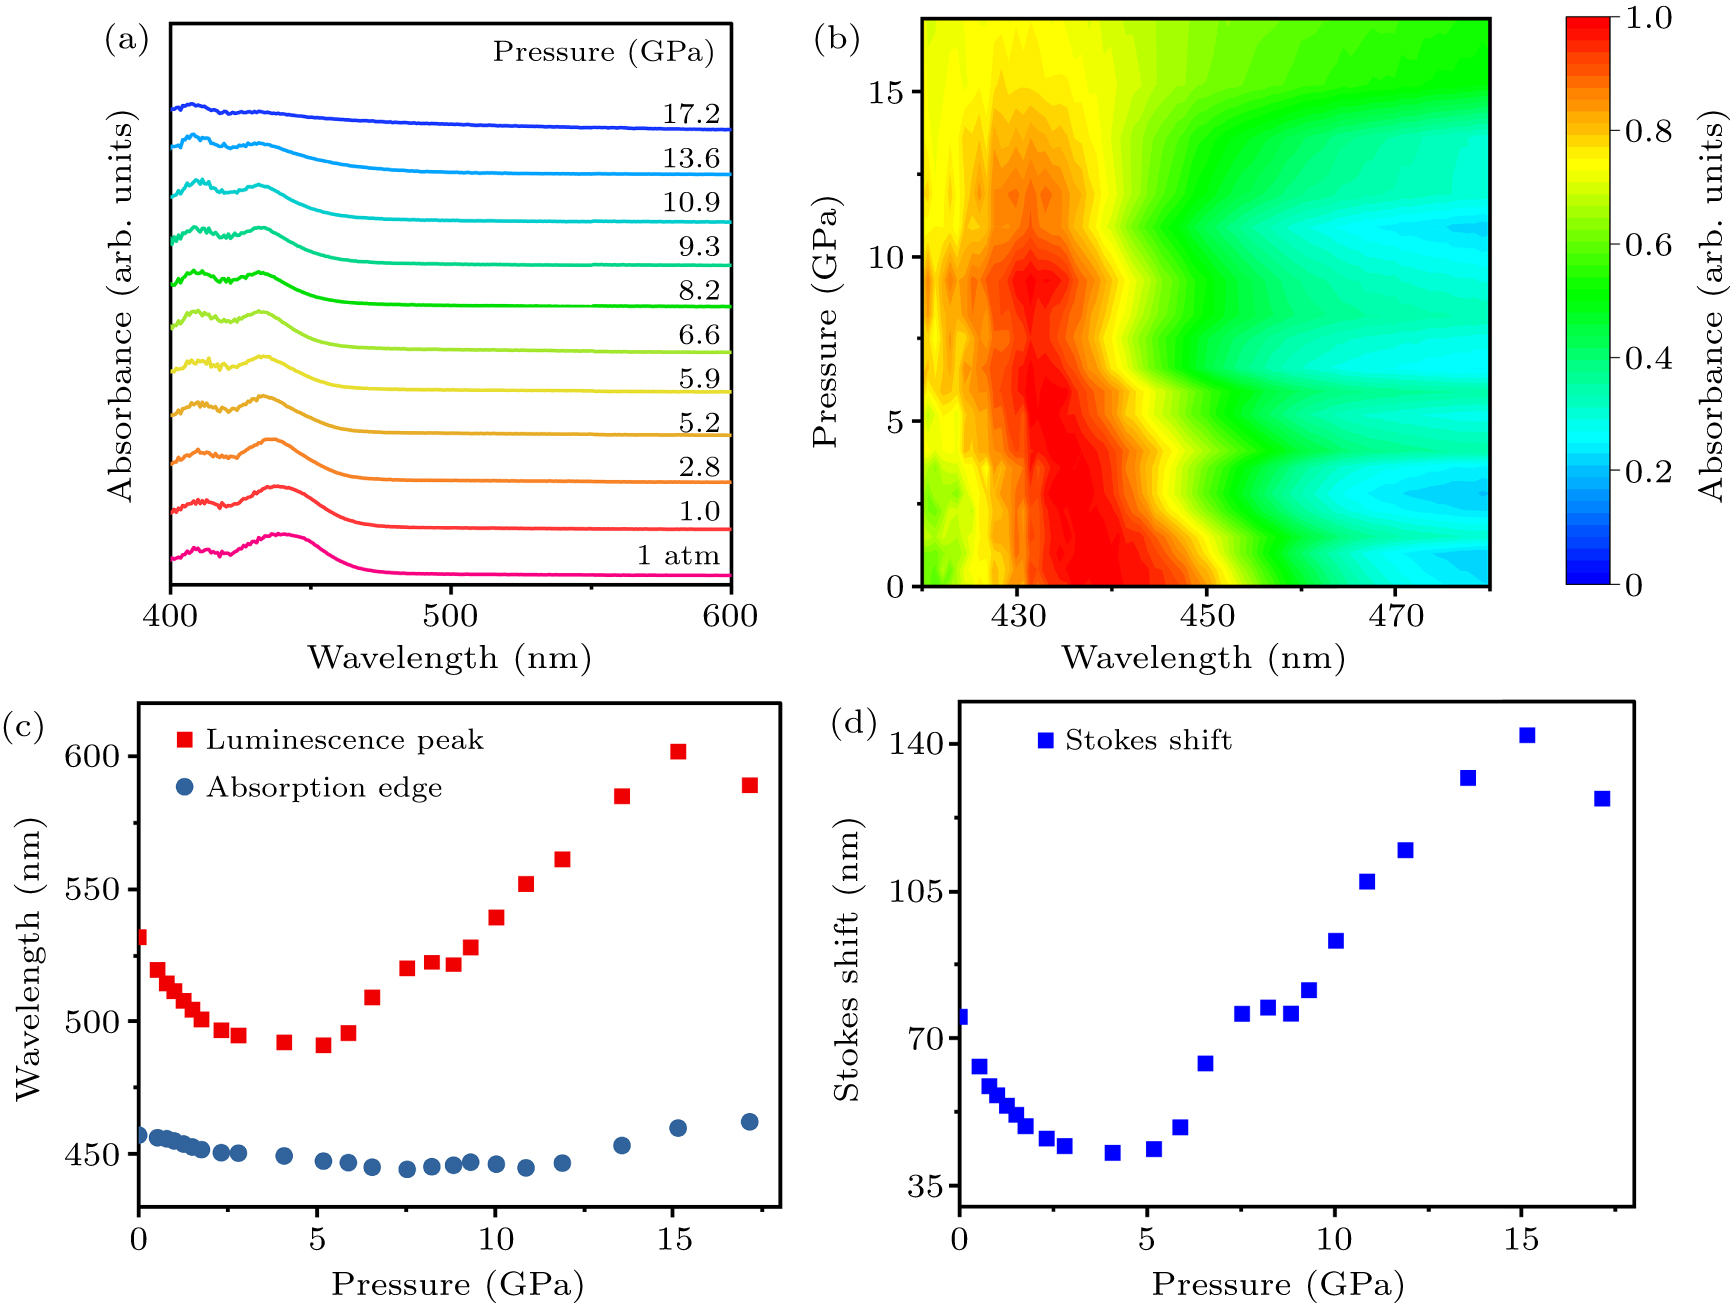
Figure 2. (a) UV/Vis absorption spectra of (C12H24O6)2Na2(H2O)3Cu4I6. (b) 2D heat-map of UV/Vis absorption spectra of (C12H24O6)2Na2(H2O)3Cu4I6 upon compression. (c) Pressure-induced variations in luminescence peak position and absorption edge position. (d) Pressure-dependent changes in the Stokes shift of (C12H24O6)2Na2(H2O)3Cu4I6.
-
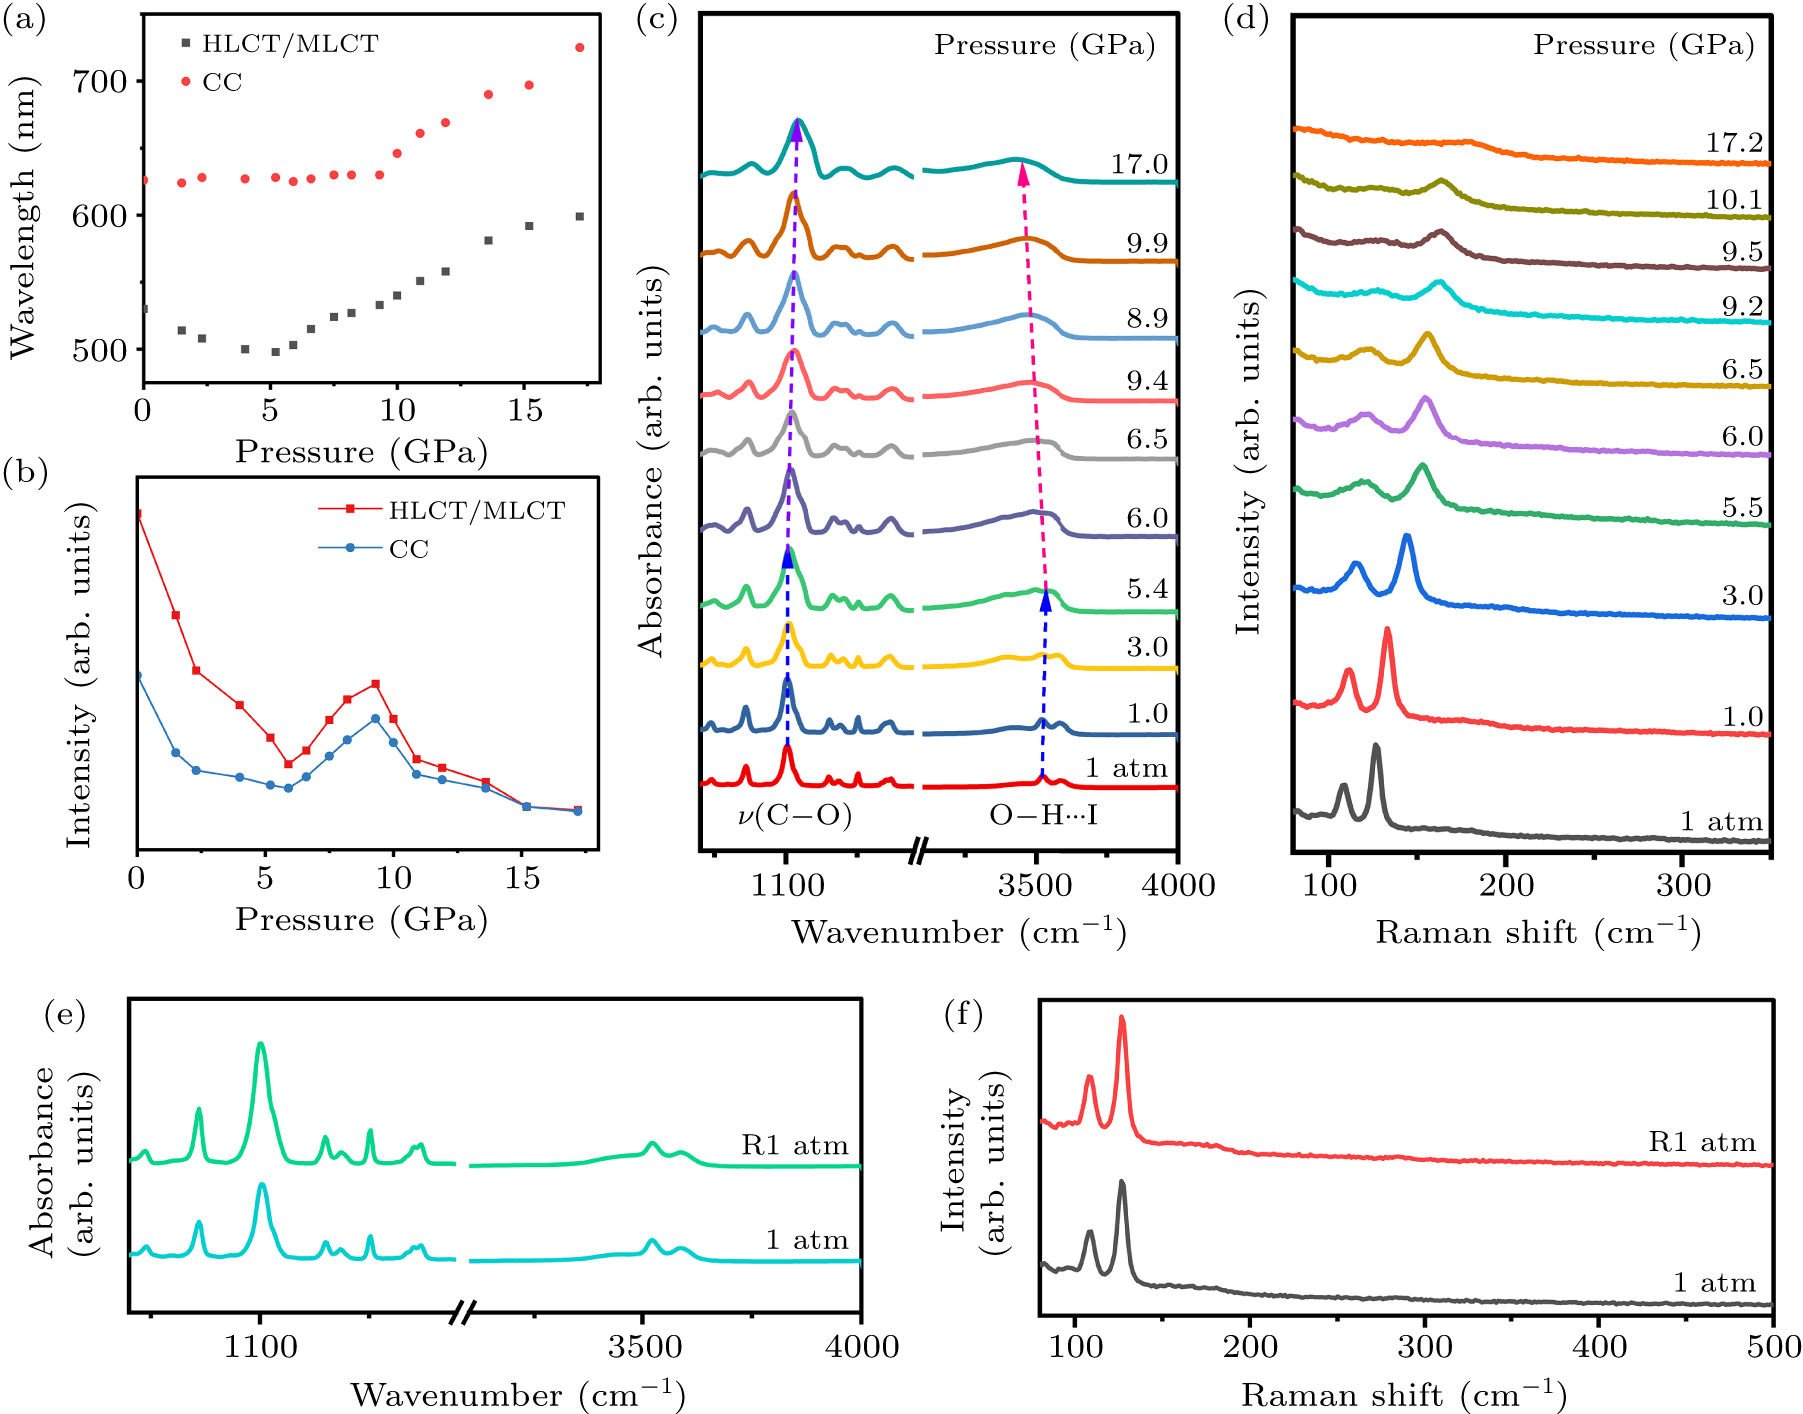
Figure 3. (a) Wavelength changes of different emission states under high-pressure. (b) Emission intensity changes of different emission states under high pressure. (c) High-pressure IR spectroscopy of (C12H24O6)2Na2(H2O)3Cu4I6. (d) High-pressure Raman spectroscopy of (C12H24O6)2Na2(H2O)3Cu4I6. (e) Comparison of infrared absorption spectra at 1 atm and R1 atm. (f) Comparison of Raman spectra at 1 atm and R1 atm.
-
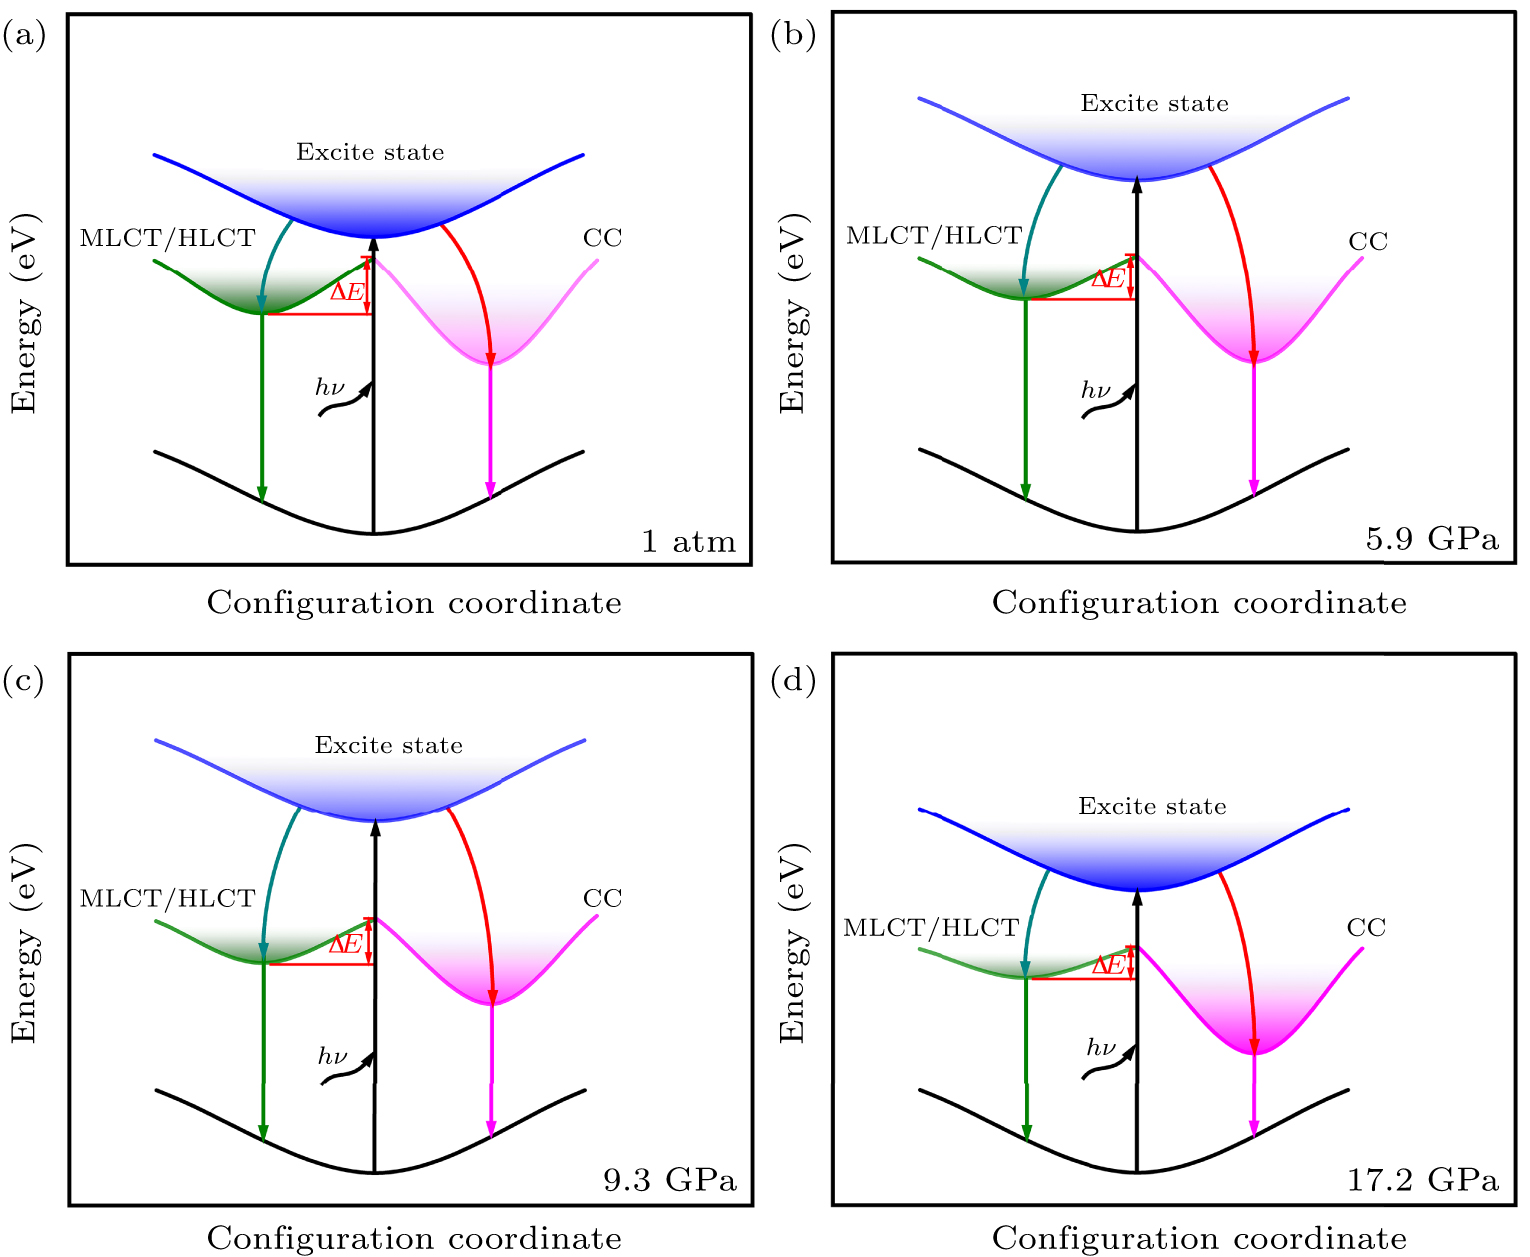
Figure 4. Schematic diagram of (C12H24O6)2Na2(H2O)3Cu4I6 energy levels (a) at ambient pressure, (b) below 5.9 GPa, (c) between 5.9 GPa and 9.3 GPa, (d) between 9.3 GPa and 17.2 GPa.
Figure
4 ,Table
0 个