-
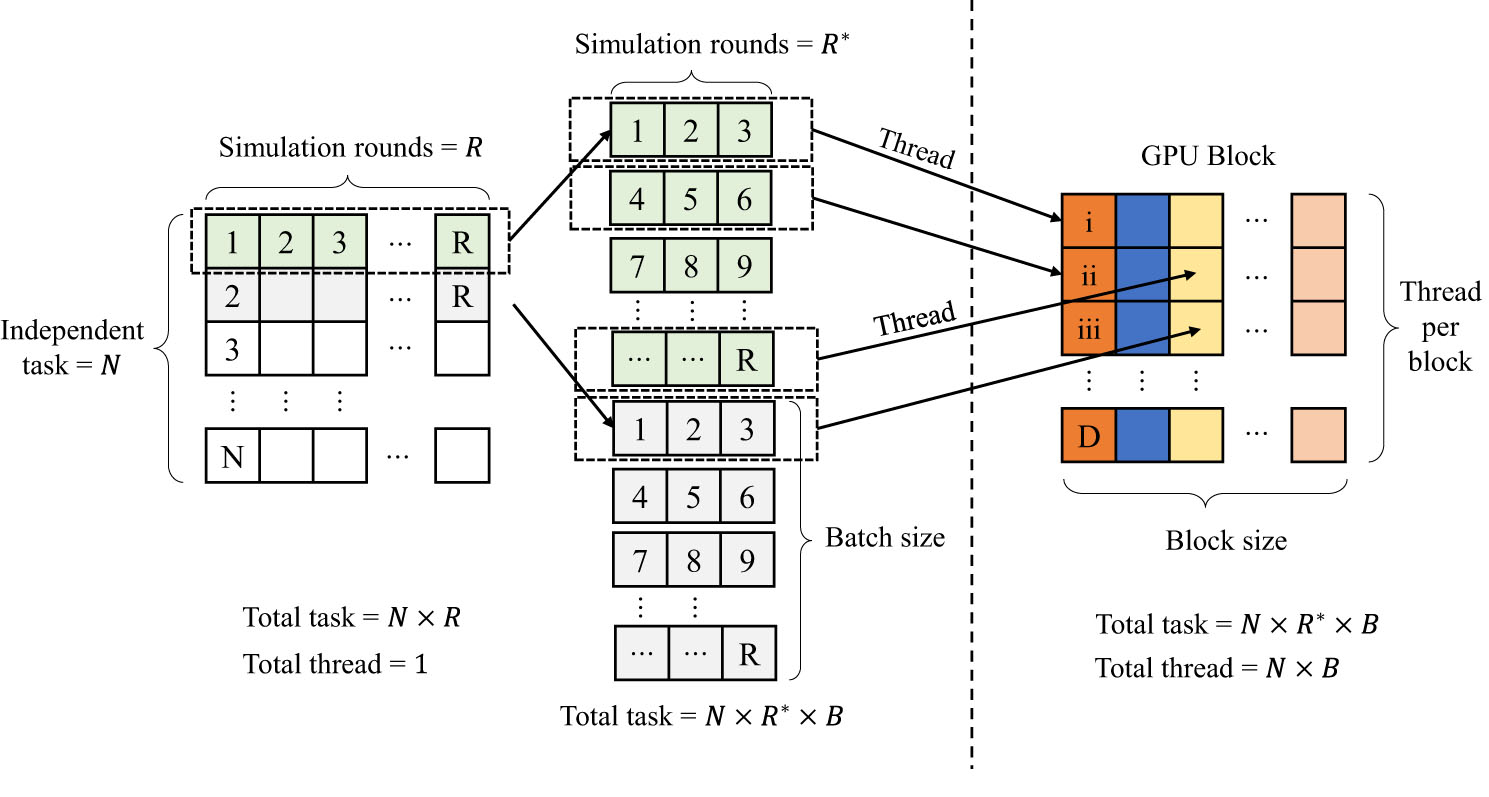
Figure 1. Task decomposition and parallelization. The algorithm divides the N × R independent tasks into batches and sizes suitable for GPU parallel scheduling. Through block parallelism and thread parallelism, the serial tasks of a single CPU are mapped into parallel computing tasks of N × B independent threads.
-
-
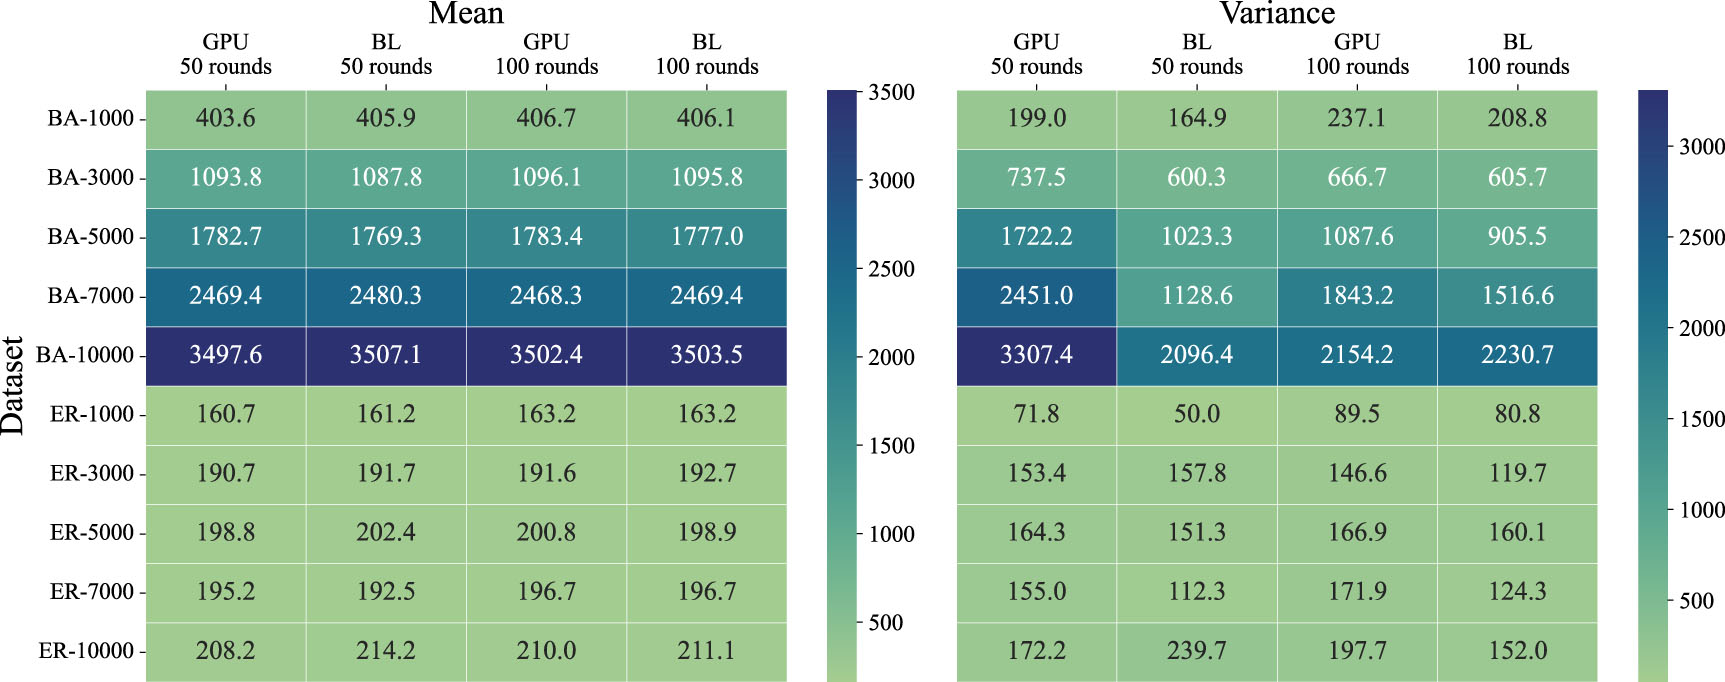
Figure 2. Comparison of the spreading size between GPIC and baseline algorithm in Task 1. Seed size is fixed at 100.
-
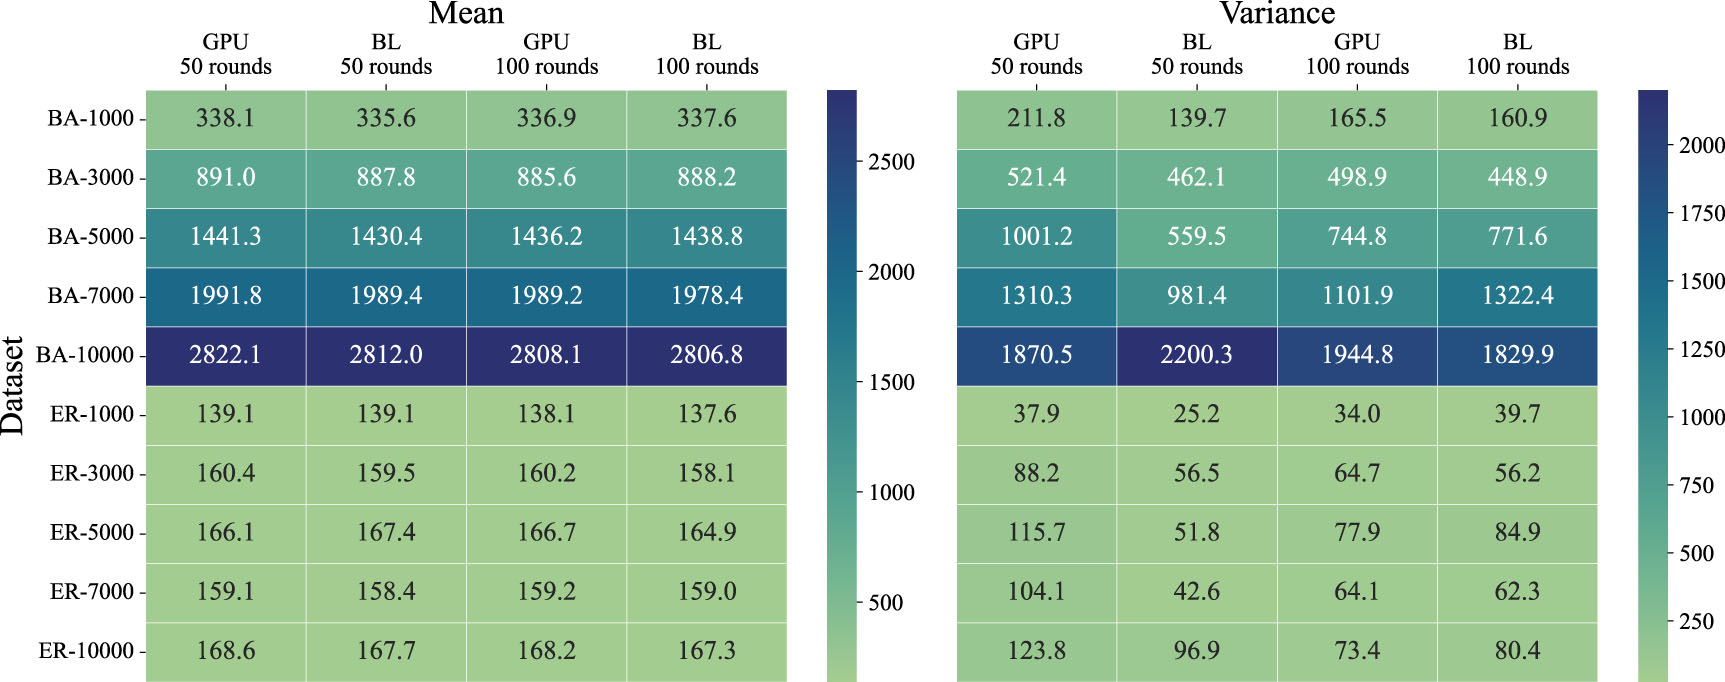
Figure 3. Comparison of the spreading size between GPIC and baseline algorithm in Task 2. Here 100 nodes with top degree are selected as seeds, and the immune seed sizes are 1%–20%; 500 and 1000 rounds of simulations are implemented respectively.
-
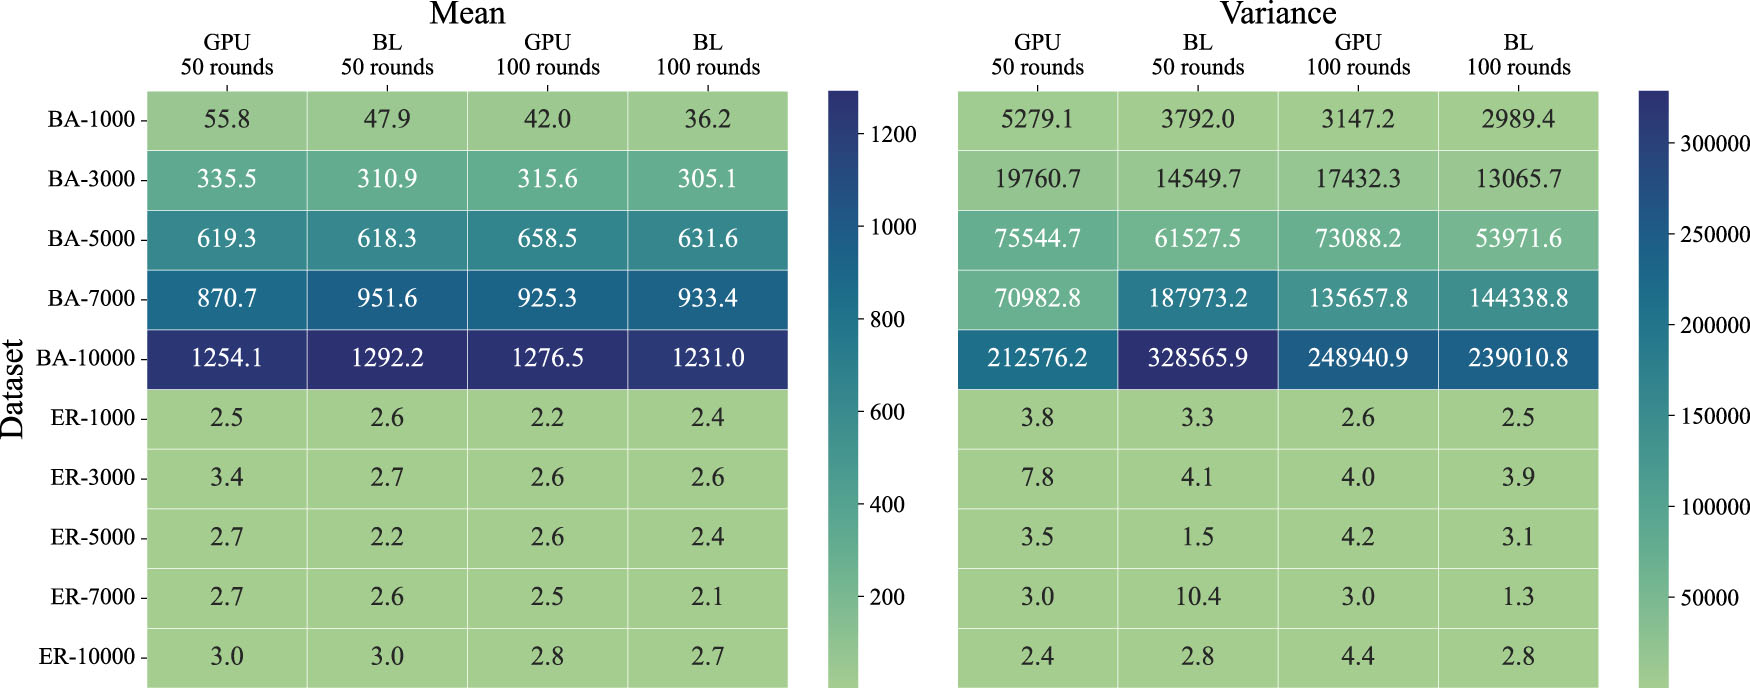
Figure 4. Comparison of the spreading size between GPIC and baseline algorithm in Task 3.
-
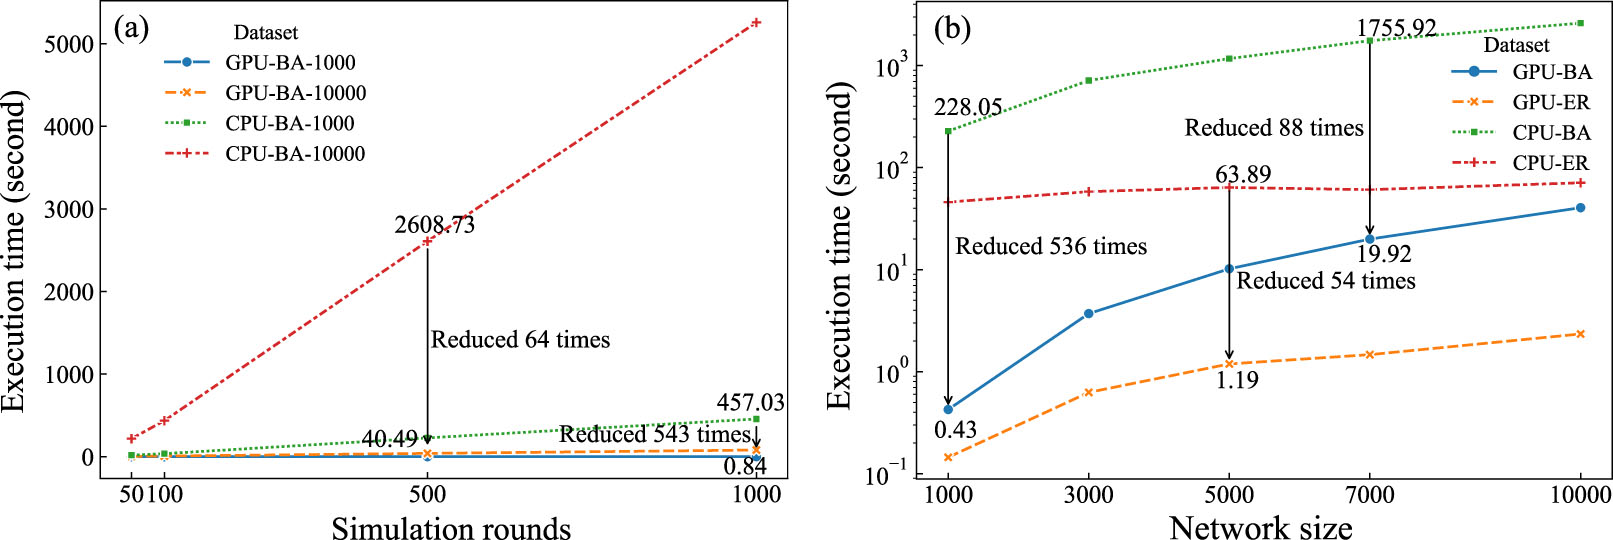
Figure 5. Comparison of execution time of GPIC and baseline algorithm across different simulation rounds and networks sizes. (a) The time consumption of GPIC and baseline algorithm in Task 1, where BA networks vary in size. (b) The time consumption of GPIC and baseline algorithm in Task 2, where 20% of the nodes are immune and 500 rounds of simulation are considered.
-
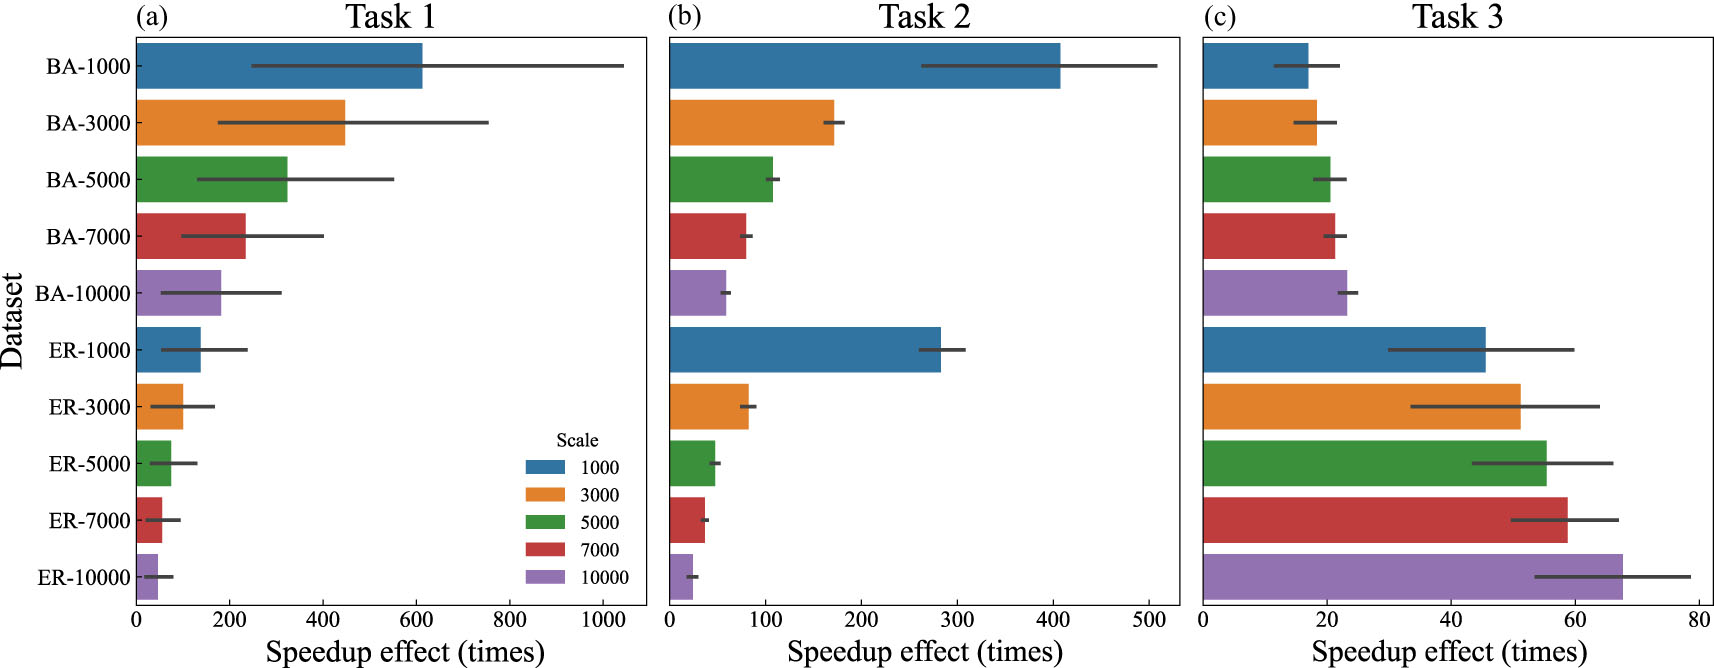
Figure 6. Speedup effect of GPIC over baseline algorithm in three tasks. It shows the speedup effect of the BA and ER network at different scales, with the same scale represented by the same color.
-
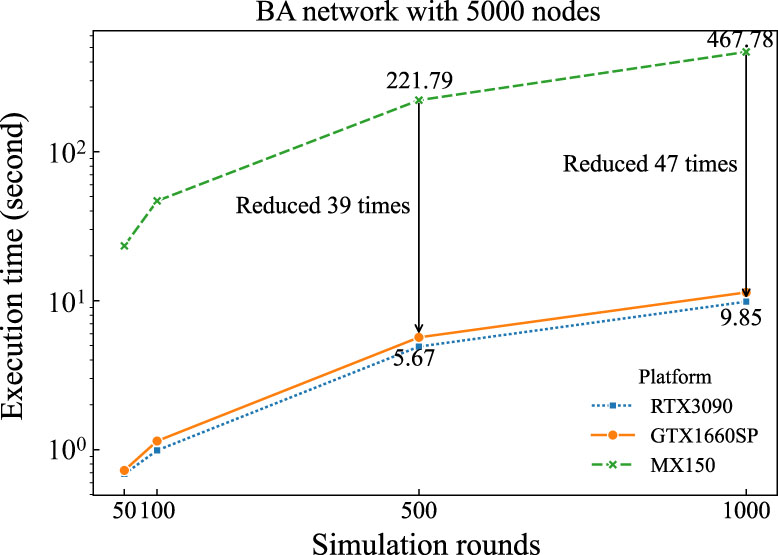
Figure 7. GPIC’s performance on various platforms with different types of hardware: MX150, GTX 1660SP, and RTX 3090.
-
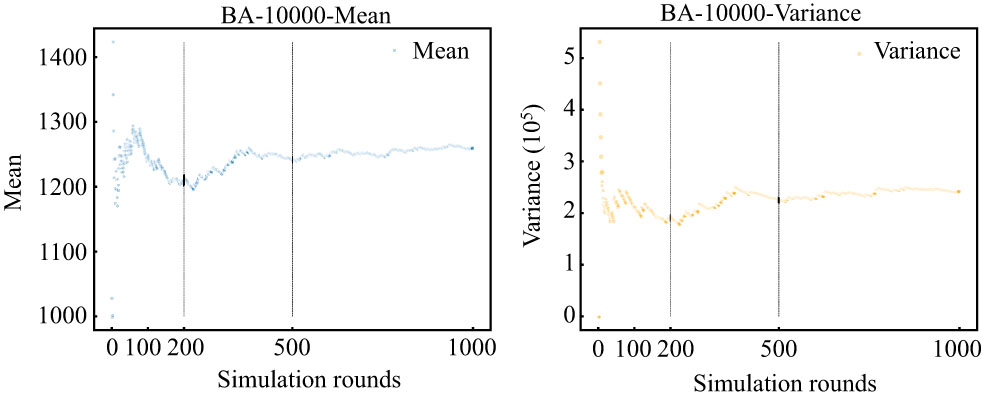
Figure 8. The correlation between rounds of simulation and spreading size (mean and variance) of a single seed.
Figure
9 ,Table
3 个