-
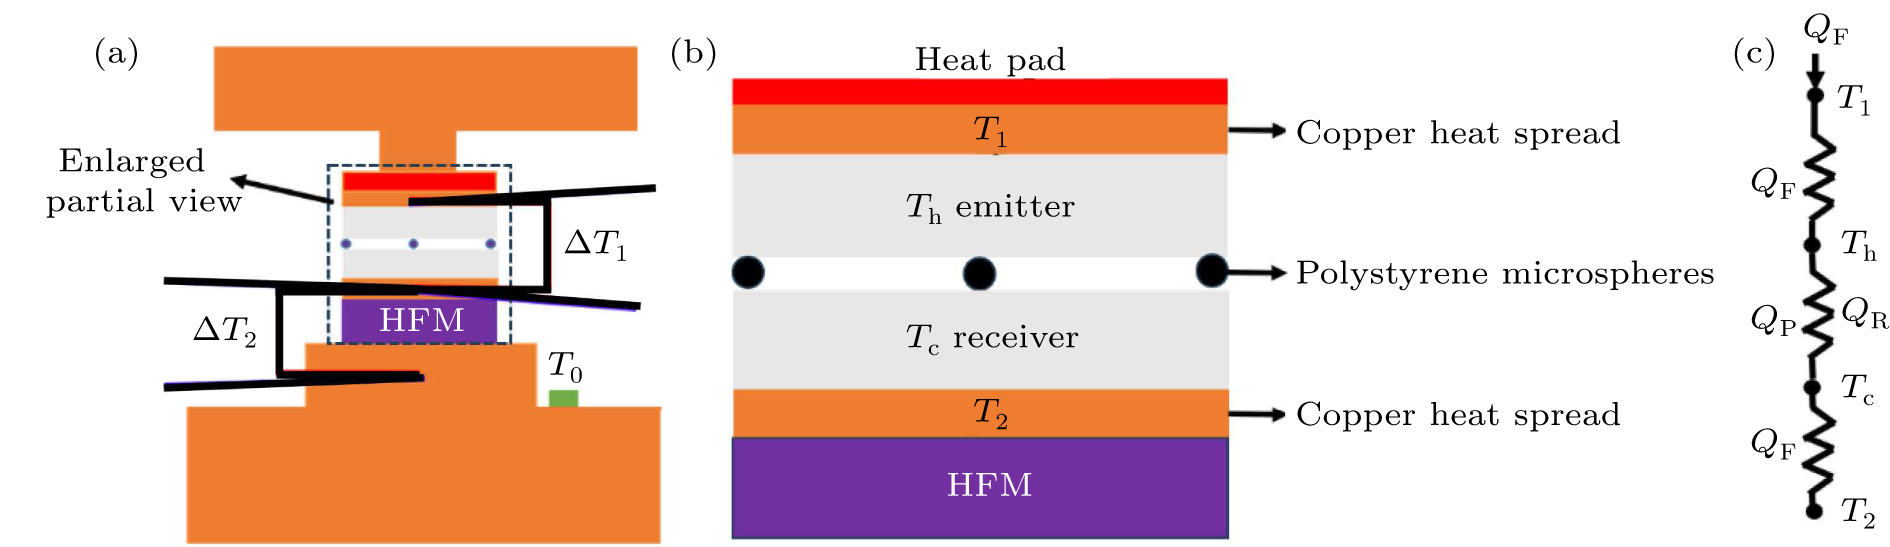
Figure 1. (a) Schematic diagram of the experimental device. (b) Magnified view of the region within the dashed-line box in panel (a). (c) Network diagram of heat flow paths.
-
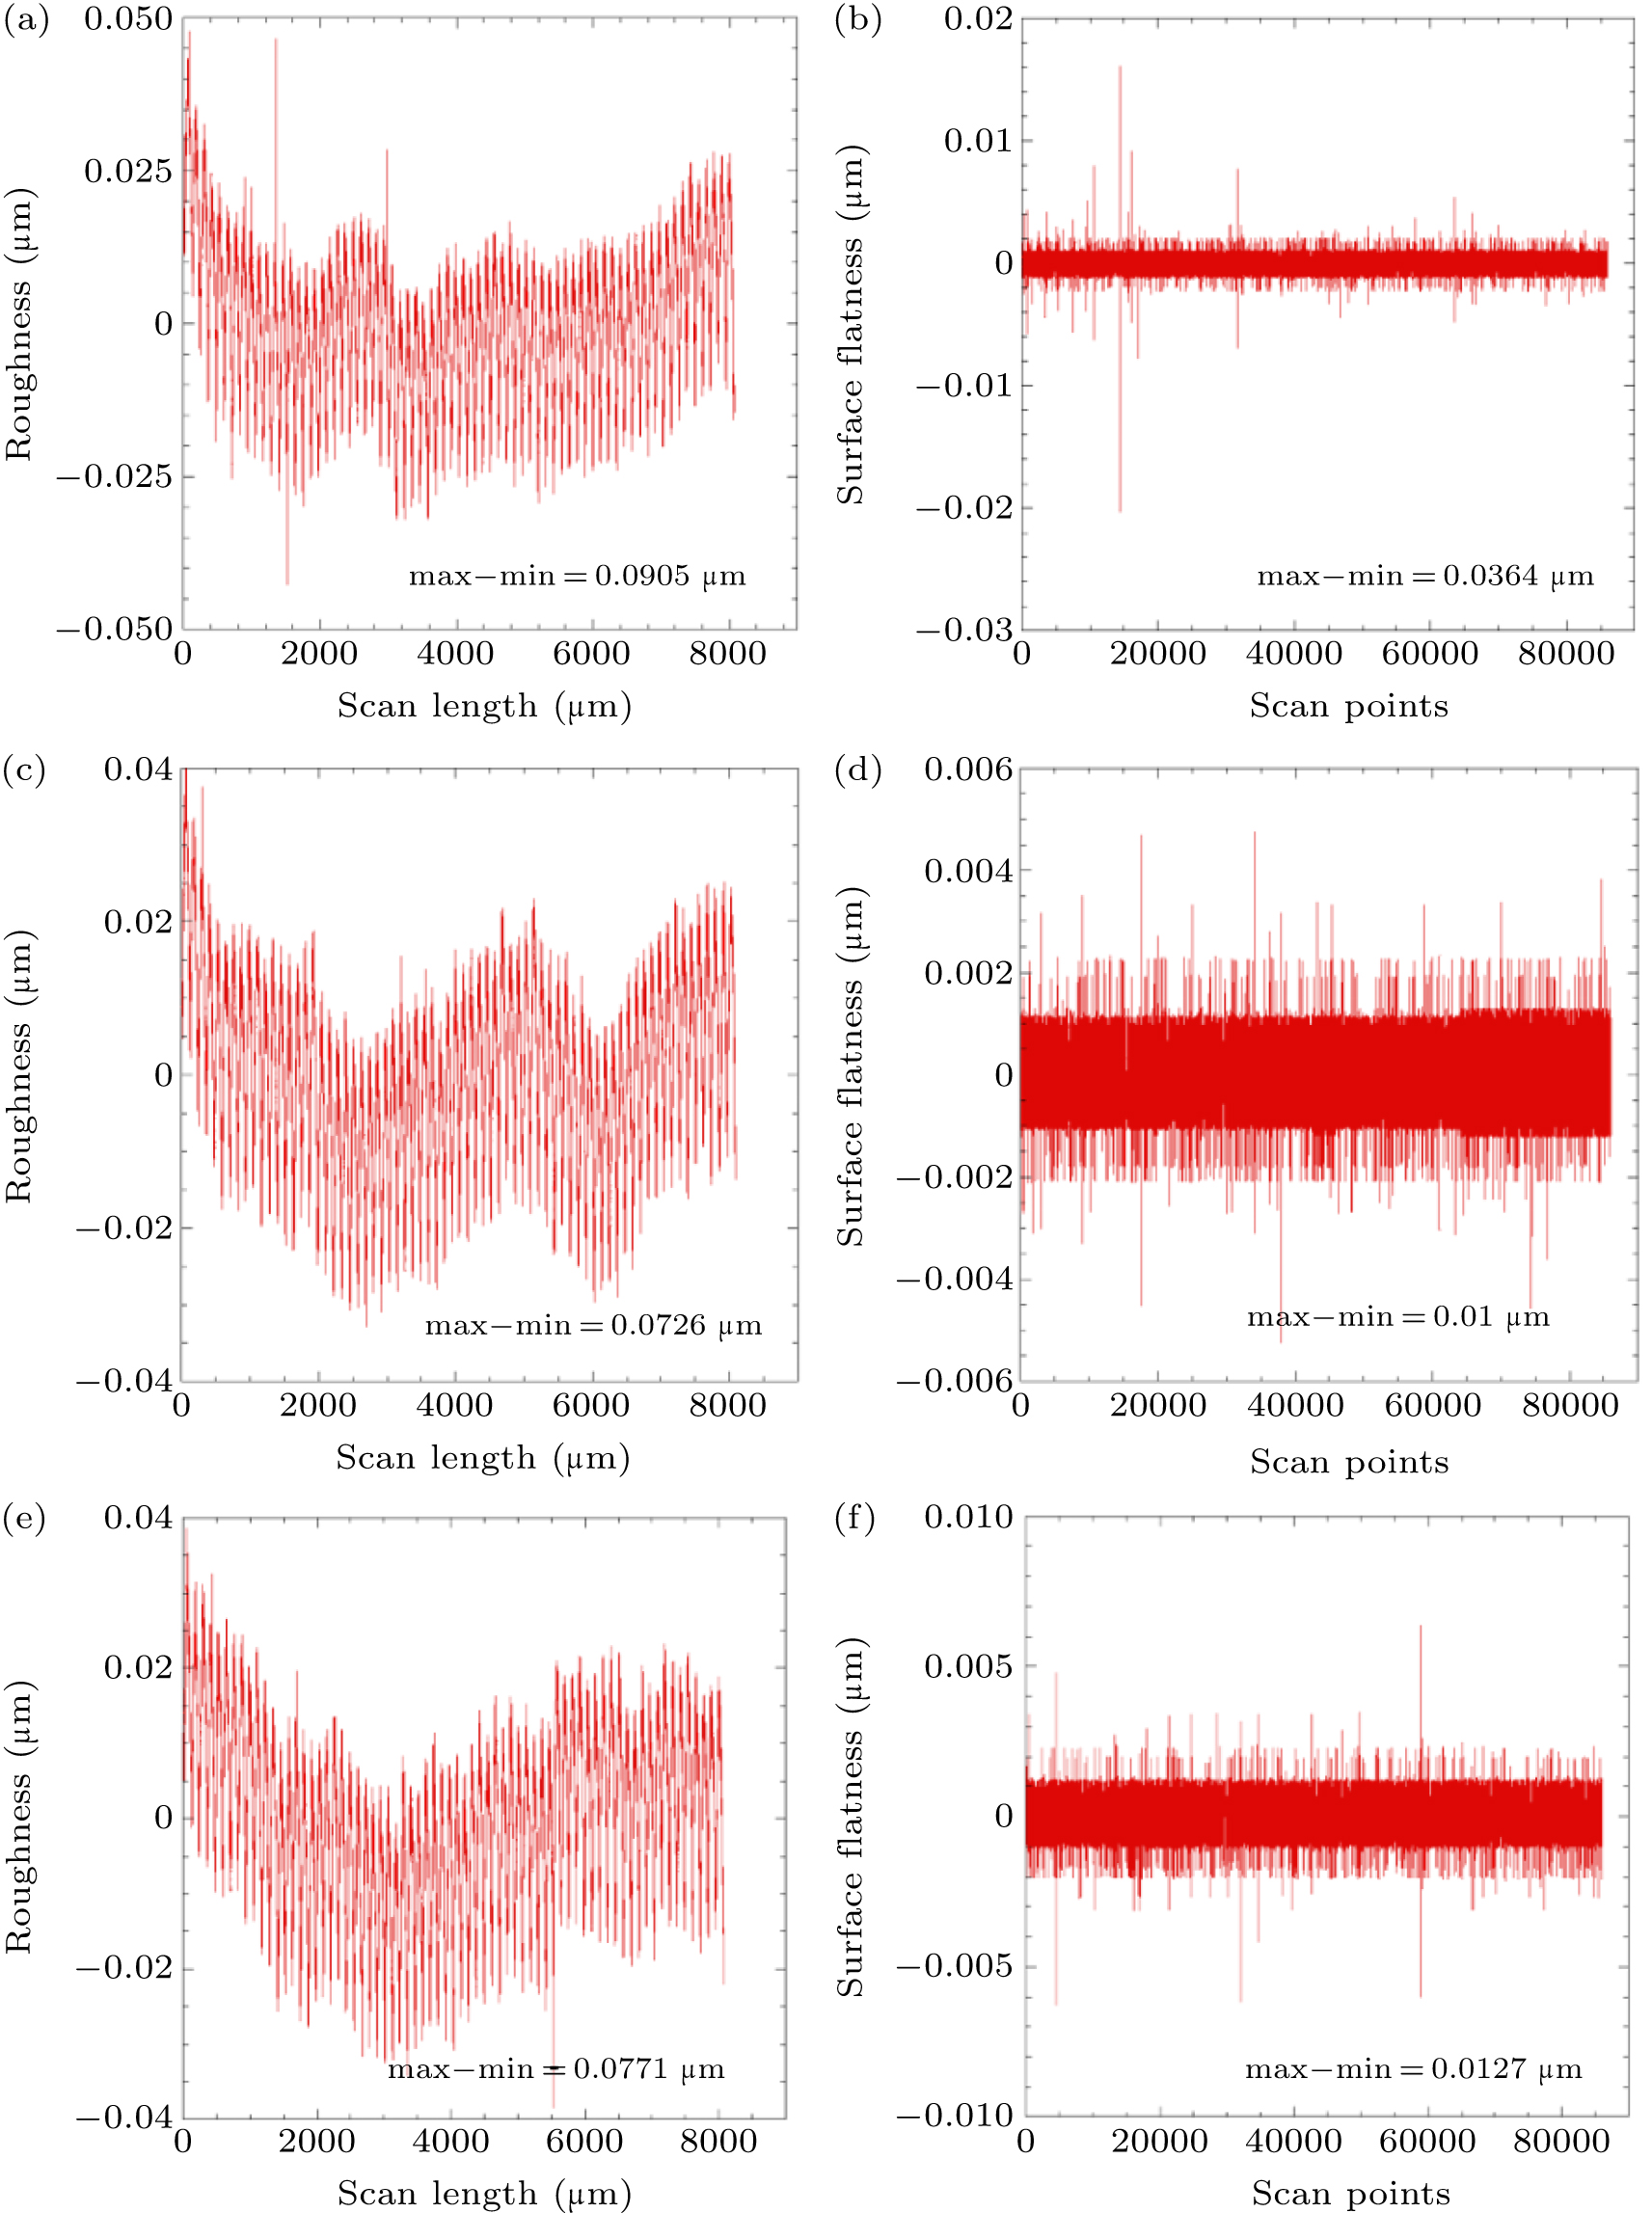
Figure 2. Roughness and surface flatness obtained by scanning the surface of the optical-glass sample in three directions with an optical microscope.
-
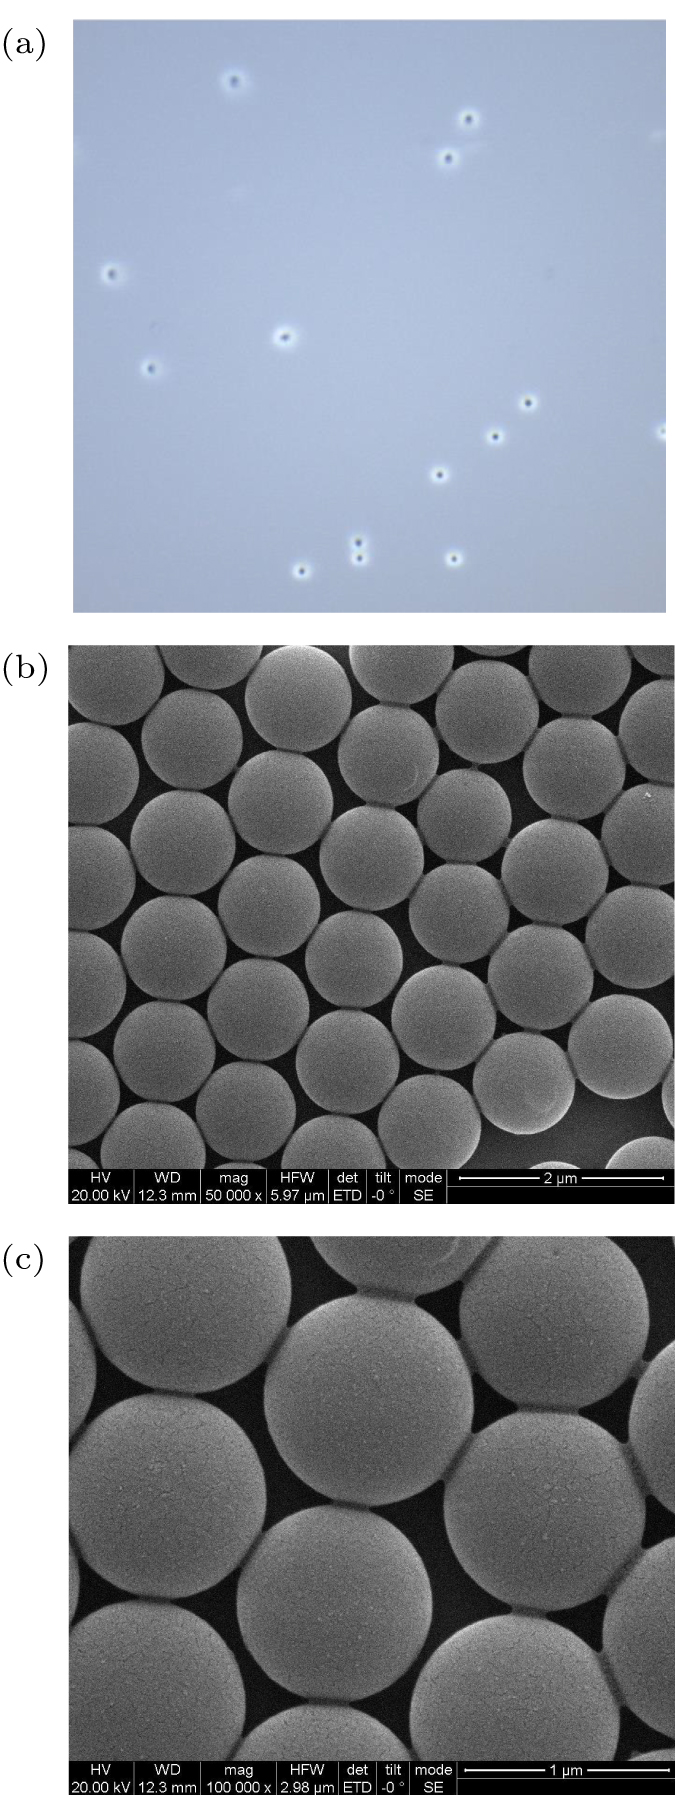
Figure 3. (a) Distribution of polystyrene particles on the sample under a 100× optical microscope. Panels (b) and (c) respectively show the particle consistency in the sampling inspection of polystyrene spheres under an electron microscope.
-
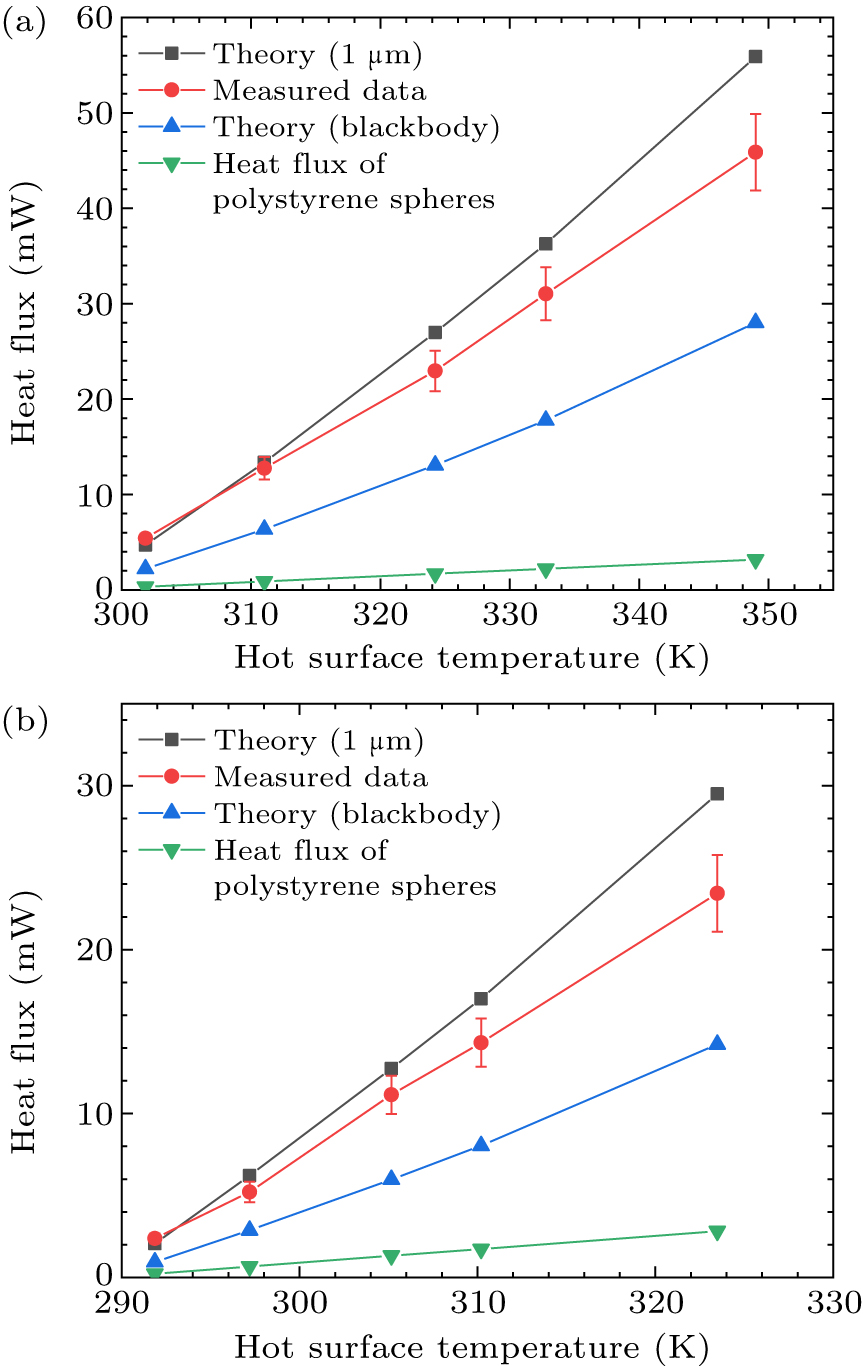
Figure 4. Experimental measurement of near-field thermal radiation between optical glass samples. (a) Number of polystyrene particles is approximately 500. (b) Number of polystyrene particles is approximately 750.
-
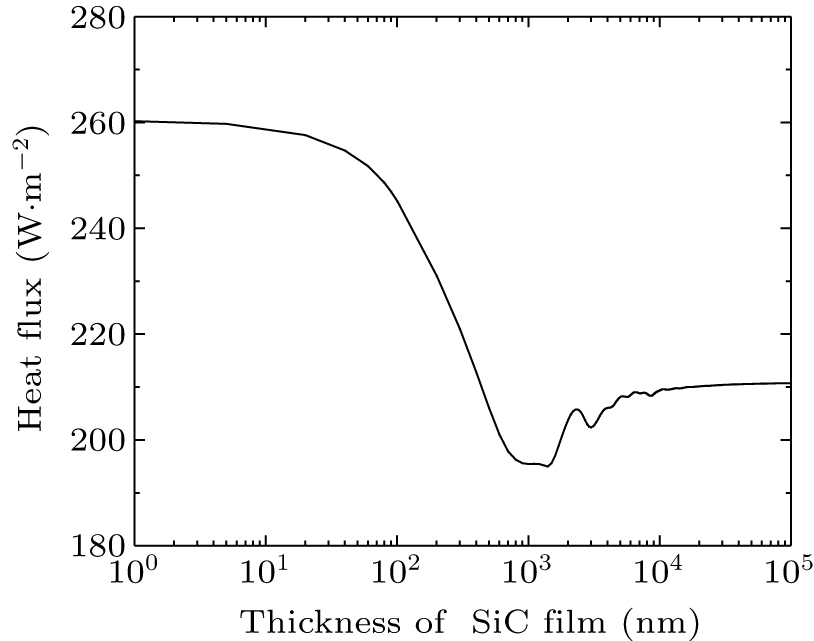
Figure 5. Heat flux varying with the different thicknesses of SiC film on the hot side.
-
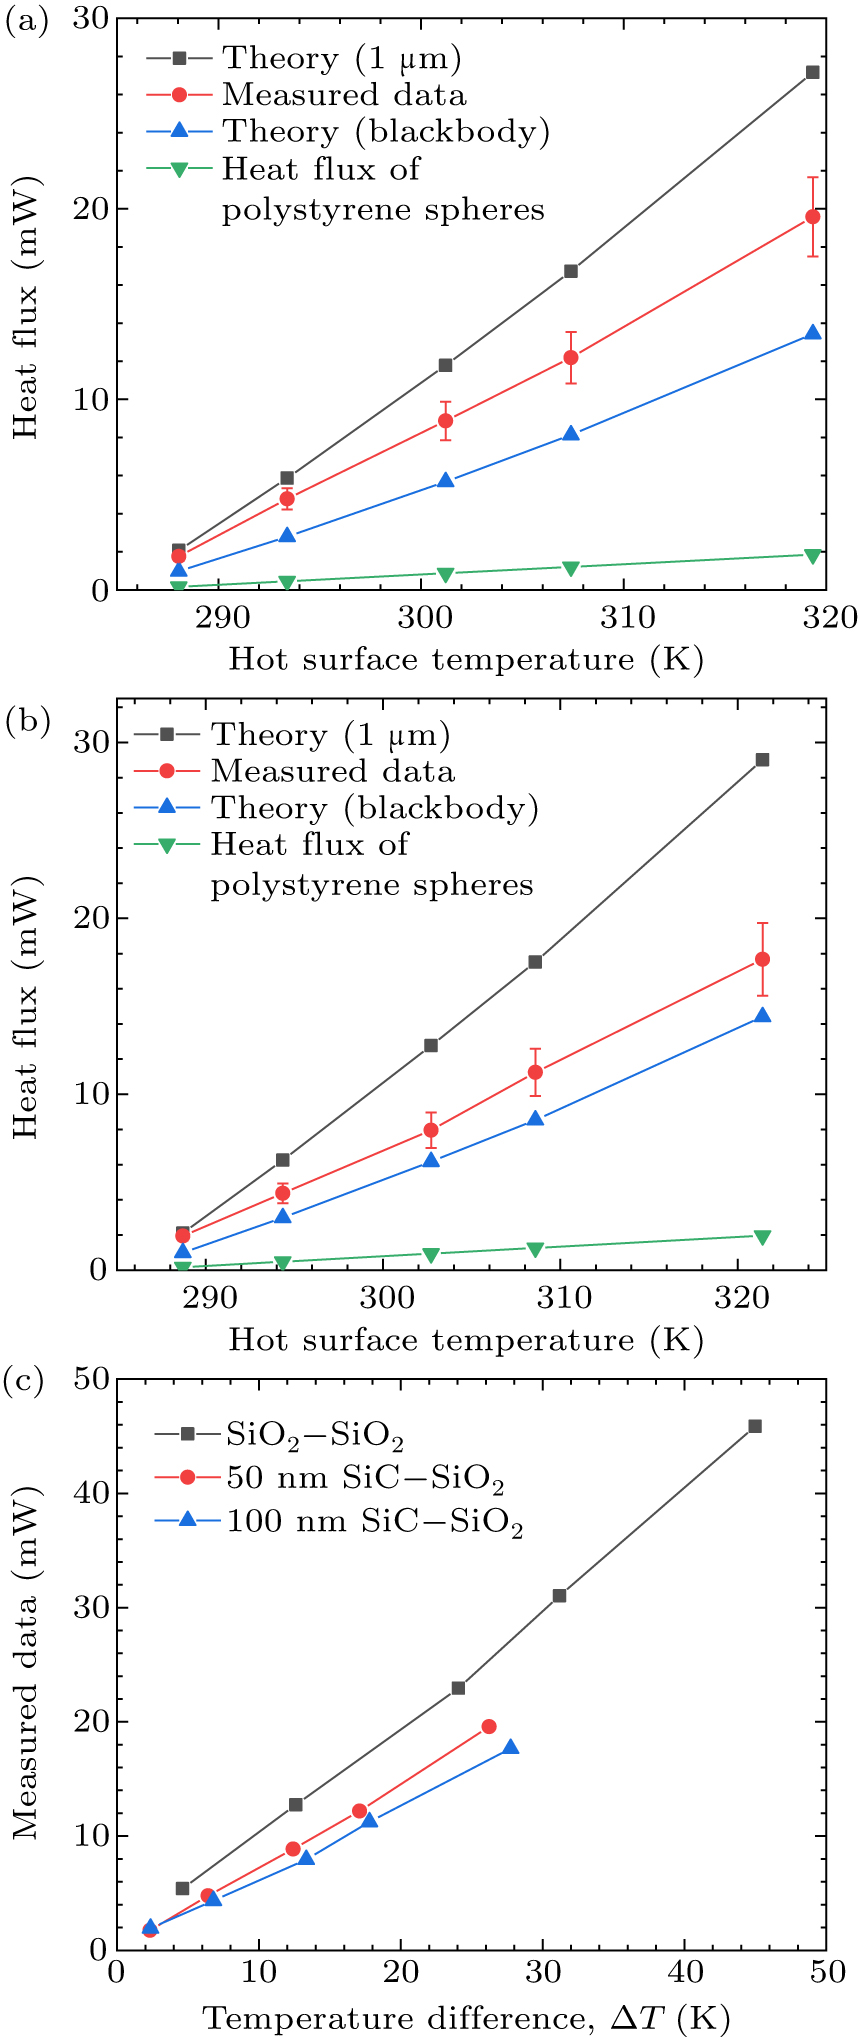
Figure 6. Experimental measurement of near-field thermal radiation between SiC film–SiO2: (a) 50 nm SiC–SiO2, (b) 100 nm SiC–SiO2 and (c) measured radiative heat flux at different thicknesses of SiC film versus temperature differences.
-
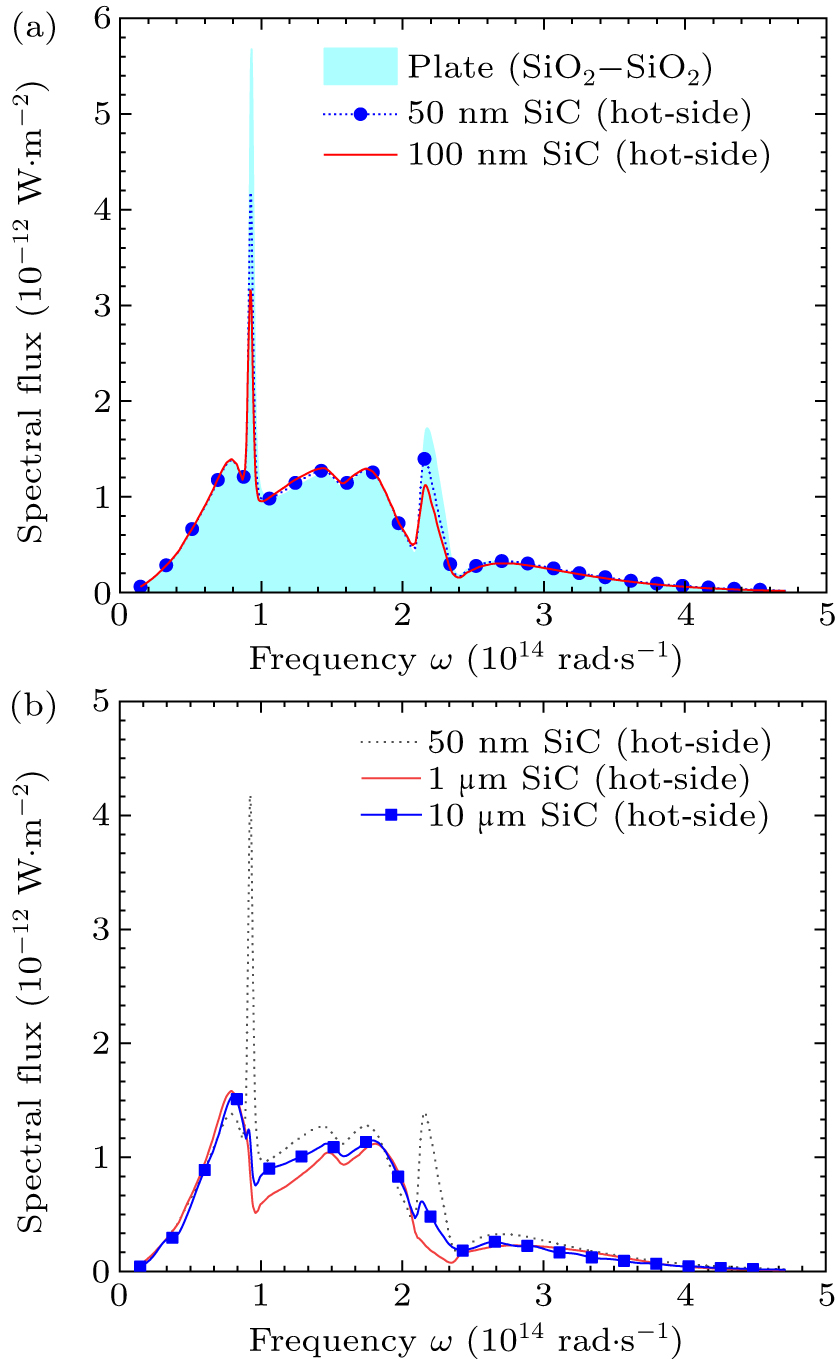
Figure 7. Spectral energy diagrams when the temperature of the hot side and the cold side are 310 K and 290 K, respectively, and the vacuum gap is 1 μm.
-
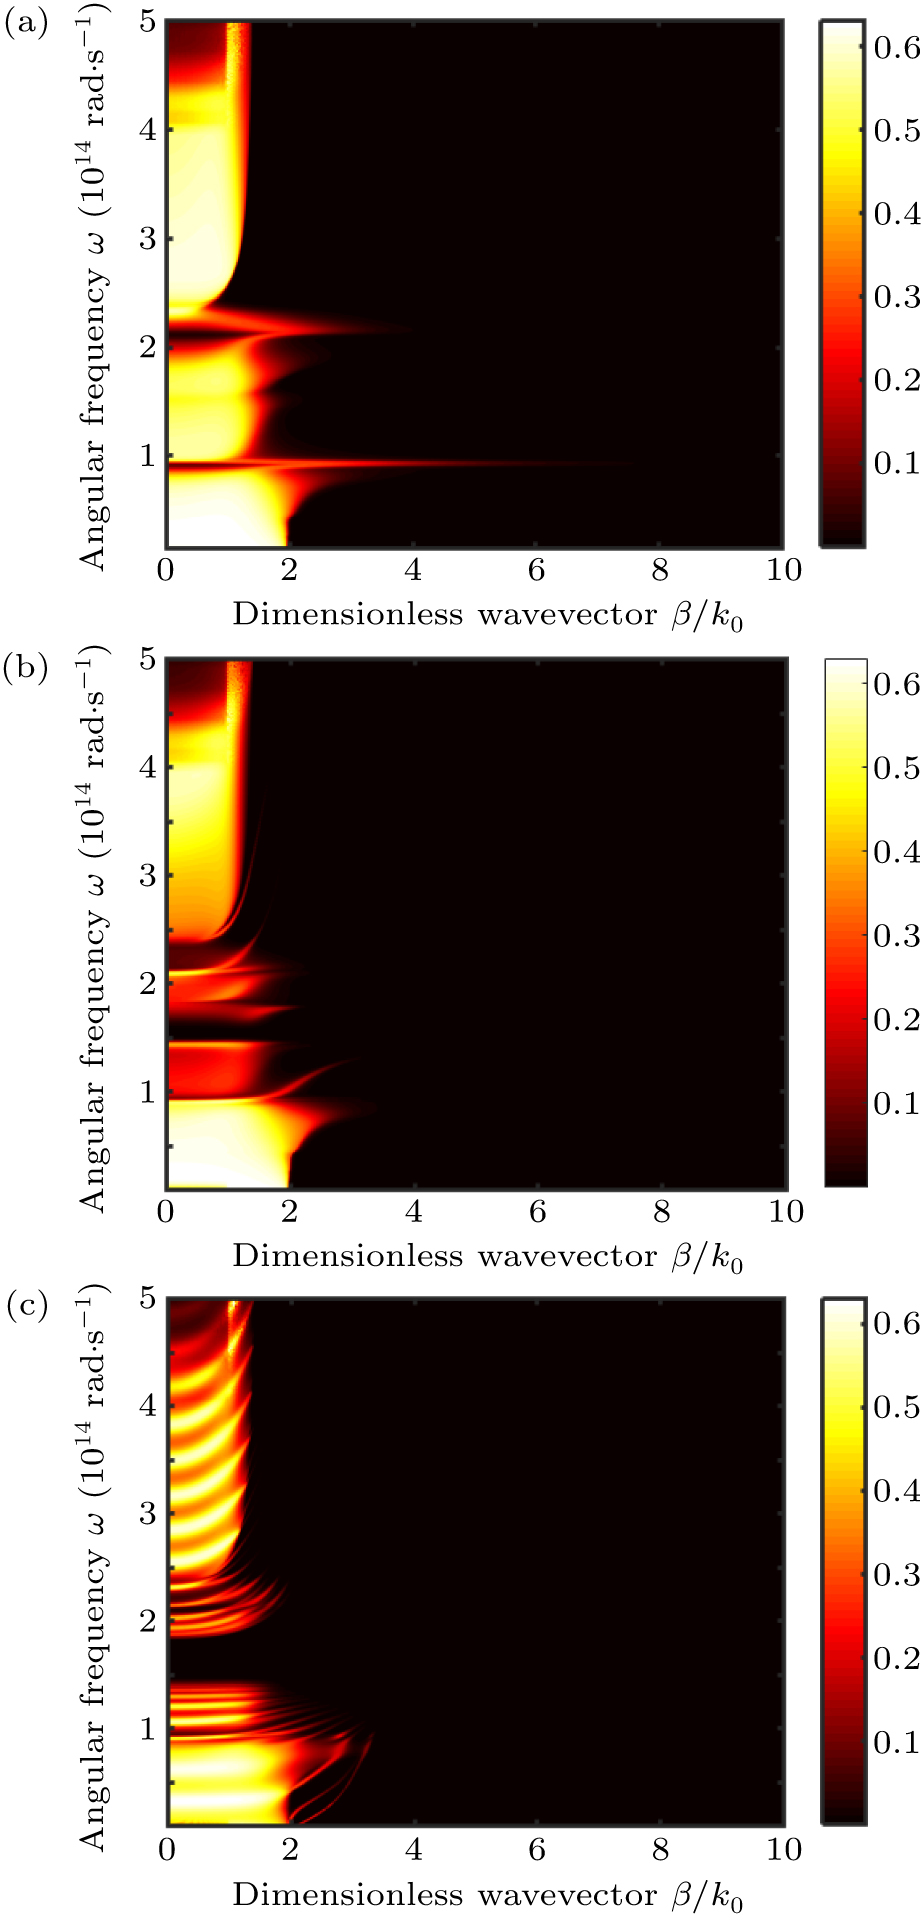
Figure 8. Transmission coefficient versus angular frequency and dimensionless wavevector. (a) 50 nm SiC–SiO2, (b) 1 μm SiC–SiO2 and (c) 10 μm SiC–SiO2.
Figure
8 ,Table
0 个