-
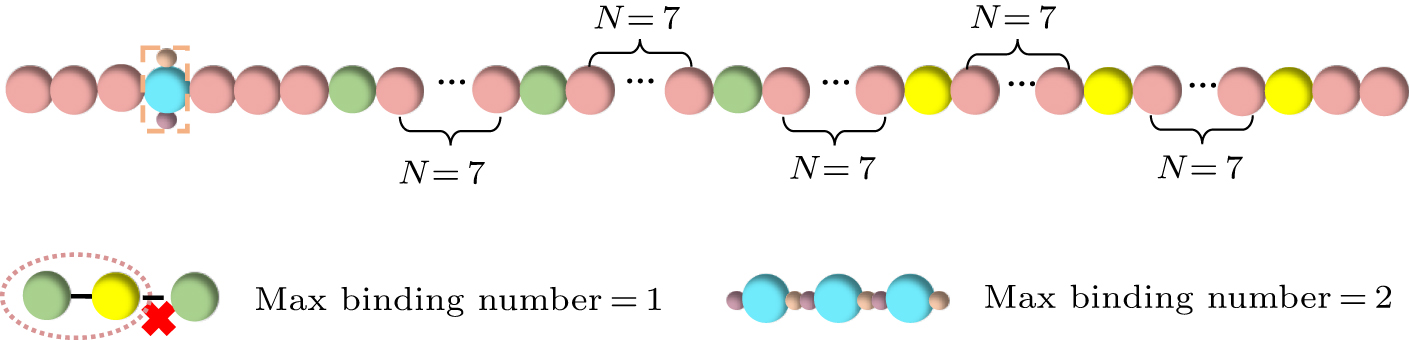
Figure 1. The schematic of the coarse-grained model for aging. Green particles represent sticker-A, yellow particles represent sticker-B, and pink particles represent the spacers connecting these stickers. The orange dashed-boxed patchy particles represent the aged particles, colored sky blue, with the two binding sites at both ends indicated by light orange and light watermelon red. The number of spacers between two stickers is set to 7. In the phase separation simulations, we set that binding can occur between two stickers, with a maximum binding number of 1. Similarly, binding can also occur between aging patchy particles, with a maximum binding number of 2. As the number of aging particles increases, a chained structure of aged particles can be formed.
-
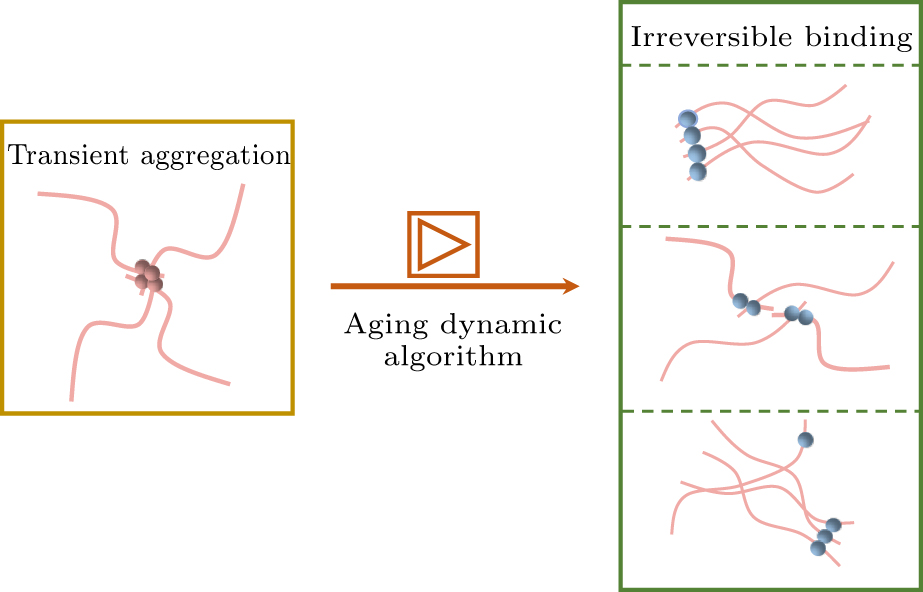
Figure 2. Schematic of the dynamic aging algorithm. A transient aggregation of at least four beads capable of aging is required to trigger the dynamic aging algorithm. Once triggered, the beads will transform the spacers into light blue beads, which are subsequently used to form aging structures. After the irreversible binding is formed, three possible scenarios may arise: the aging particles may form orientationally-dependent irreversible bonds, disperse and form different combinations of irreversible bonds.
-
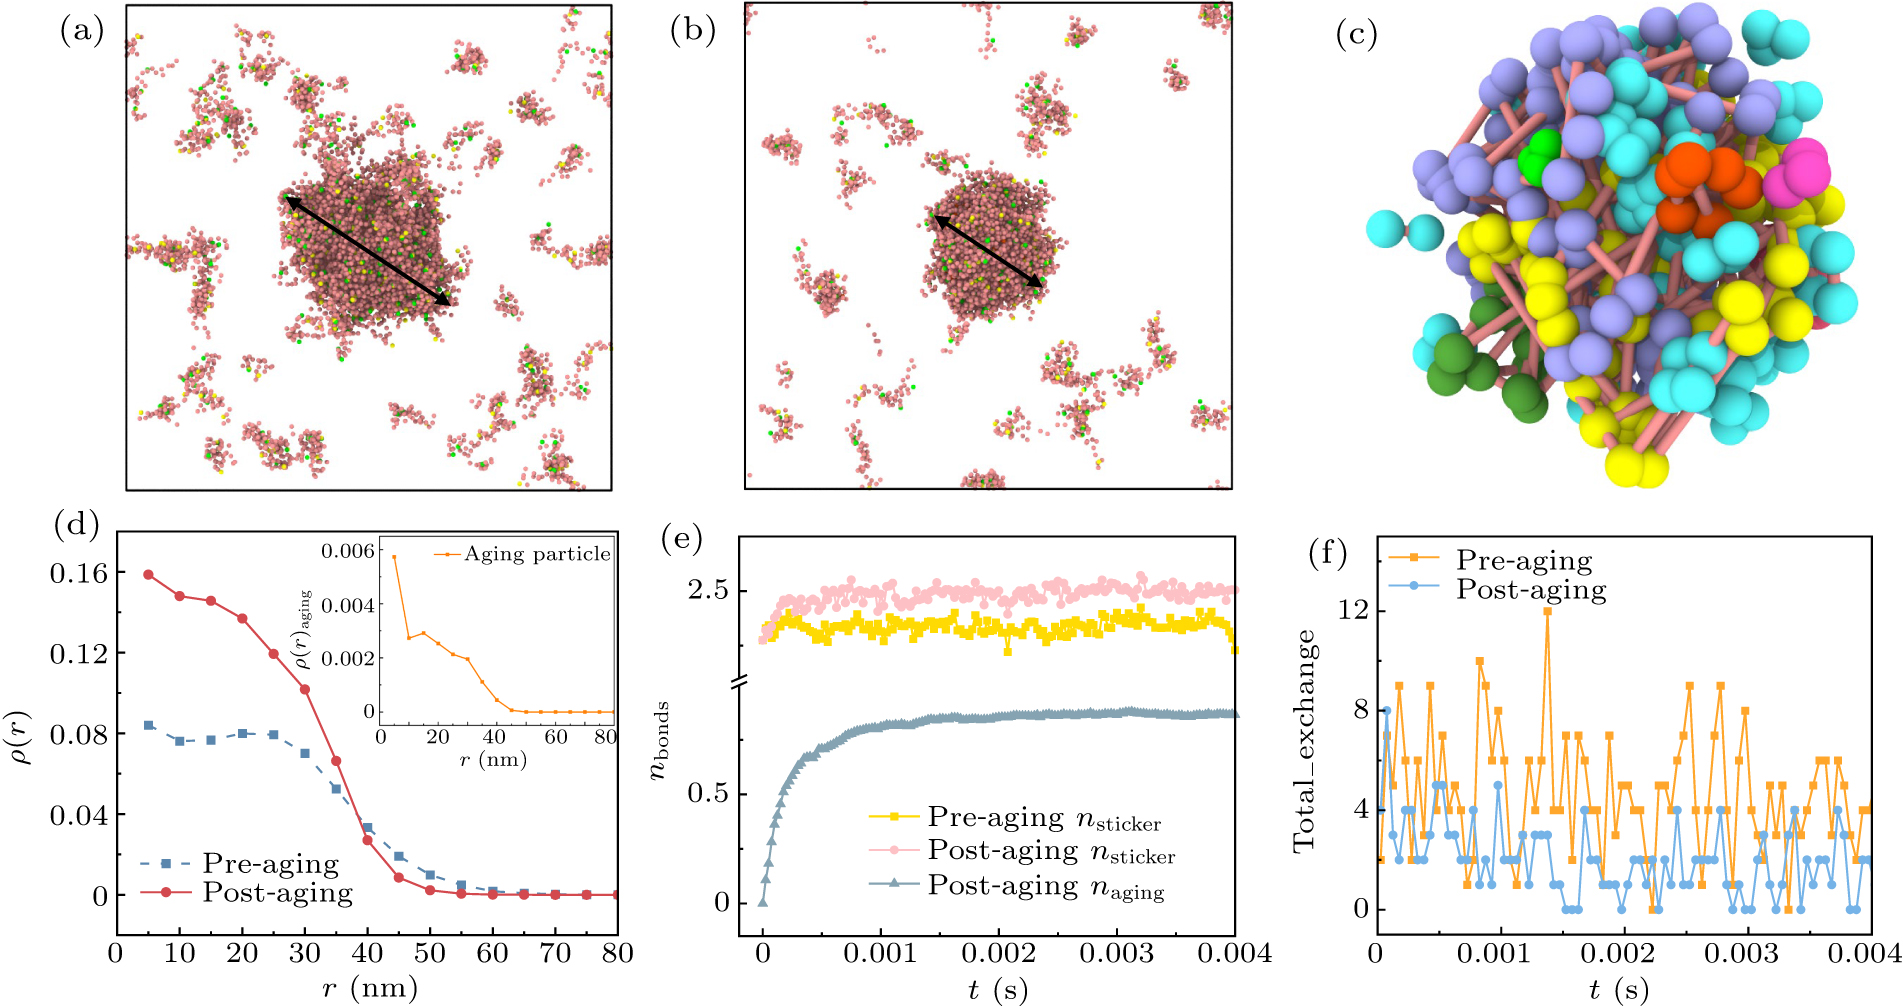
Figure 3. (a) Snapshot of the structure of the condensate pre-aging. (b) Snapshot of the structure of the condensate post-aging. (c) Snapshot showing only the aging particles within the condensates, with different colors representing various chains formed by aging particles. Irreversible bonds formed between aging particles are depicted as pink connections. (d) Comparison of the density distribution of the condensate pre- and post-aging, with the inset showing the density distribution of only the aging particles. (e) The number of bonds formed between stickers in each chain pre- and post-aging, and the time evolution of the number of bonds formed by aging particles in each chain post-aging. (f) The time evolution of the number of chains exchanging with the external environment.
-
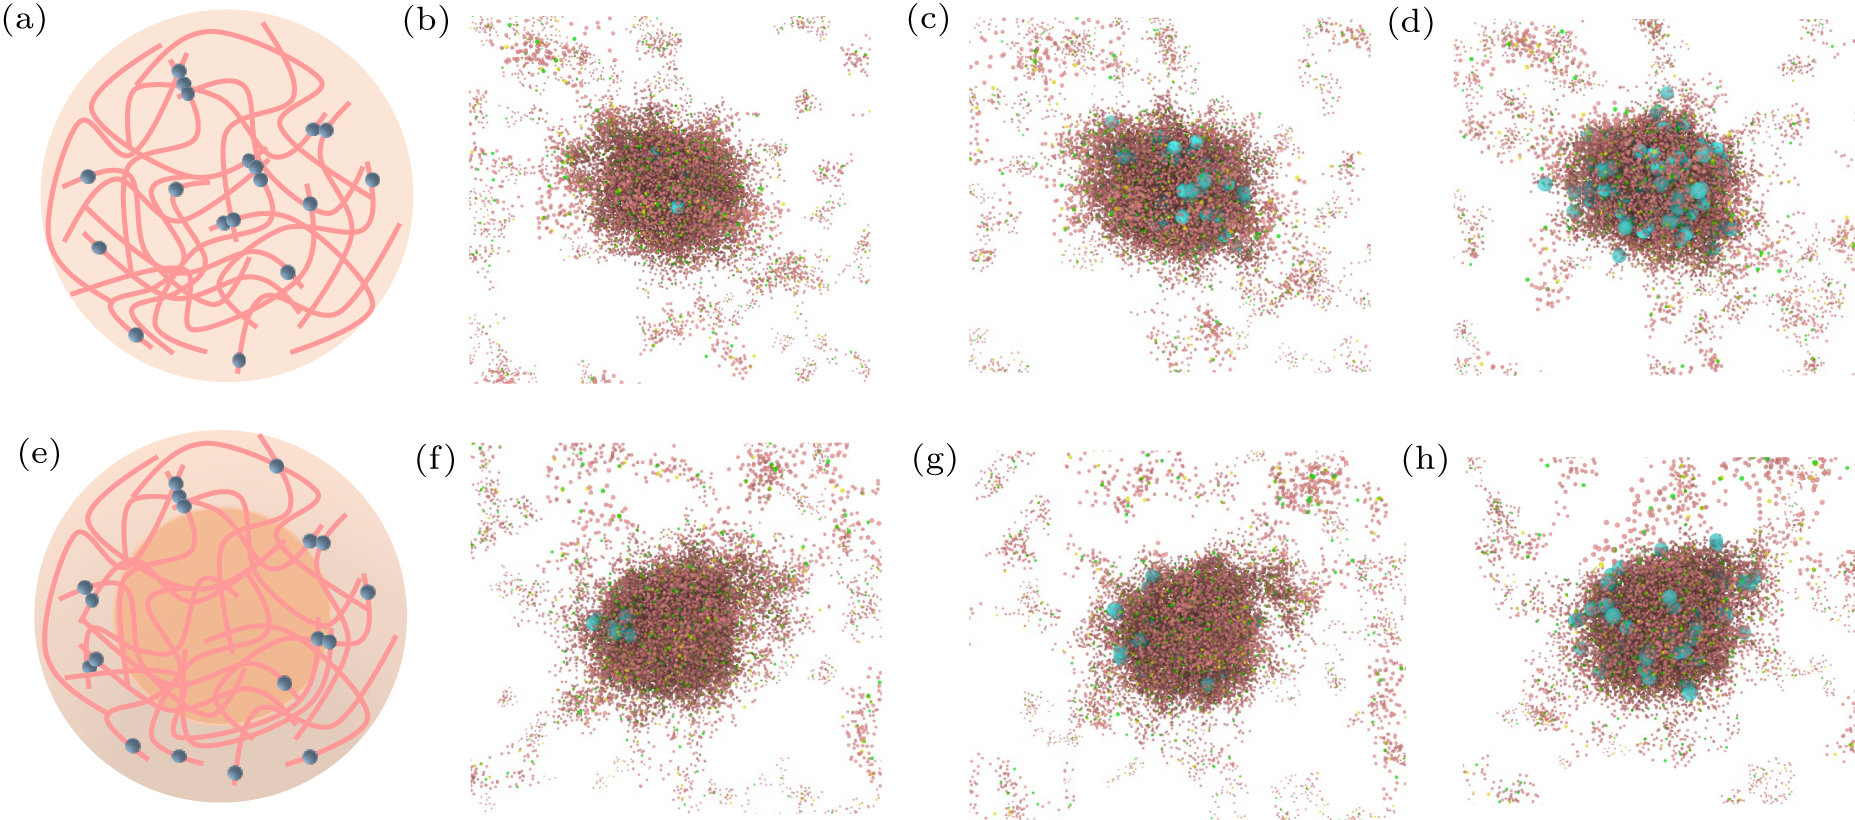
Figure 4. (a) Schematic representation of the distribution of aged particles under homogeneous diffusion rates within condensates. (b)–(d) Snapshots of the appearance of aged particles at different time points. (e) Schematic representation of the distribution of aged particles under heterogeneous diffusion rates within condensates. (f)–(h) Snapshots of the appearance of aged particles at different time points. In the snapshots, the light blue particles represent aged particles, the darker regions indicate areas of higher condensate density, and the lighter regions correspond to areas of lower density and the external environment.
-
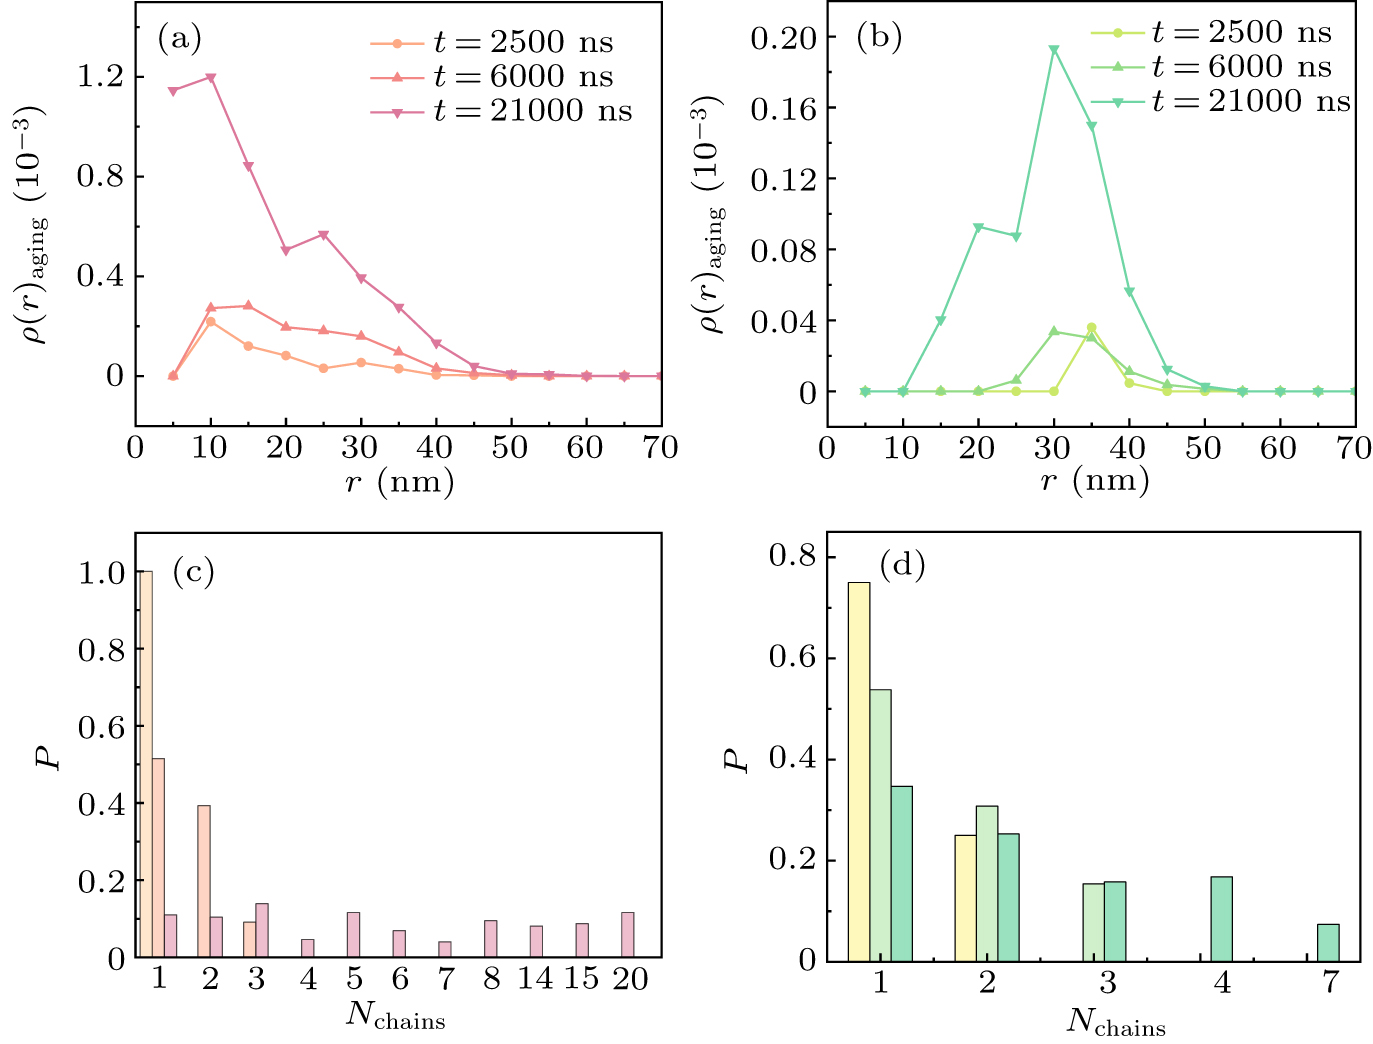
Figure 5. (a) Density distribution of aging particles in the case of homogeneous diffusion rates within the condensate. (b) Density distribution of aging particles in the case of heterogeneous diffusion rates within the condensate. (c) Probability distribution of aggregates formed by aging particles in the case of homogeneous diffusion rates within the condensate. (d) Probability distribution of aggregates formed by aging particles in the case of heterogeneous diffusion rates within the condensate.
-
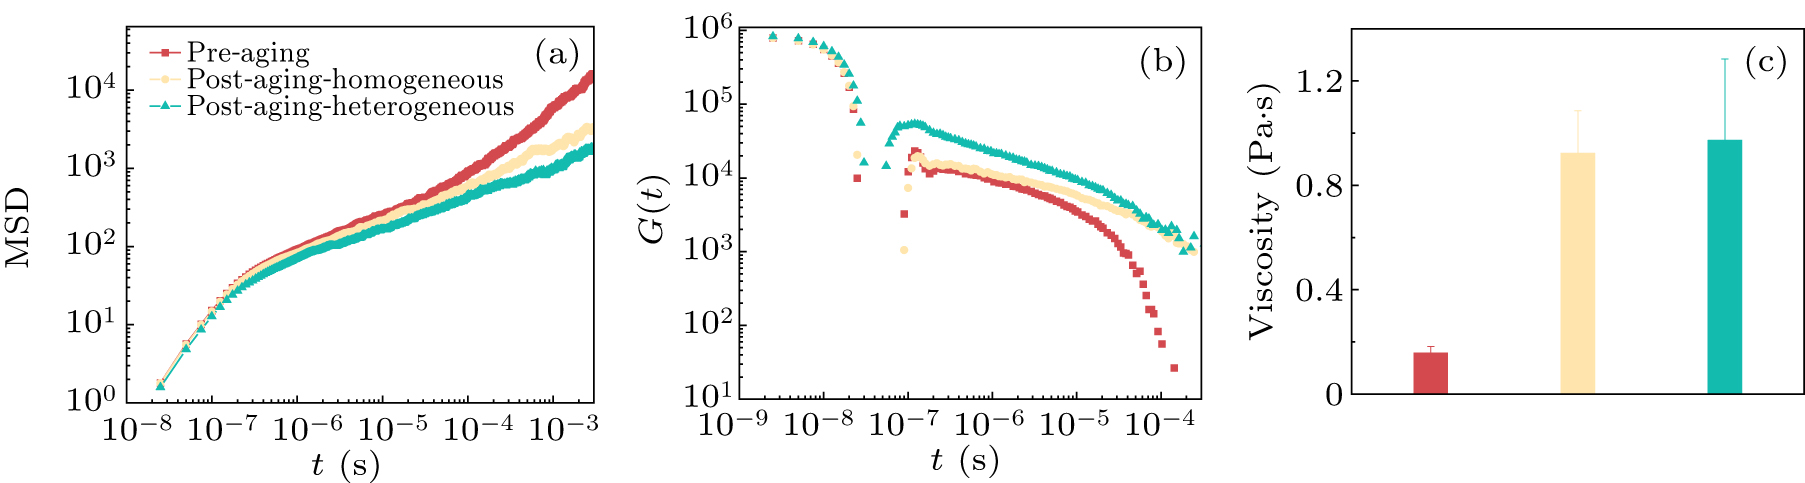
Figure 6. (a) Mean square displacement (MSD) of the system under three different environments. (b) Time evolution of the shear relaxation modulus of the condensate. (c) Comparison of the viscosity of the condensate in bar chart form.
Figure
6 ,Table
0 个