-
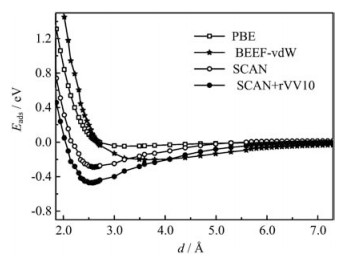
Figure 1. Potential energy surface of ethylene adsorption on Ag(111) as a function of adsorption height
$d$ between ethylene and Ag surface from different exchange-correlation functionals. -
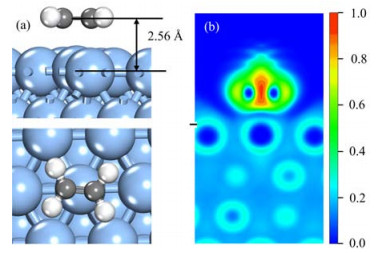
Figure 2. (a) Most stable structure optimized using SCAN+rVV10 functional for ethylene adsorption on Ag(111). (b) The corresponding electron localization function (ELF). Color varying from blue to red indicates a gradual increase of extent of the electron localization. The blue, grey, and white balls represent Ag, C, and H atoms, respectively.
-
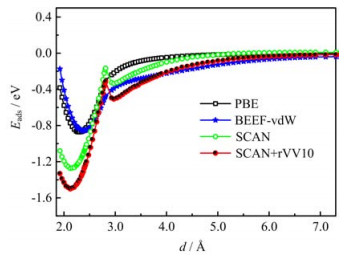
Figure 3. Potential energy surface of ethylene adsorption on Rh(111) as a function of adsorption height
$d$ between ethylene and Ag surface from different$xc$ -functionals. -
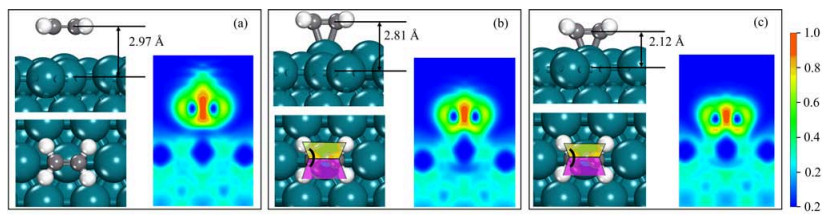
Figure 4. Schematic structures (left) and corresponding electronic localization function (right) from SCAN: the precursor physisorption state (a), the transition state (b), and the chemisorption state (c) for ethylene adsorption on Rh(111). The dihedral angles of the H1
$-$ C$-$ C$-$ H2 and H3$-$ C$-$ C$-$ H4 planes in ethylene are also indicated. The green, grey and white balls represent Rh, C, and H atoms, respectively. -
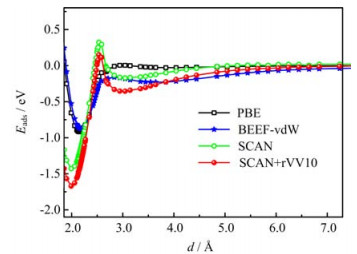
Figure 5. Potential energy surface of ethylene adsorption on Ir(111) as a function of adsorption height
$d$ between ethylene and Ag surface from different$xc$ -functionals. -

Figure 6. Structures of SCAN optimized precursor physisorption state (a), transition state (b), and most stable state (c) for ethylene adsorption on Ir(111) with the corresponding ELF. The dihedral angles of the H1
$-$ C$-$ C$-$ H2 and H3$-$ C$-$ C$-$ H4 planes in ethylene are also labeled. The blue, grey, and white balls represent Ir, C and H atoms, respectively.
Figure
6 ,Table
1 个