-
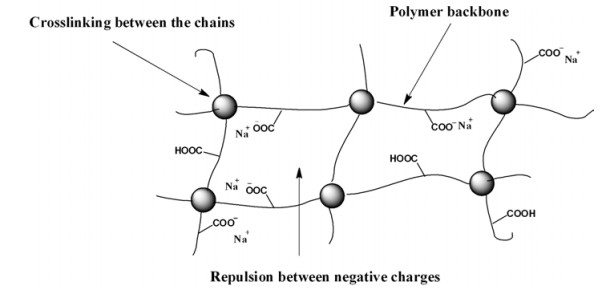
Figure Scheme 1. Schematic illustration of SAPC particles and their fabrication.
-
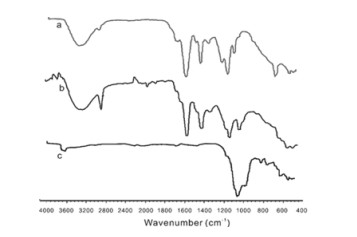
Figure 1. FT-IR spectra of (a) polyacrylic acid, (b) SAPC, and (c) China clay.
-
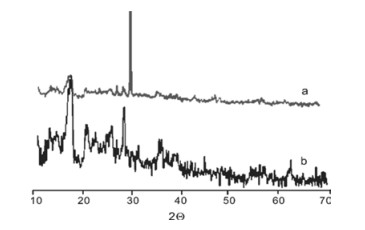
Figure 2. XRD spectra of (a) china clay and (b) SAPC.
-
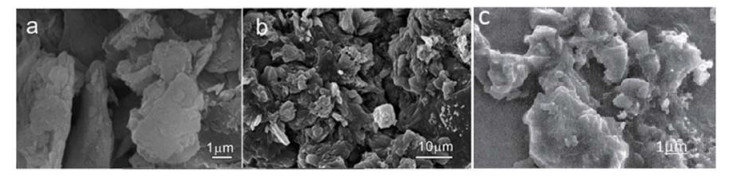
Figure 3. SEM of (a) China clay, (b) SAPC with 45 wt% of China clay, and (c) polyacrylic acid.
-
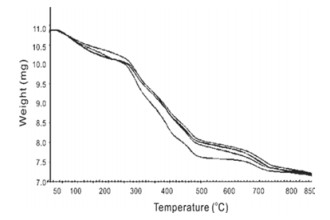
Figure 4. TGA spectra of SAPCs with different clay contents 50 wt%, 45 wt%, 40 wt%, and 30 wt% from top to bottom.
-
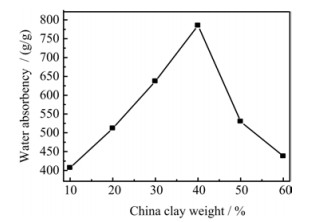
Figure 5. Effect of amount of China clay on water absorbency, with AA (35%), crosslinker (0.5), and initiator (0.3%) by weight.
-
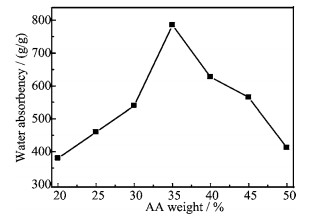
Figure 6. Effect of amount of acrylic acid on water absorbency, with clay (40%), crosslinker (0.5), and initiator (0.3%) by weight.
Figure
7 ,Table
0 个