-

Figure 1. Structural sketch with atomic labels for 1, 2, 4-triazole-3-carboxylic acid (TCA), three tautomers of 1, 2, 4-triazole-3-carboxylate anion (TC
$^-$ ), and the deprotonated 1, 2, 4-triazole-3-carboxylate dianion (dpTC$^{2-}$ ). -
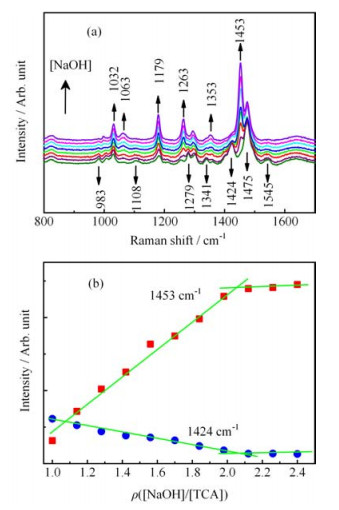
Figure 2. (a) Raman spectra with step-by-step adding 0.024 mL NaOH solution (2.5 mol/L) into 1 mL the alkaline solution of TCA. The initial concentration of TCA is 0.5 mol/L in alkaline solutions. (b) Intensities of the two bands at 1453 and 1424 cm
$^{-1}$ vs. the molar concentration ratio of [NaOH]/[TCA]. -
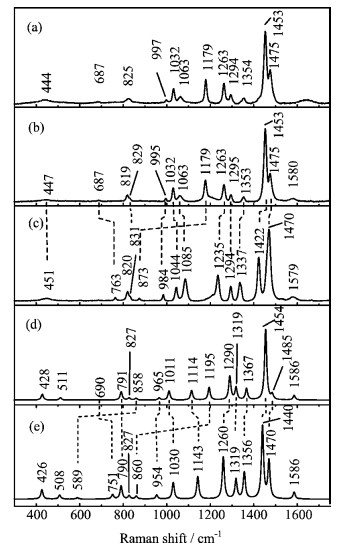
Figure 3. Experimental (a, b, c) and calculated (d, e) Raman spectra of dpTC
$^{2-}$ and d-dpTC$^{2-}$ . (a) dpTC$^{2-}$ in NaOH/H$_2$ O solution, (b) dpTC$^{2-}$ in NaOD/D$_2$ O solution, (c) d-dpTC$^{2-}$ in NaOD/D$_2$ O solution, (d) dpTC$^{2-}$ in H$_2$ O, and (e) d-dpTC$^{2-}$ in D$_2$ O. -
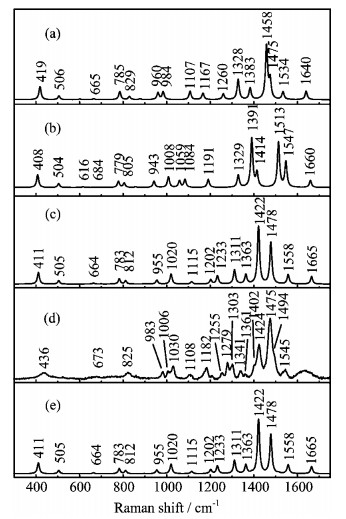
Figure 4. The calculated Raman spectra of TC
$^-$ : (a) tautomer (1H)TC$^-$ , (b) tautomer (4H)TC$^-$ , (c) tautomer (2H)TC$^-$ . (d) The experimental Raman spectrum of TC$^-$ in aqueous solution. (e) Tautomer-distribution-weighted avearge spectrum. -
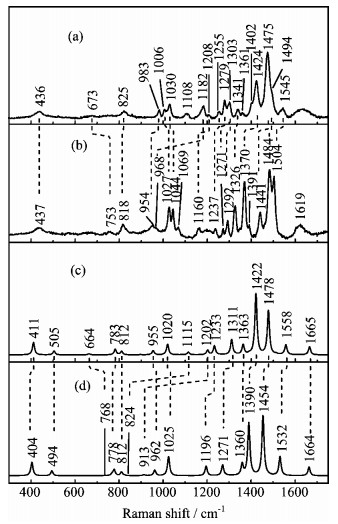
Figure 5. The experimental Raman spectra of (a) TC
$^-$ in H$_2$ O solution and (b) d-TC$^-$ in D$_2$ O solution; and the calculated Raman spectra of (c) (2H)TC$^-$ and (d) d-(2H)TC$^-$ . -
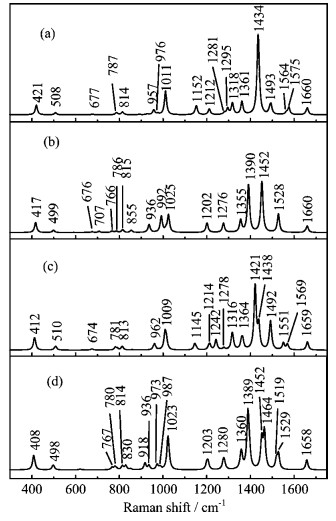
Figure 6. The calculated Raman spectra of (a) dimer 1 and (b) dueterated dimer 1, (c) dimer 2 and (d) dueterated dimer 2.
Figure
6 ,Table
3 个