-
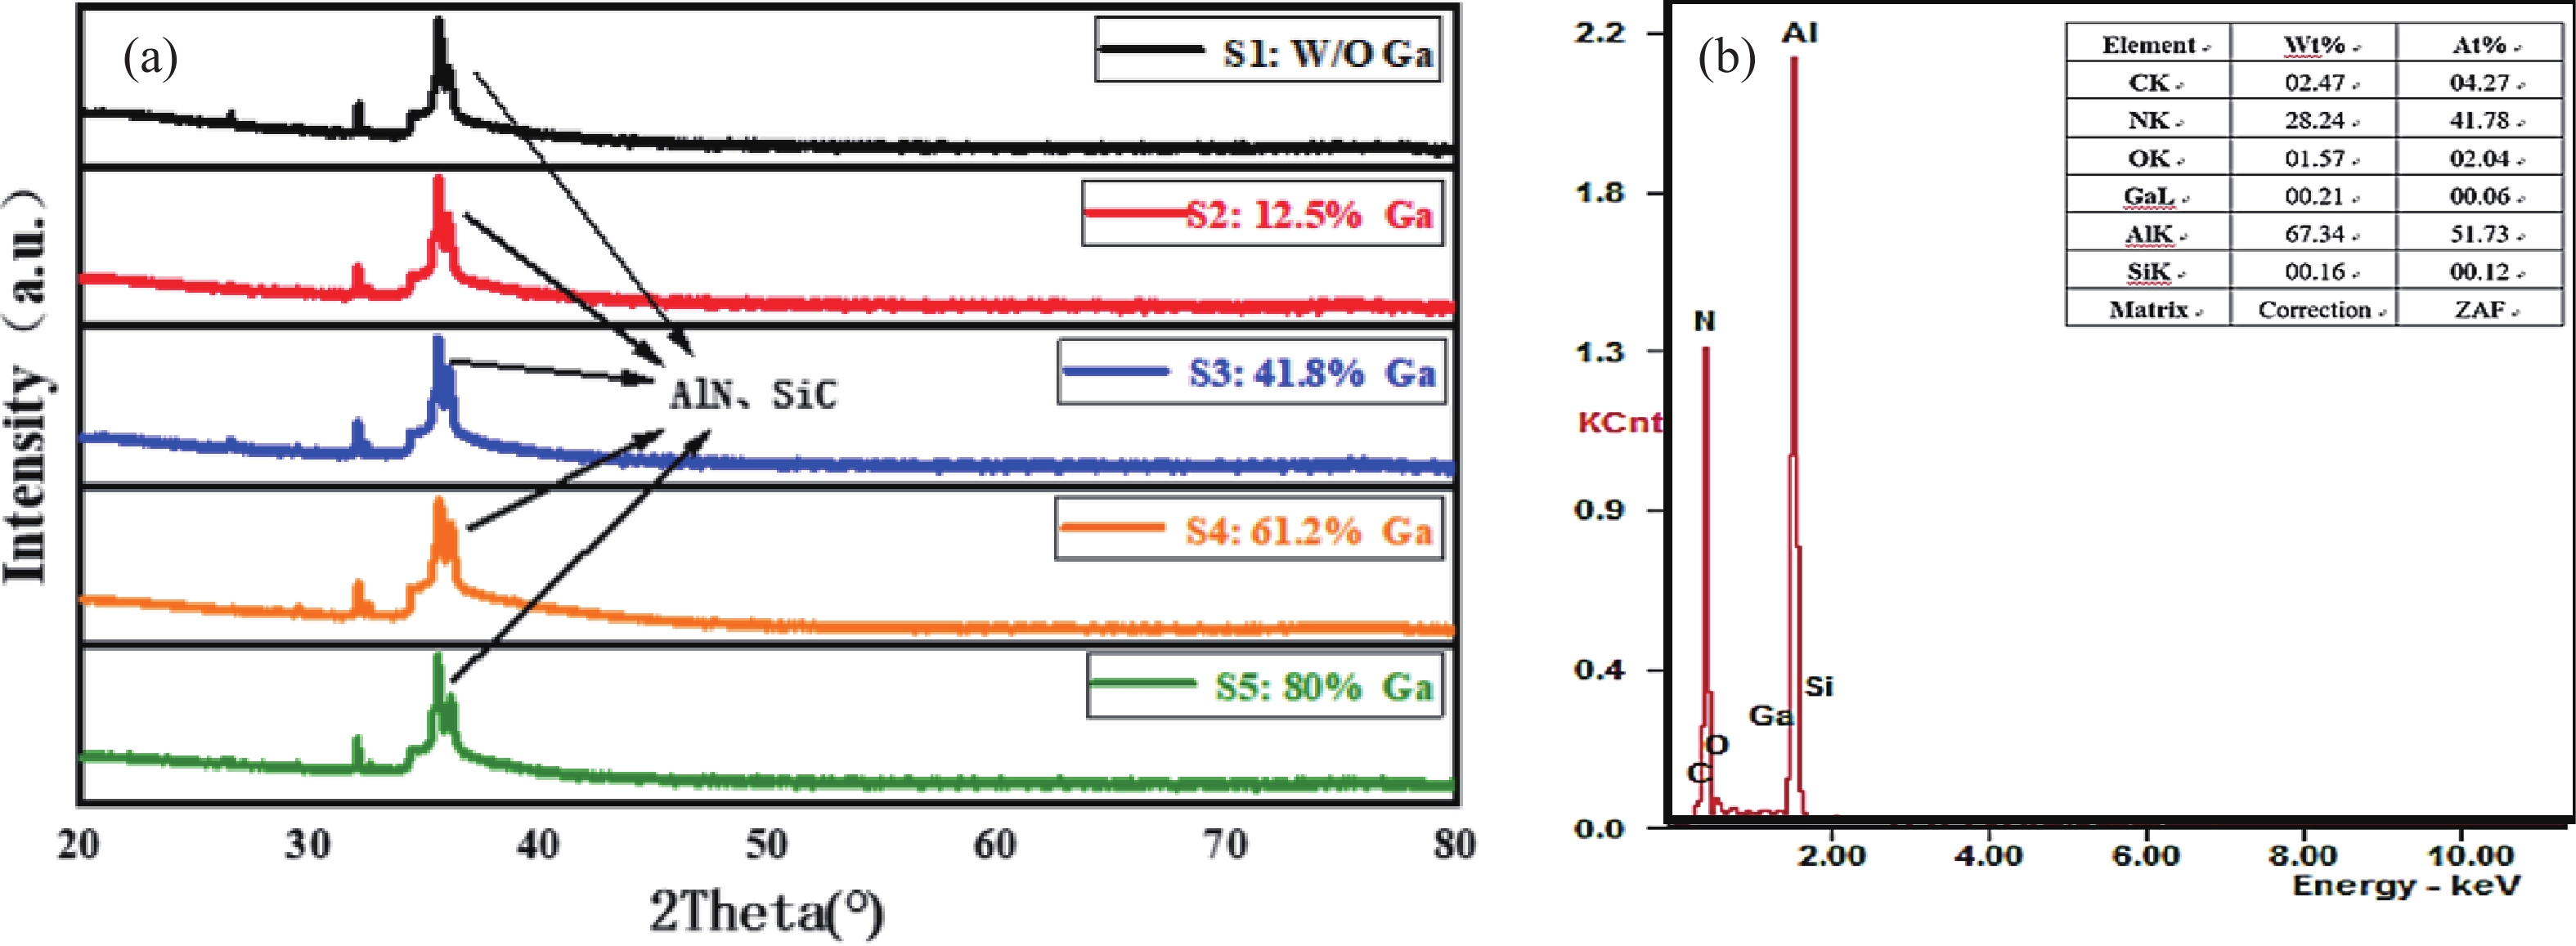
Figure Fig. 1. (Color online) (a) XRD spectra of Ga-assisted AlN films under varying TMGa flow rates respectively, (b) EDS spectra of Ga-assisted AlN sample S5.
-
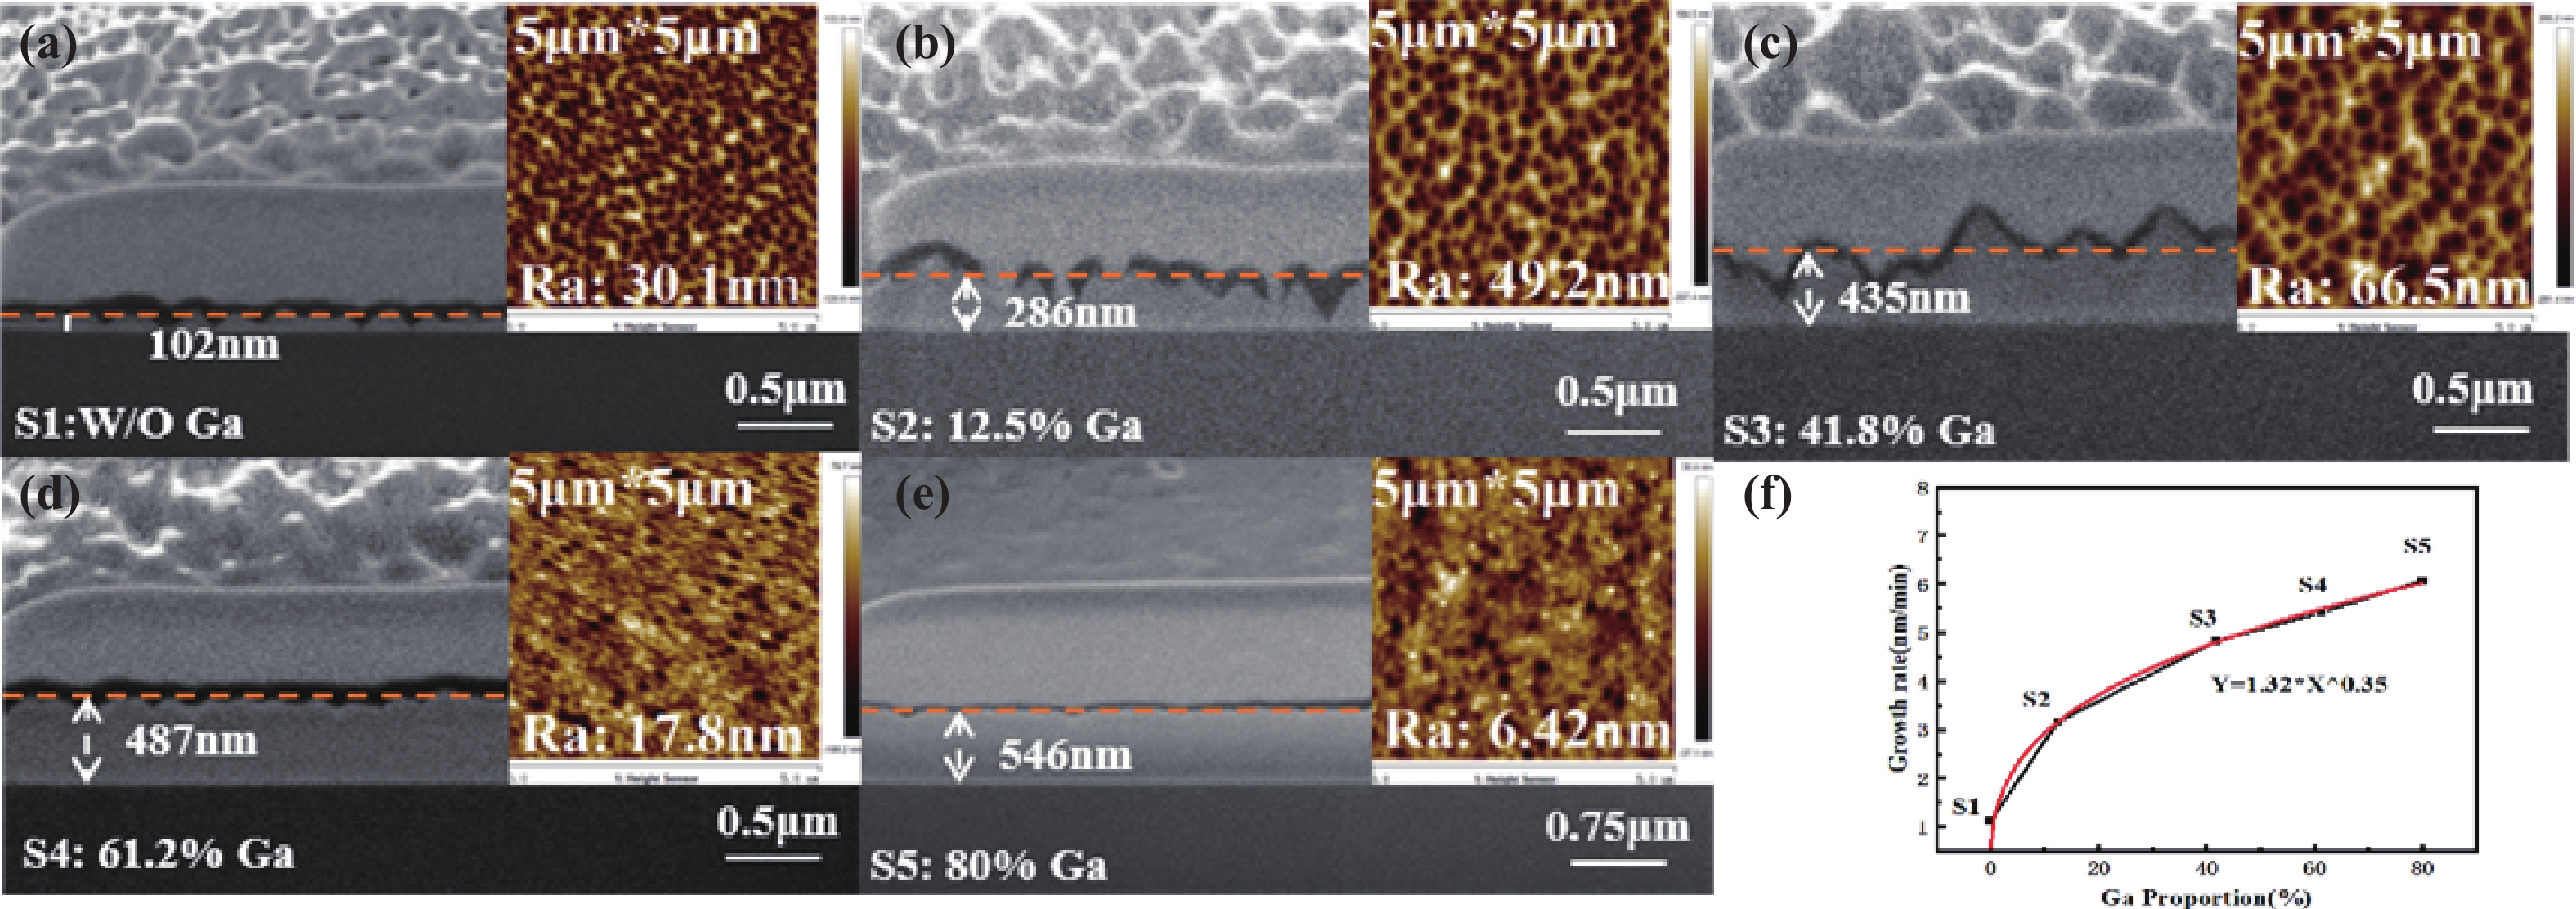
Figure Fig. 2. (Color online) (a)−(e) The cross-sectional SEM images of Ga-assisted AlN films grown under different TMGa flow rates and corresponding 5 × 5 μm2 AFM images, (f) Ga-assisted AlN growth rates as a function of Ga proportion.
-
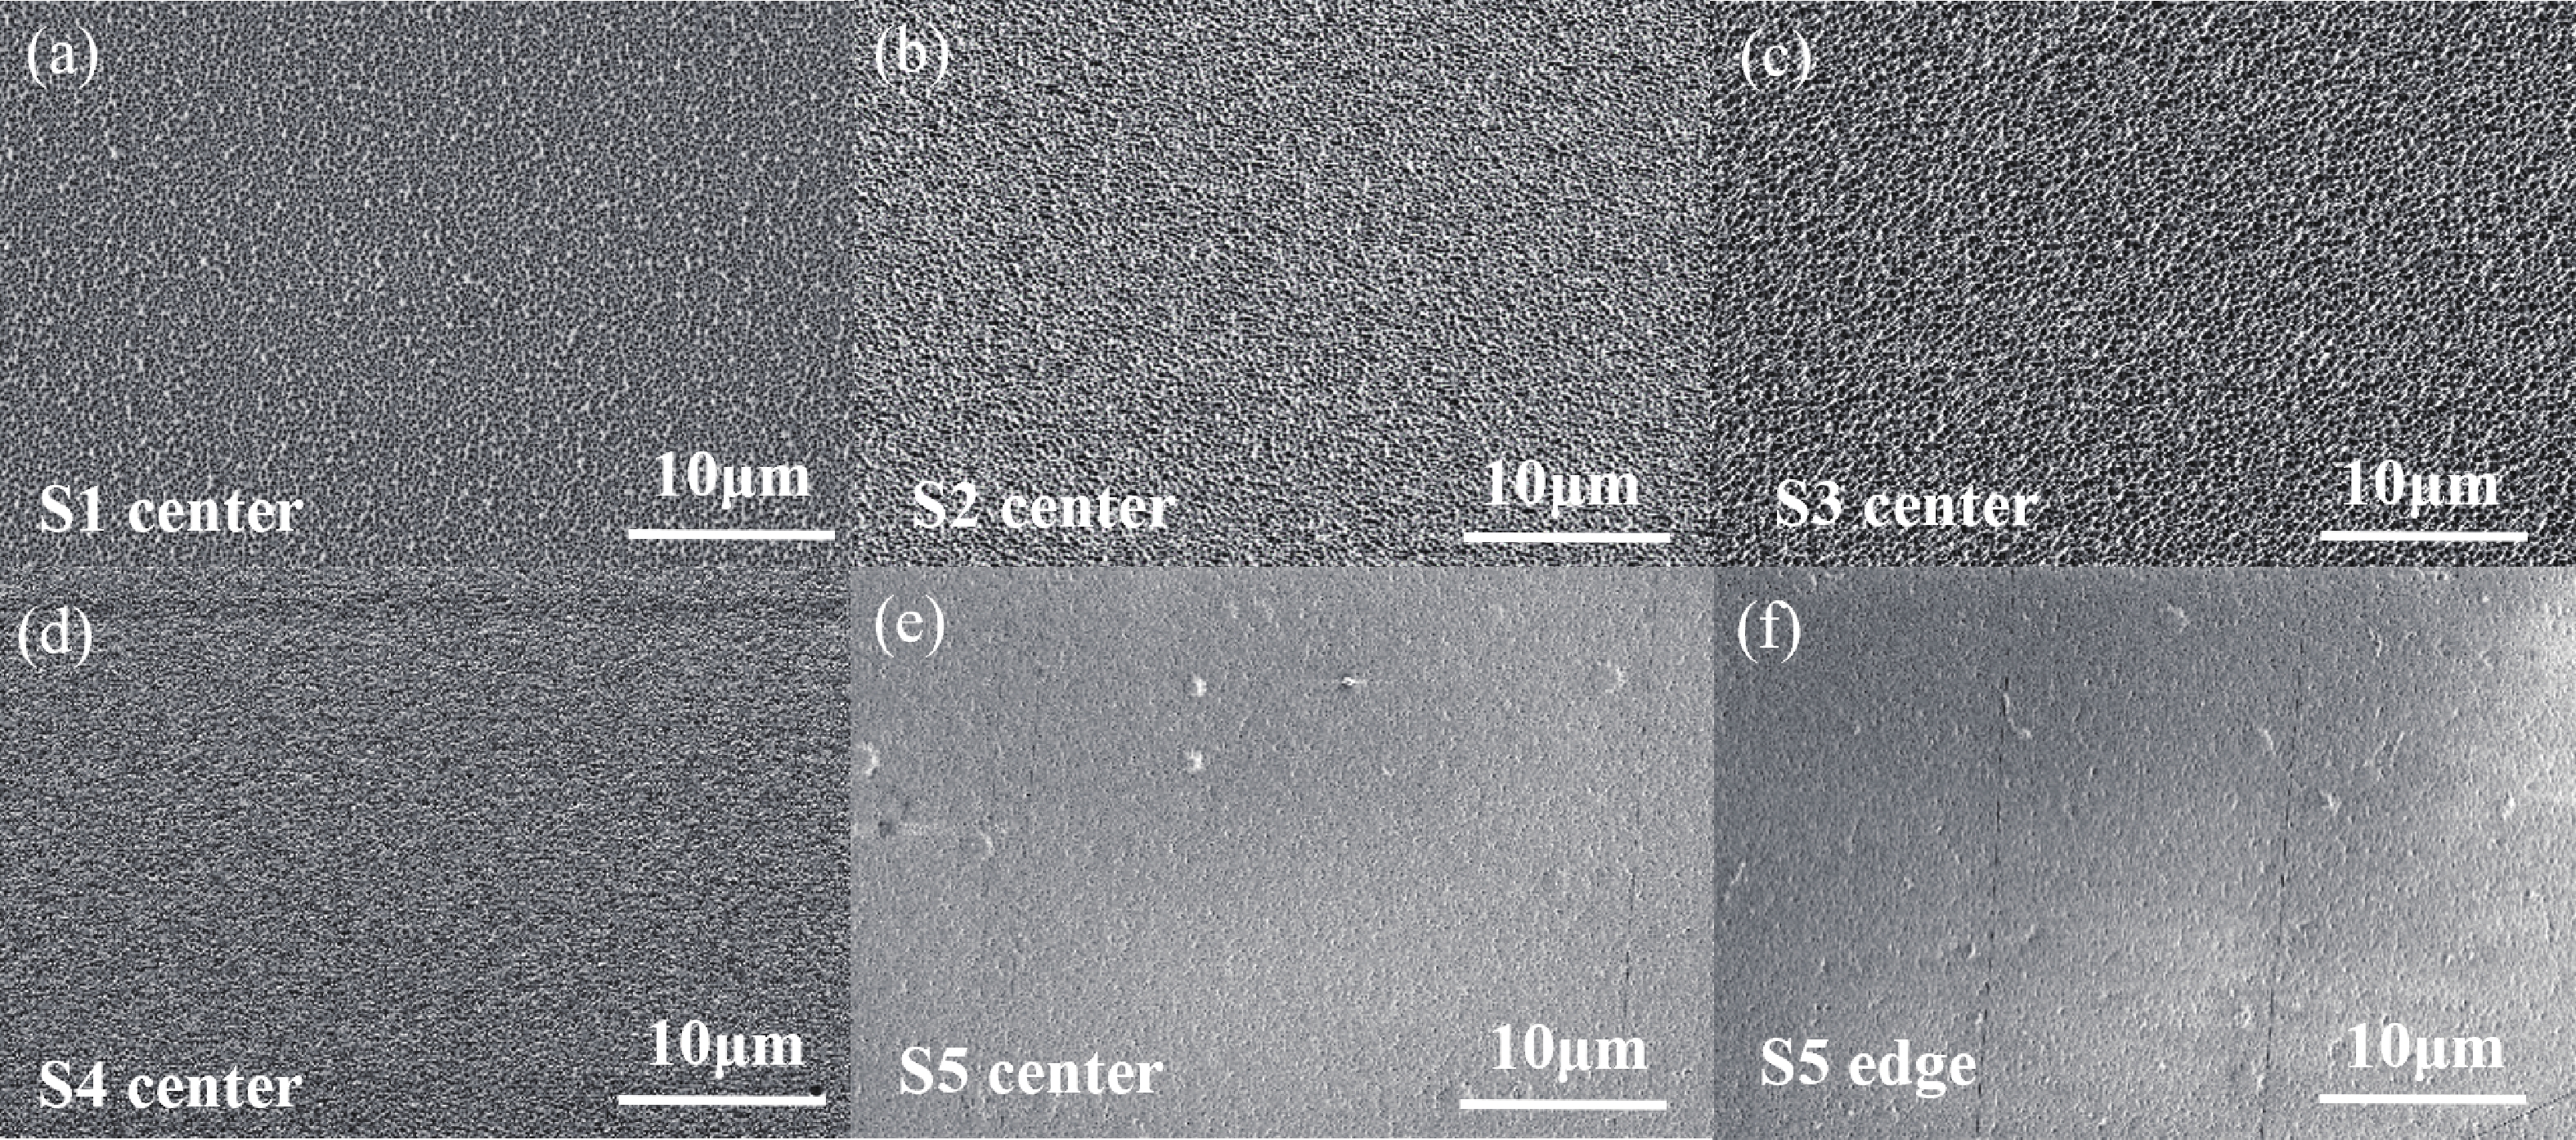
Figure Fig. 3. (a)−(f) SEM images of Ga-assisted AlN films grown with different Ga flow rates.
-
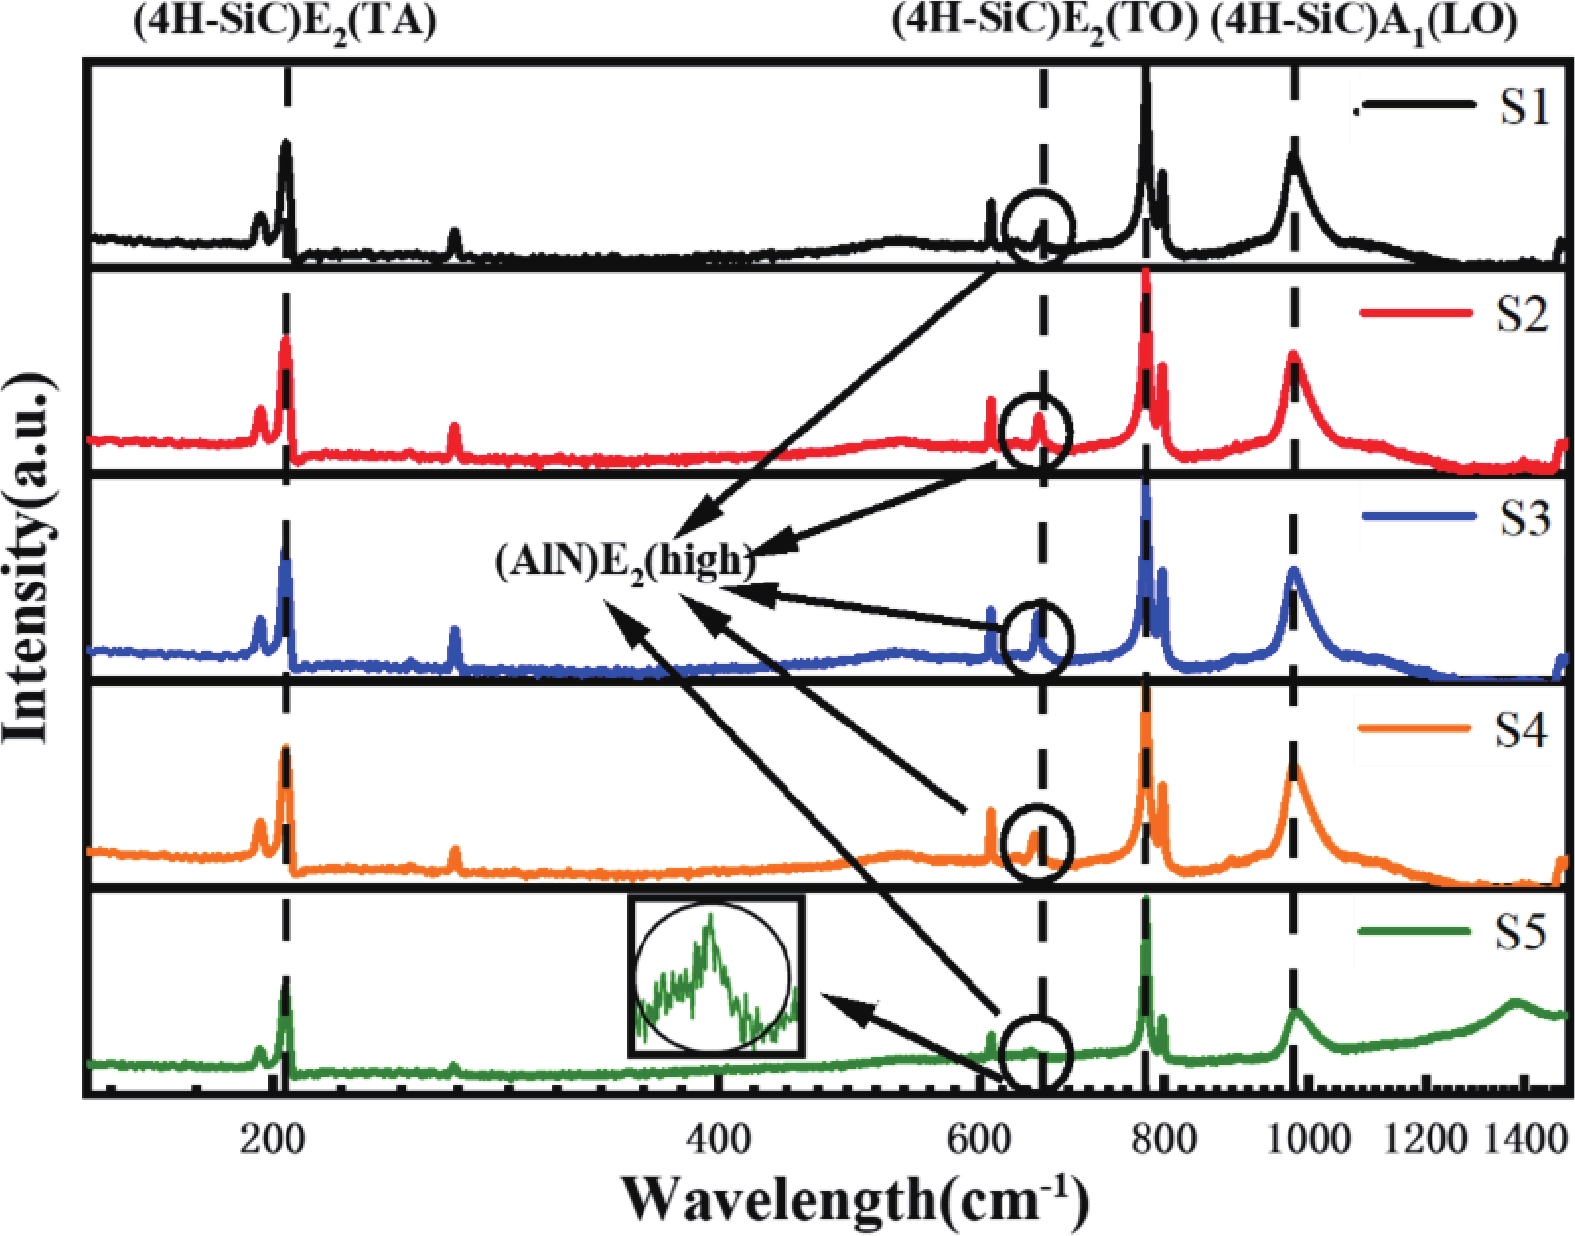
Figure Fig. 4. (Color online) The results of the Raman spectroscopy measurement.
-
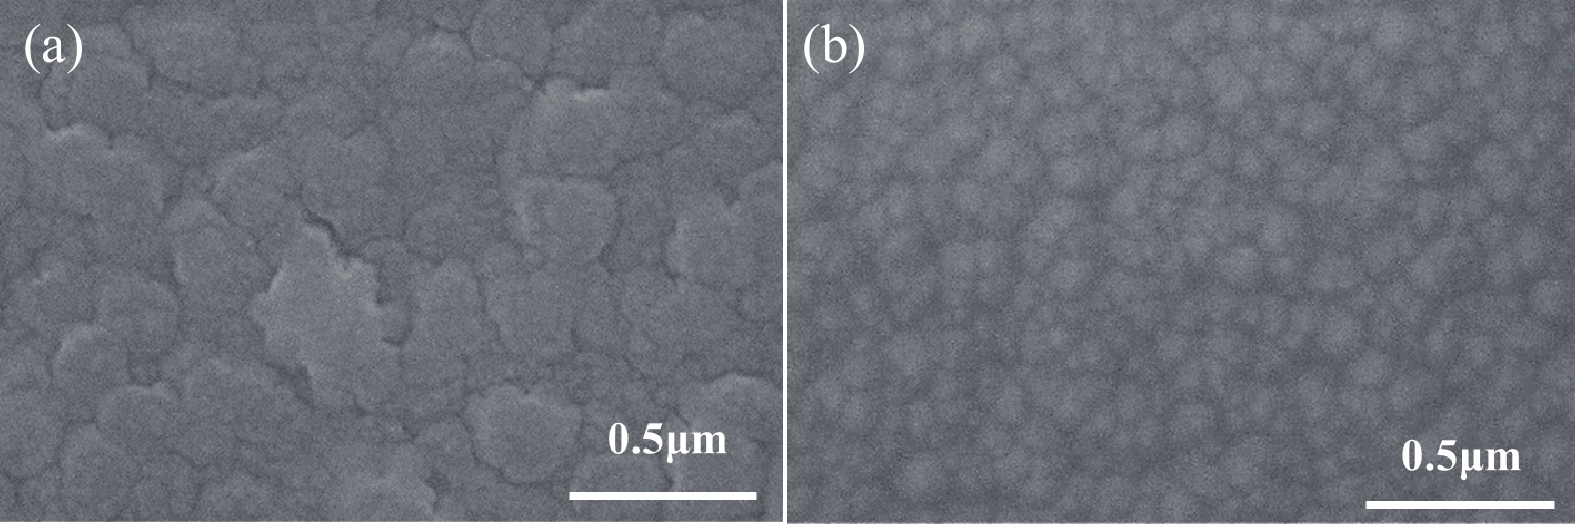
Figure Fig. 5. SEM images of AlN nucleation morphology (a) without TMGa and (b) with 80% TMGa.
-
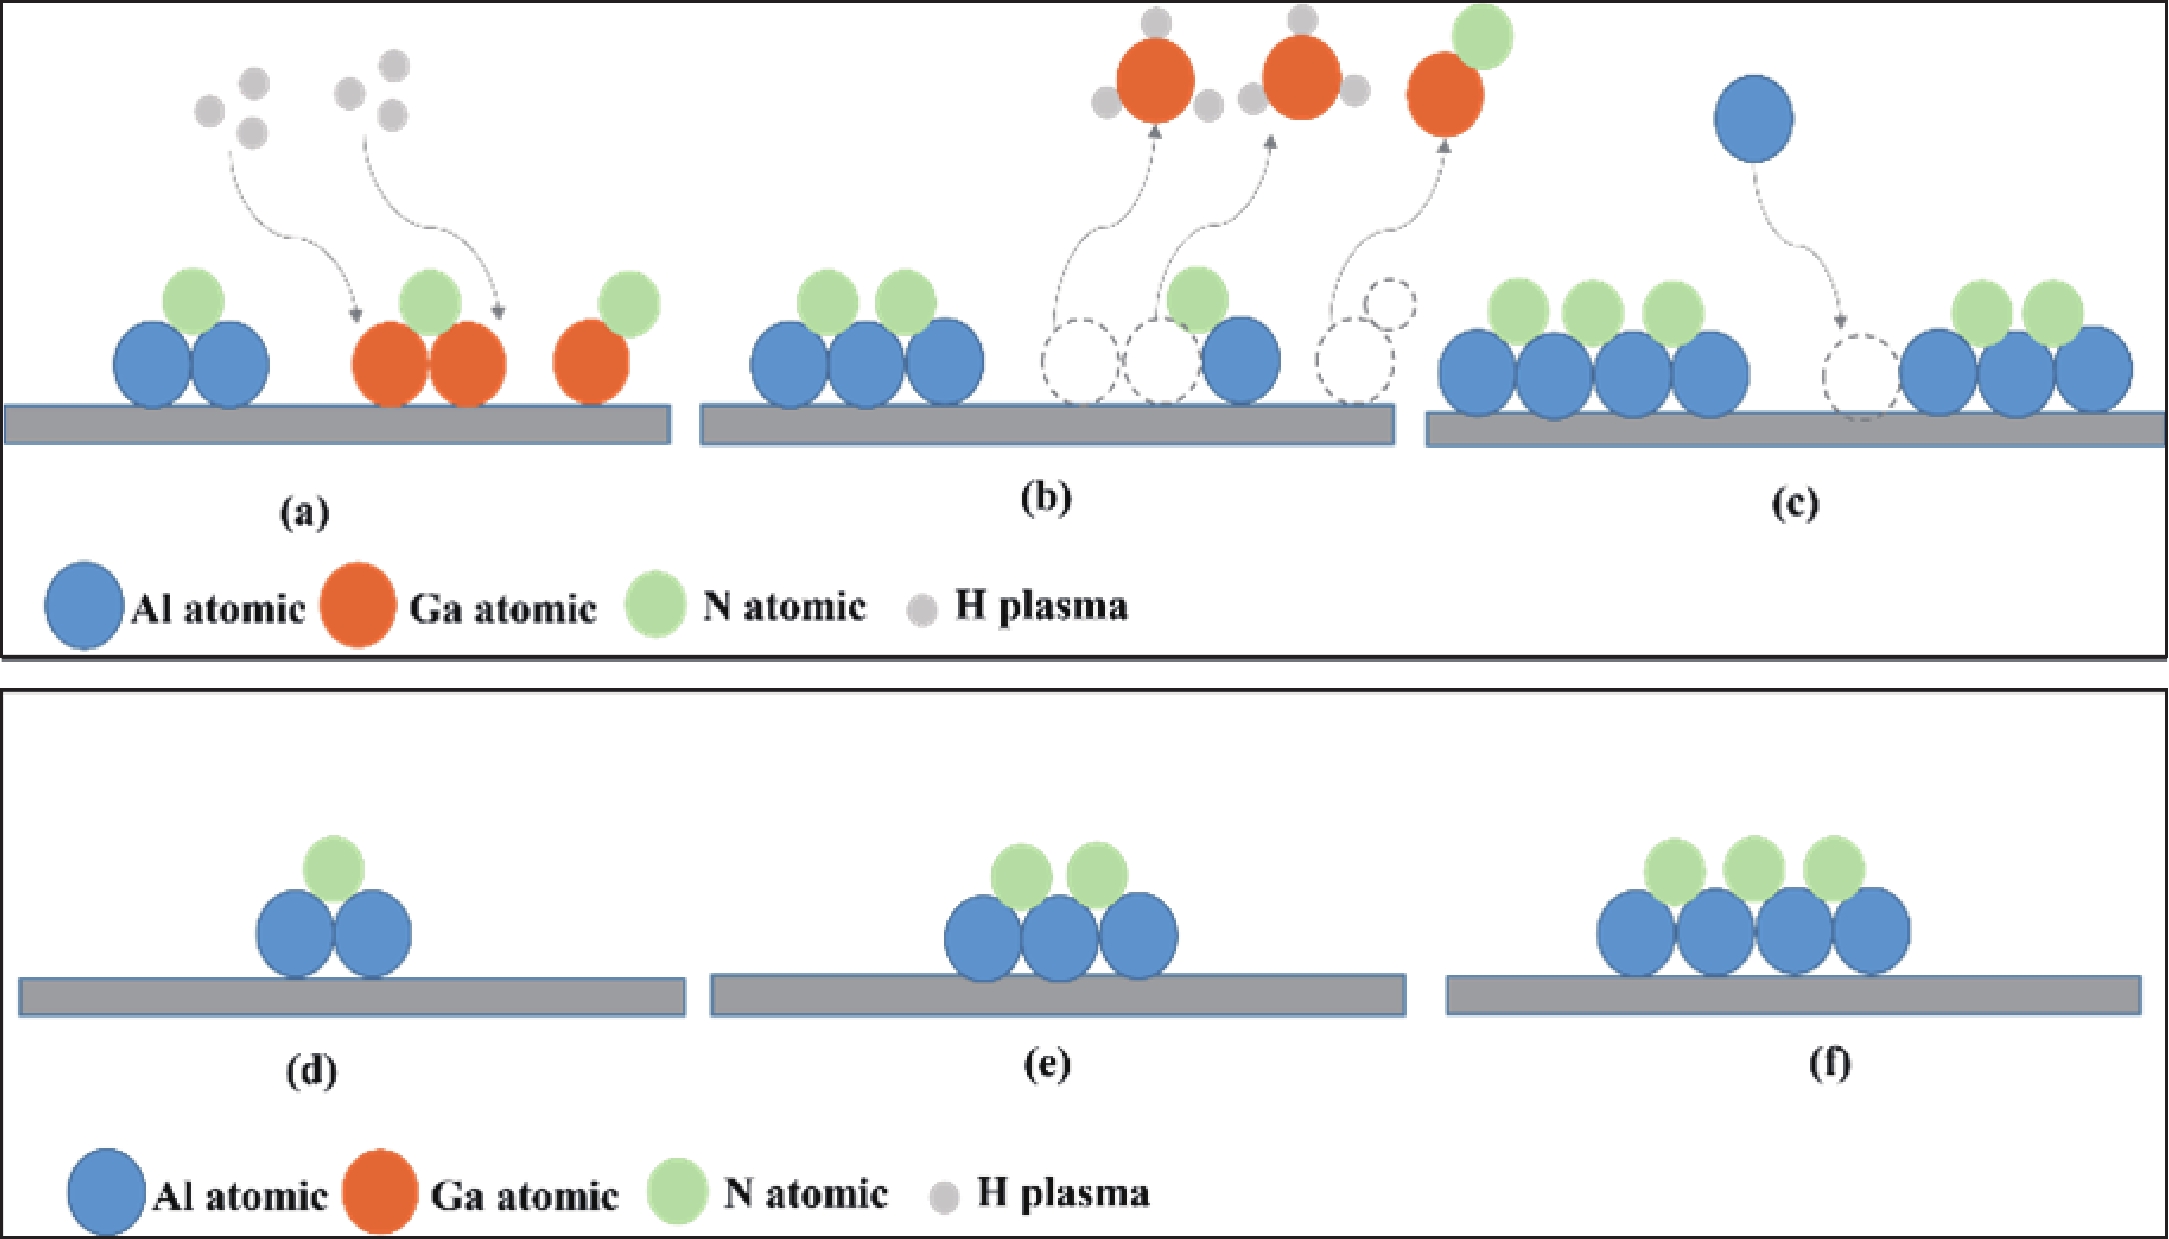
Figure Fig. 6. (Color online) (a−c) Schematic diagram of Ga-assisted AlN growth, (d−f) W/O Ga-assisted AlN growth.
-
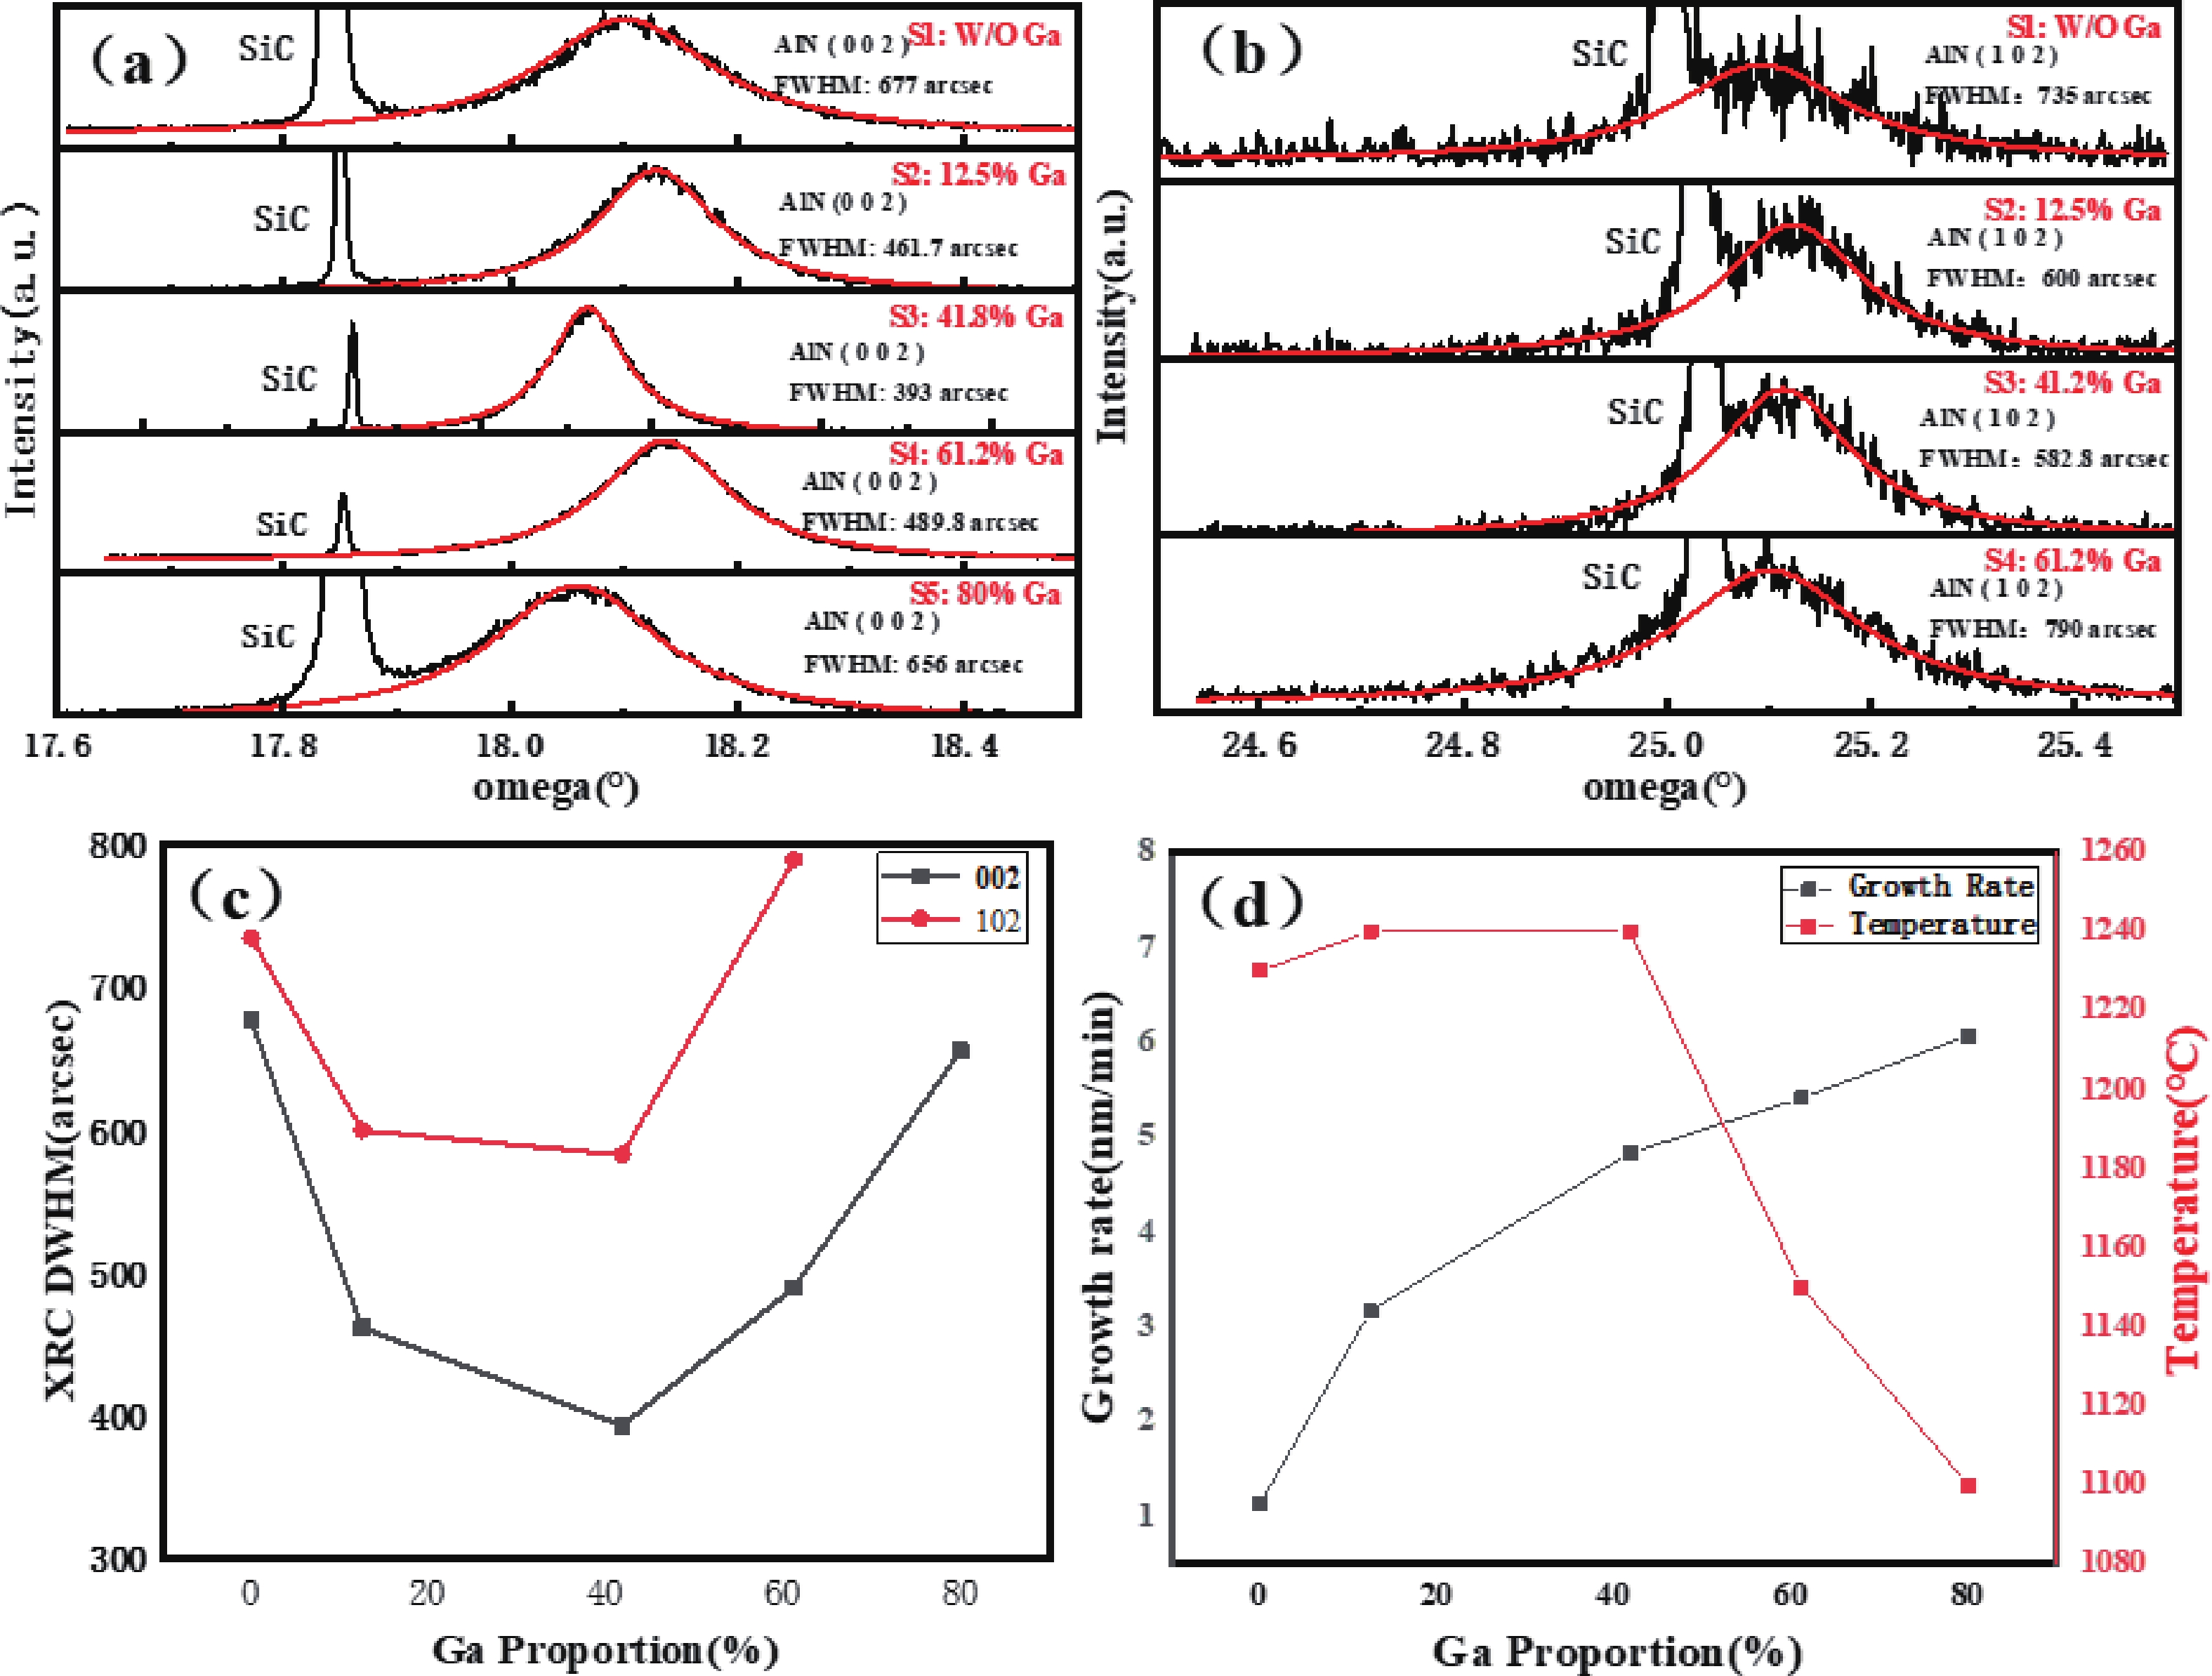
Figure Fig. 7. (Color online) (a, b) X-ray rocking curves of AlN (002) and (102) planes of samples S1−S5, (c) the variation curves of the full width at FWHM of AlN (002) and (102) planes of samples S1−S5, (d) AlN growth rate and growth temperature as function of Ga proportion.
-
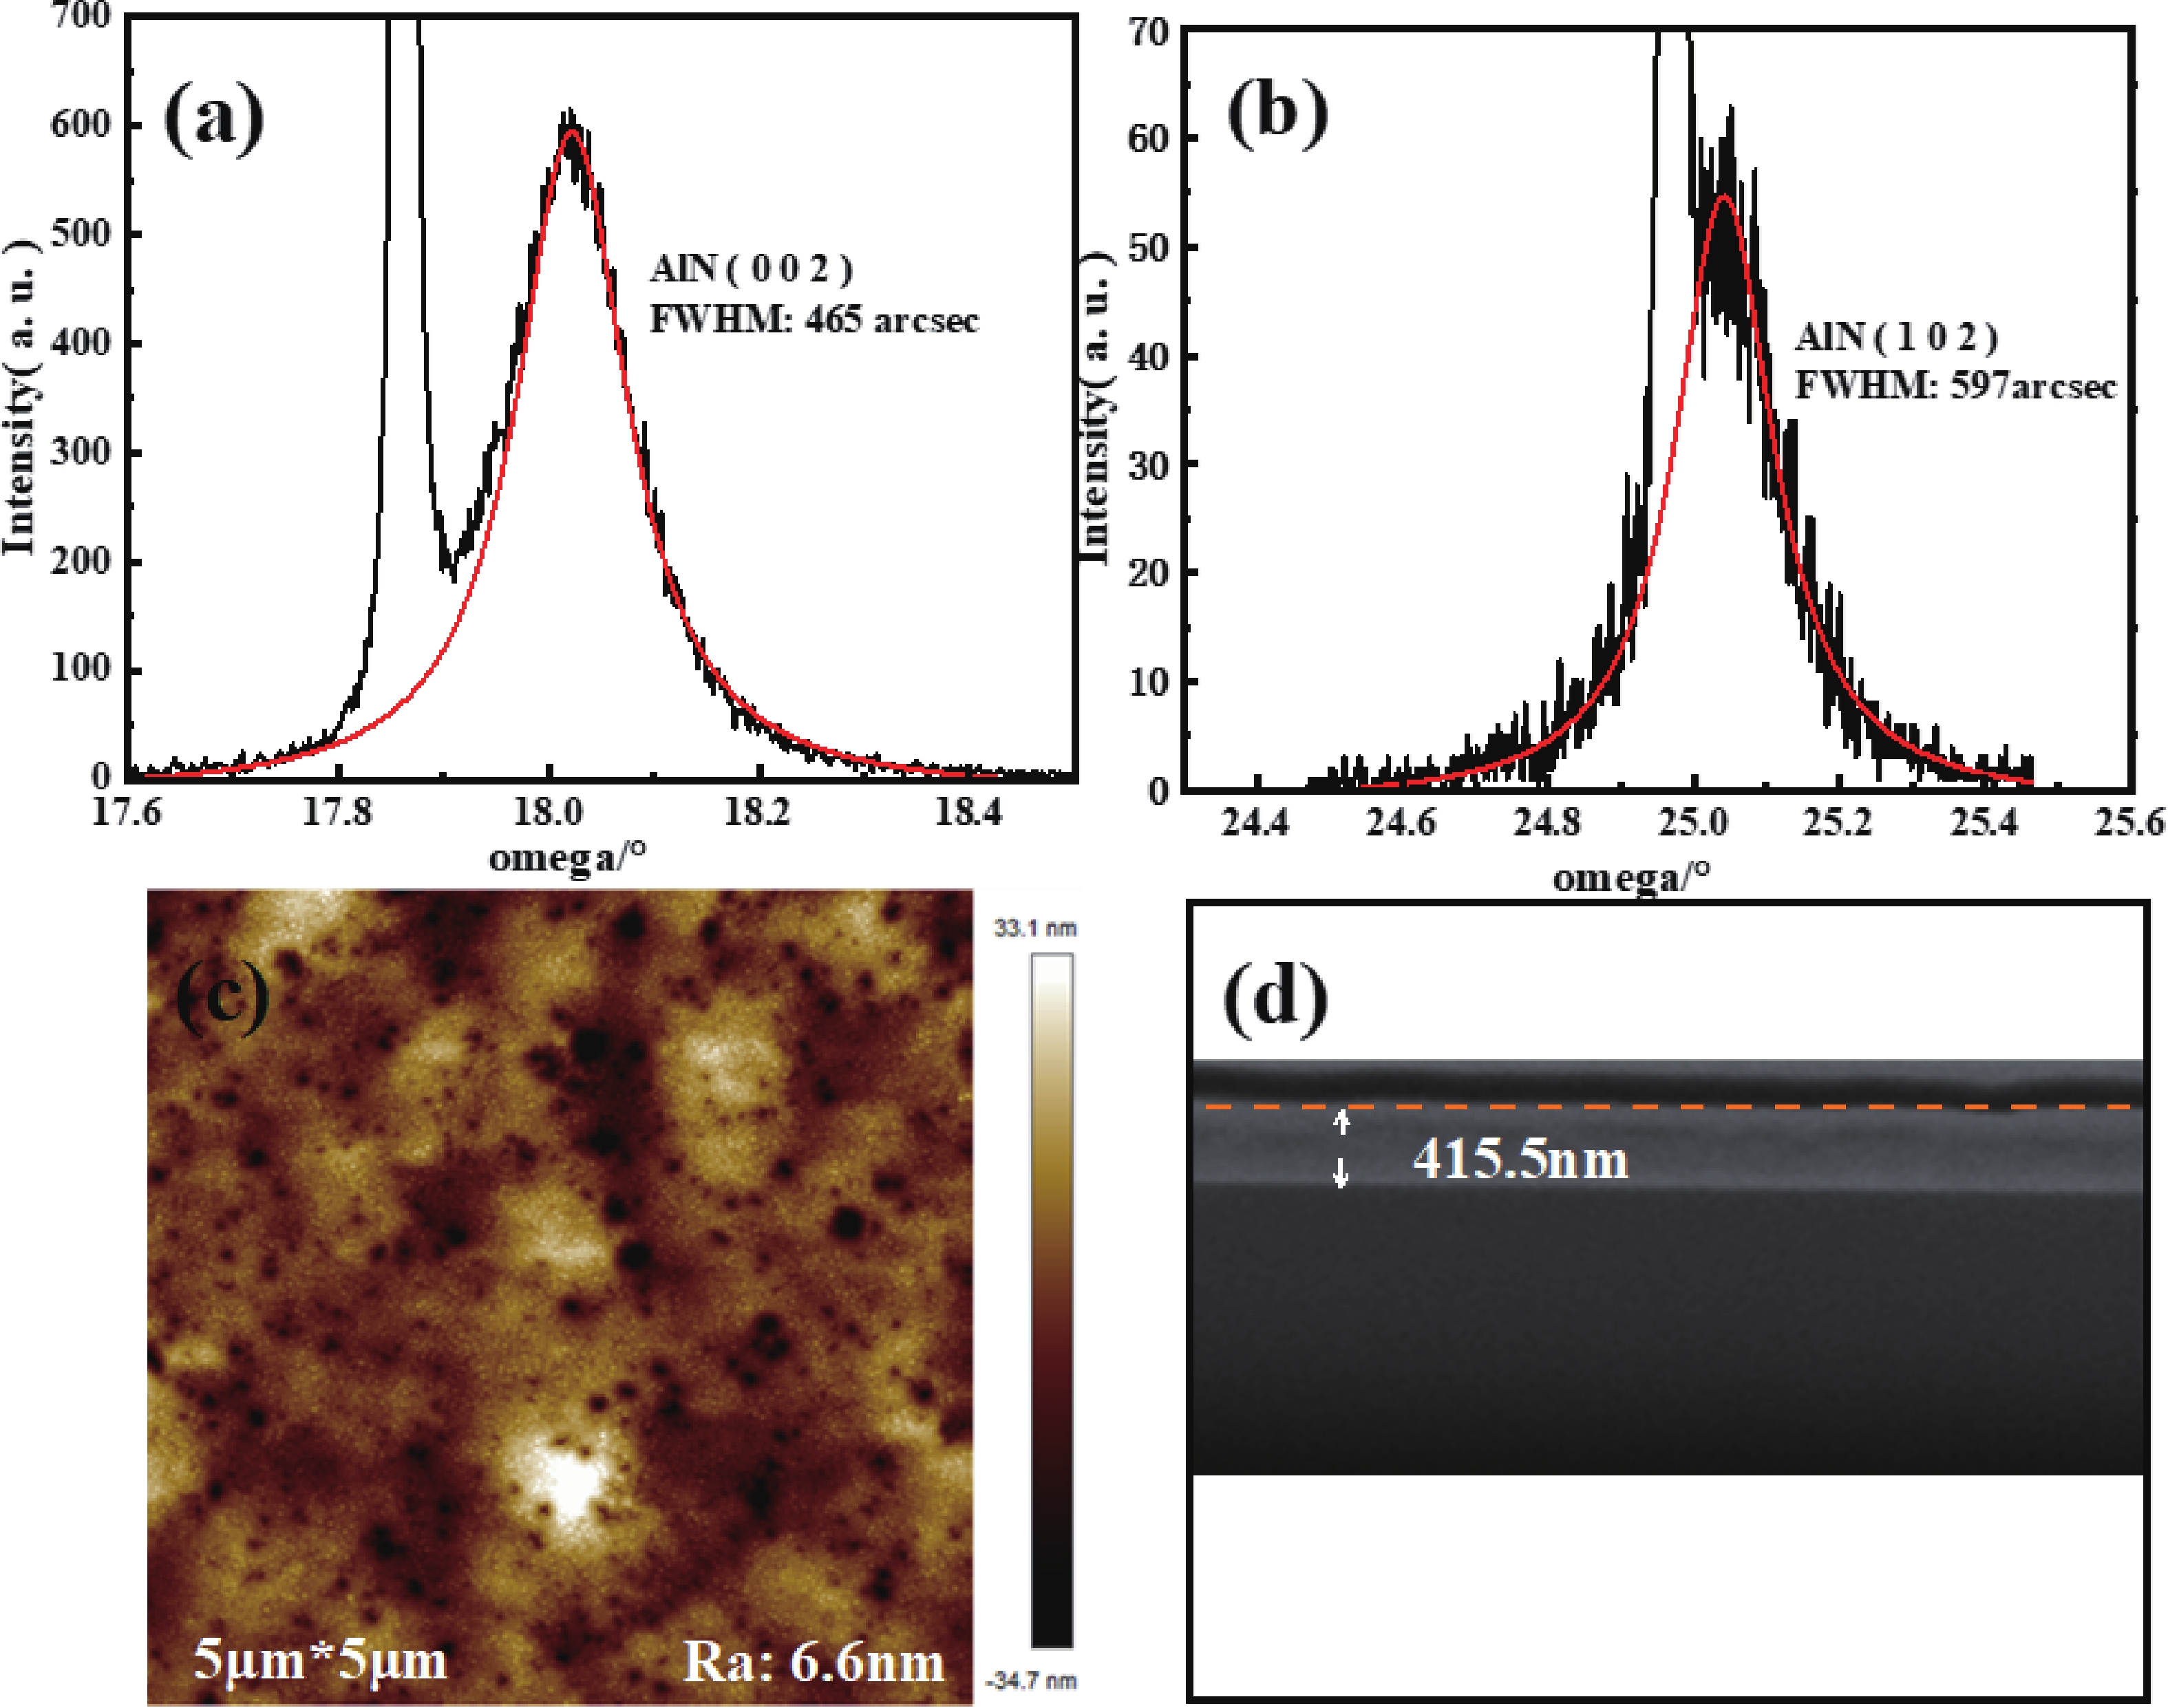
Figure Fig. 8. (Color online) FWHM values of AlN (002) (a) and (102) (b) planes, surface morphology (c) and growth thickness (d) of Sample S6.
Figure
8 ,Table
1 个