-
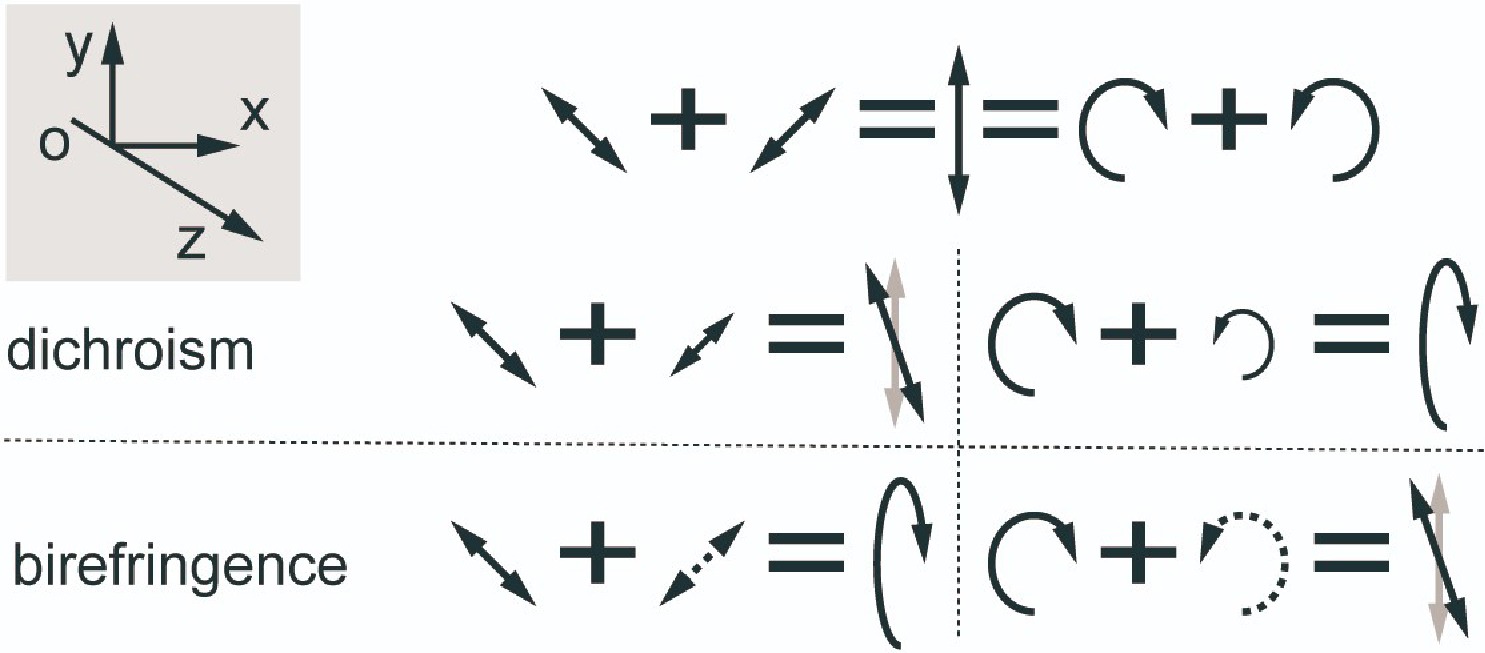
Figure 1. Linearly polarized light incident, and transmitted light affected by linear birefringence and dichroism (left) and circular dichroism and birefringence (right). Illustration showing the direction of light propagation and the direction of the electric vector.
-
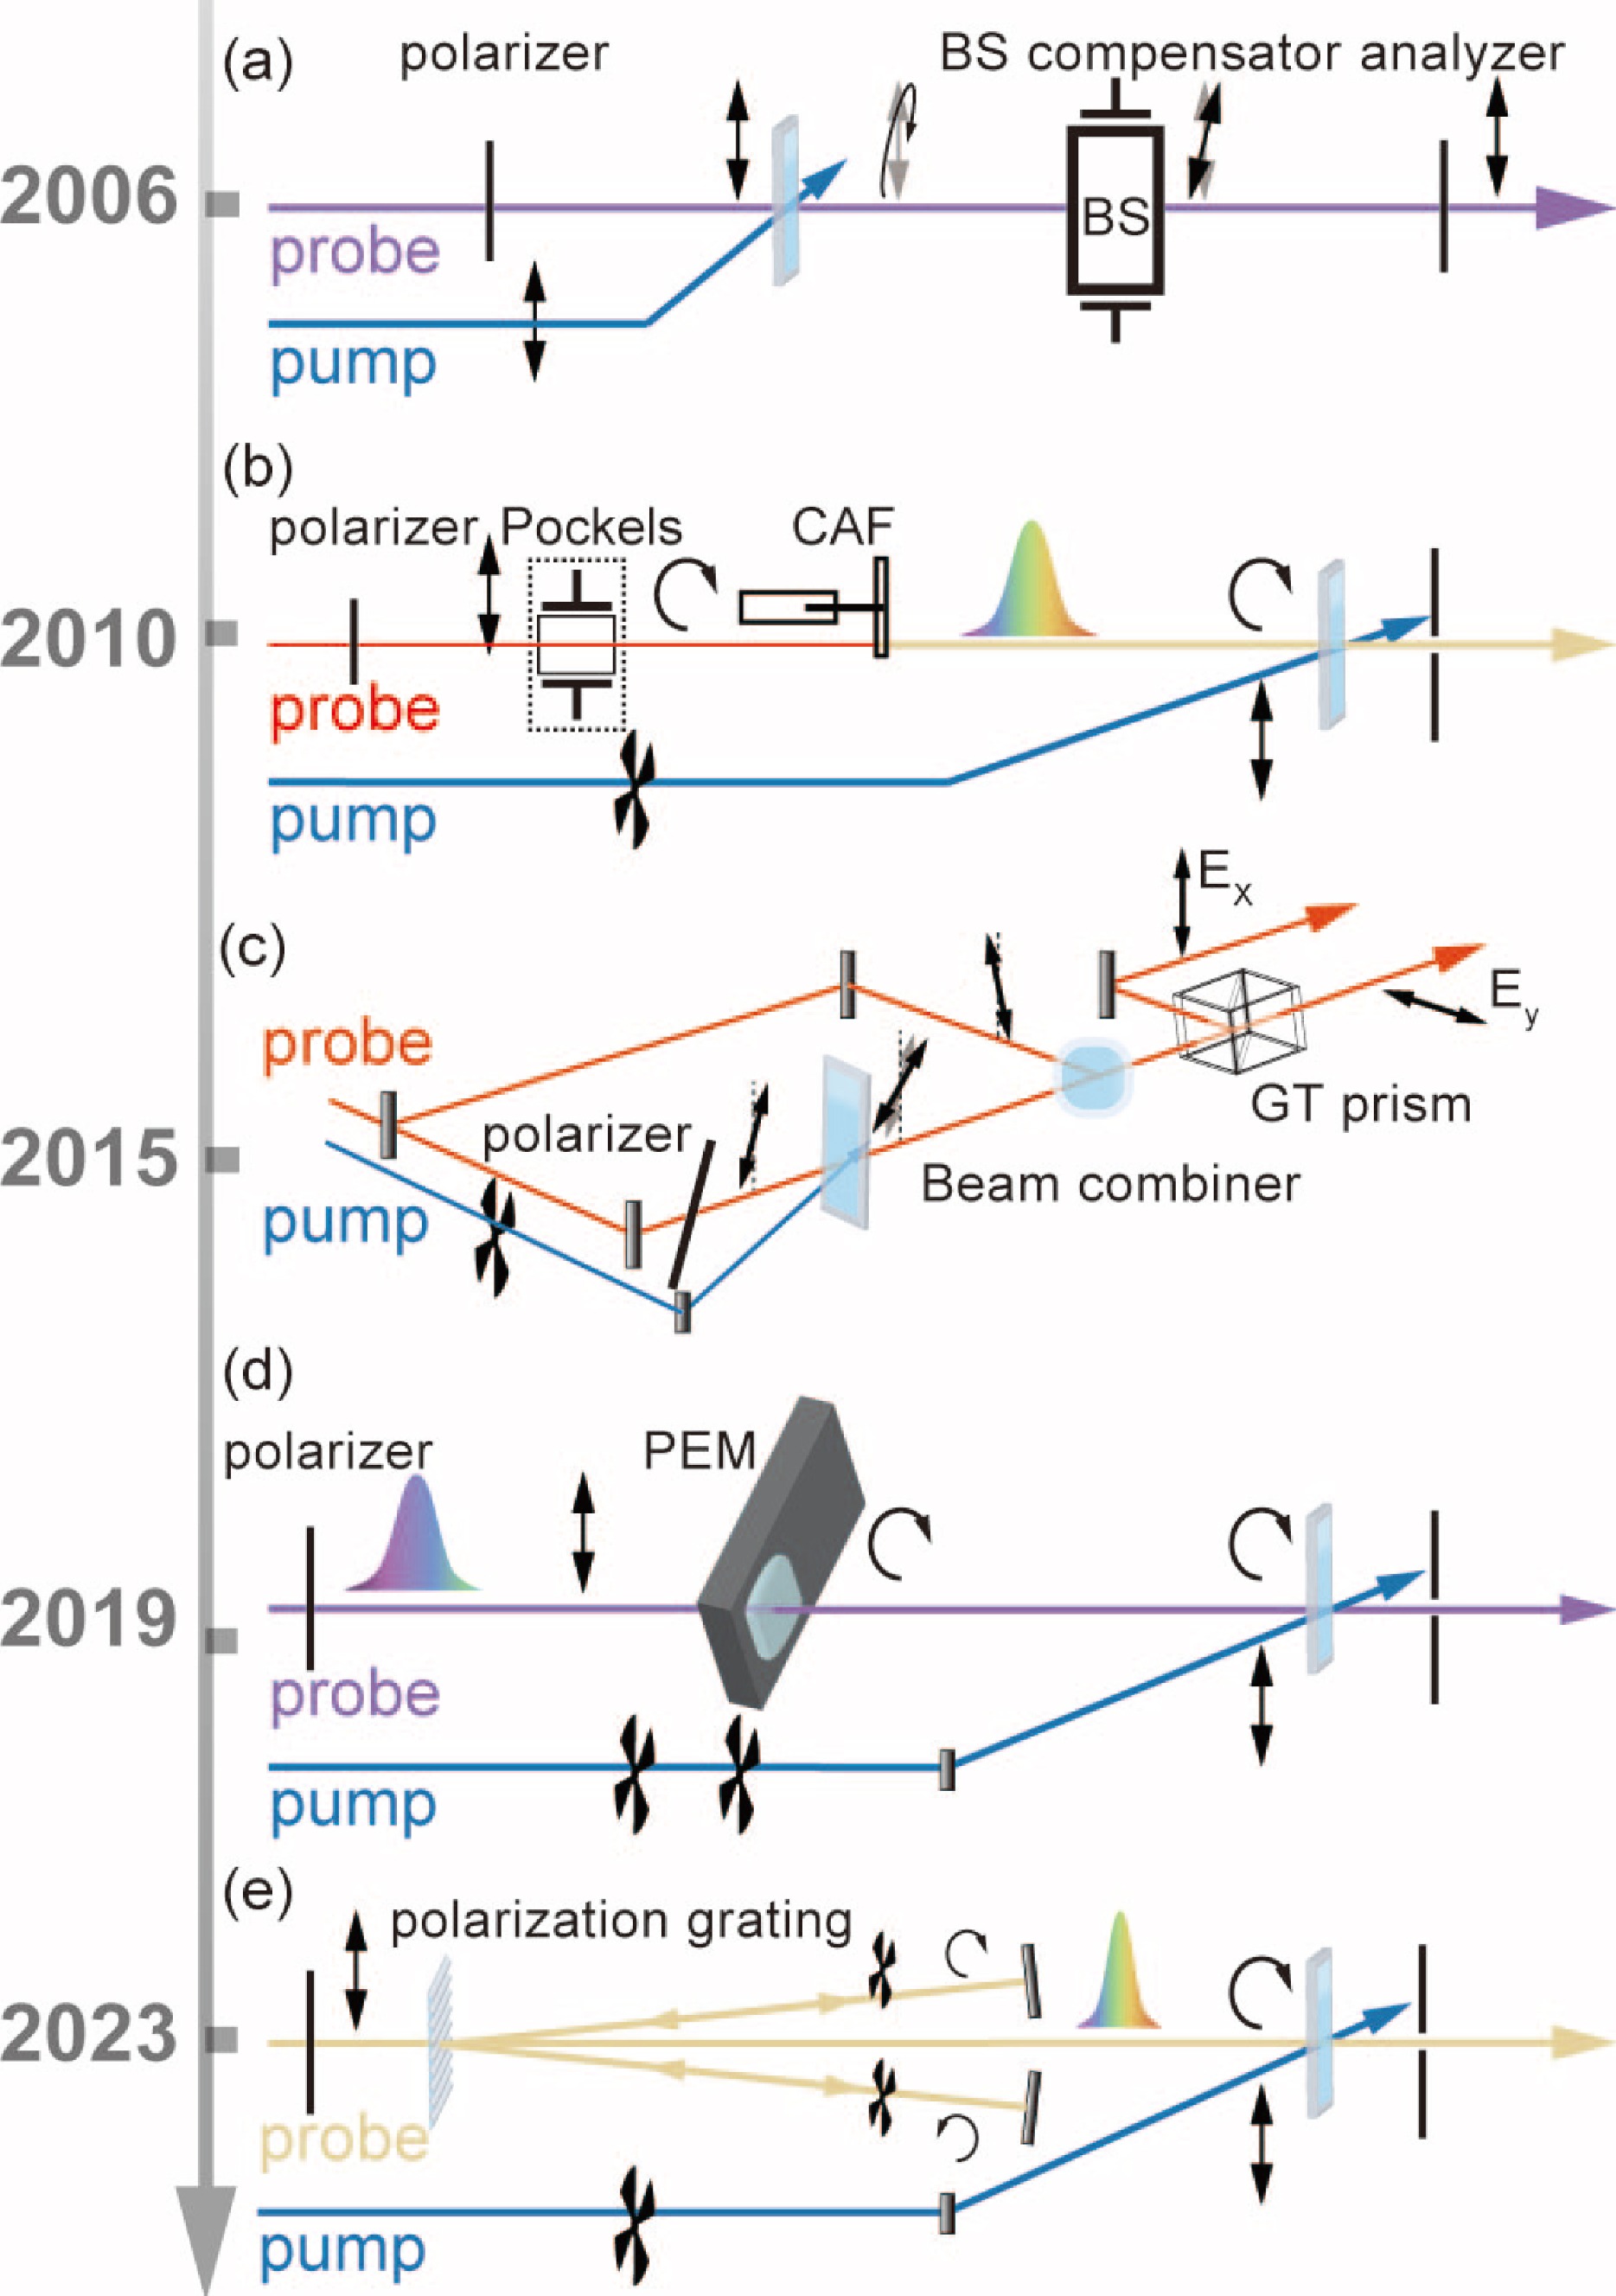
Figure 2. Schematic diagram of the TRCD development optical paths. (a) The optical path setup for the elliptic rate detection method, reproduced from Ref.[26]. (b) The optical path setup for the circular dichroism detection using the Pockels cell, reproduced from Ref.[29]. (c) The detection optical path for elliptic rate outlier amplification, reproduced from Ref.[27]. (d) The schematic of the optical path for UV broadband circular dichroism spectral detection using PEM, reproduced from Ref.[30]. (e) The implementation of differential absorption TRCD detection via polarization grating, reproduced from Ref.[22].
-
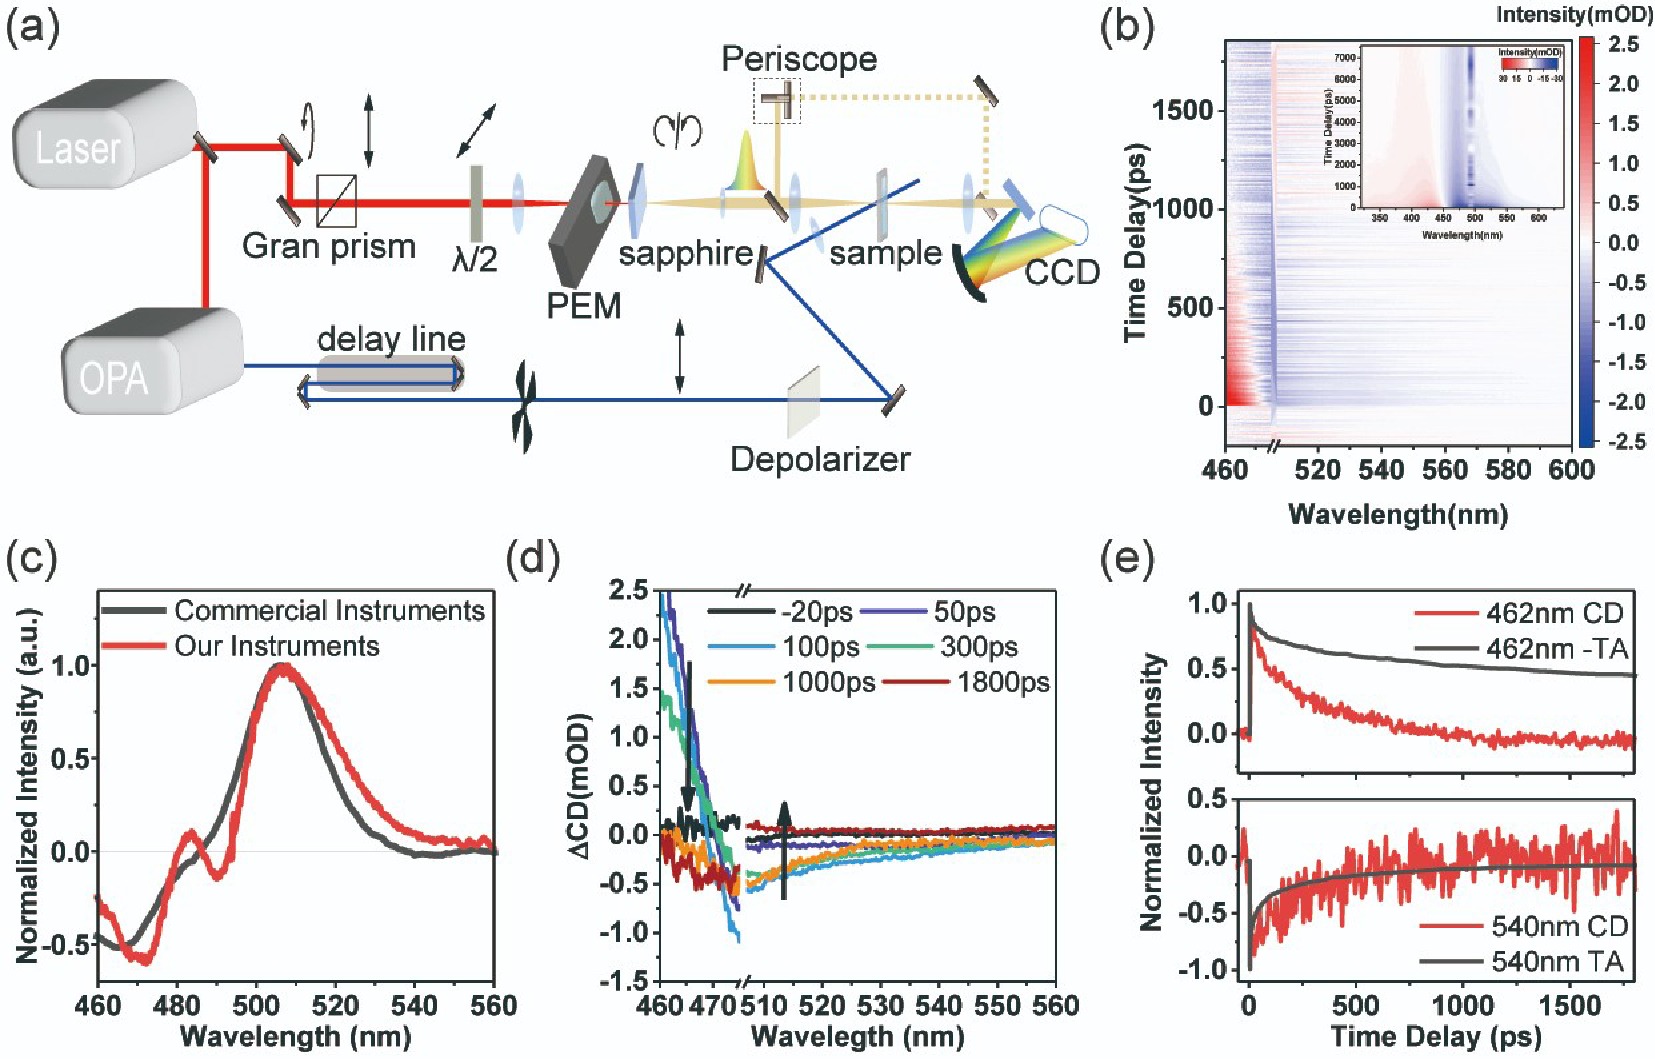
Figure 3. Optical path diagram for TRCD spectroscopy and circular dichroism data for acridine orange (AO) intercalated DNA samples. (a) Optical path design for a home-built TRCD spectroscopy. (b) Time-resolved circular dichroism spectrogram, inset shows transient absorption spectra of AO-DNA molecules excited using the same wavelength.(c) Steady-state circular dichroism spectral data of acridine orange intercalated DNA samples performed as a visible-band chiral sample. (d) TRCD spectral data excited with 495 nm depolarized light. (e) TRCD spectral data and transient absorption data normalized to kinetics associated with the basal bleaching band and the excited radiation band. The TRCD signal at 462 nm was inverted for comparison.
-
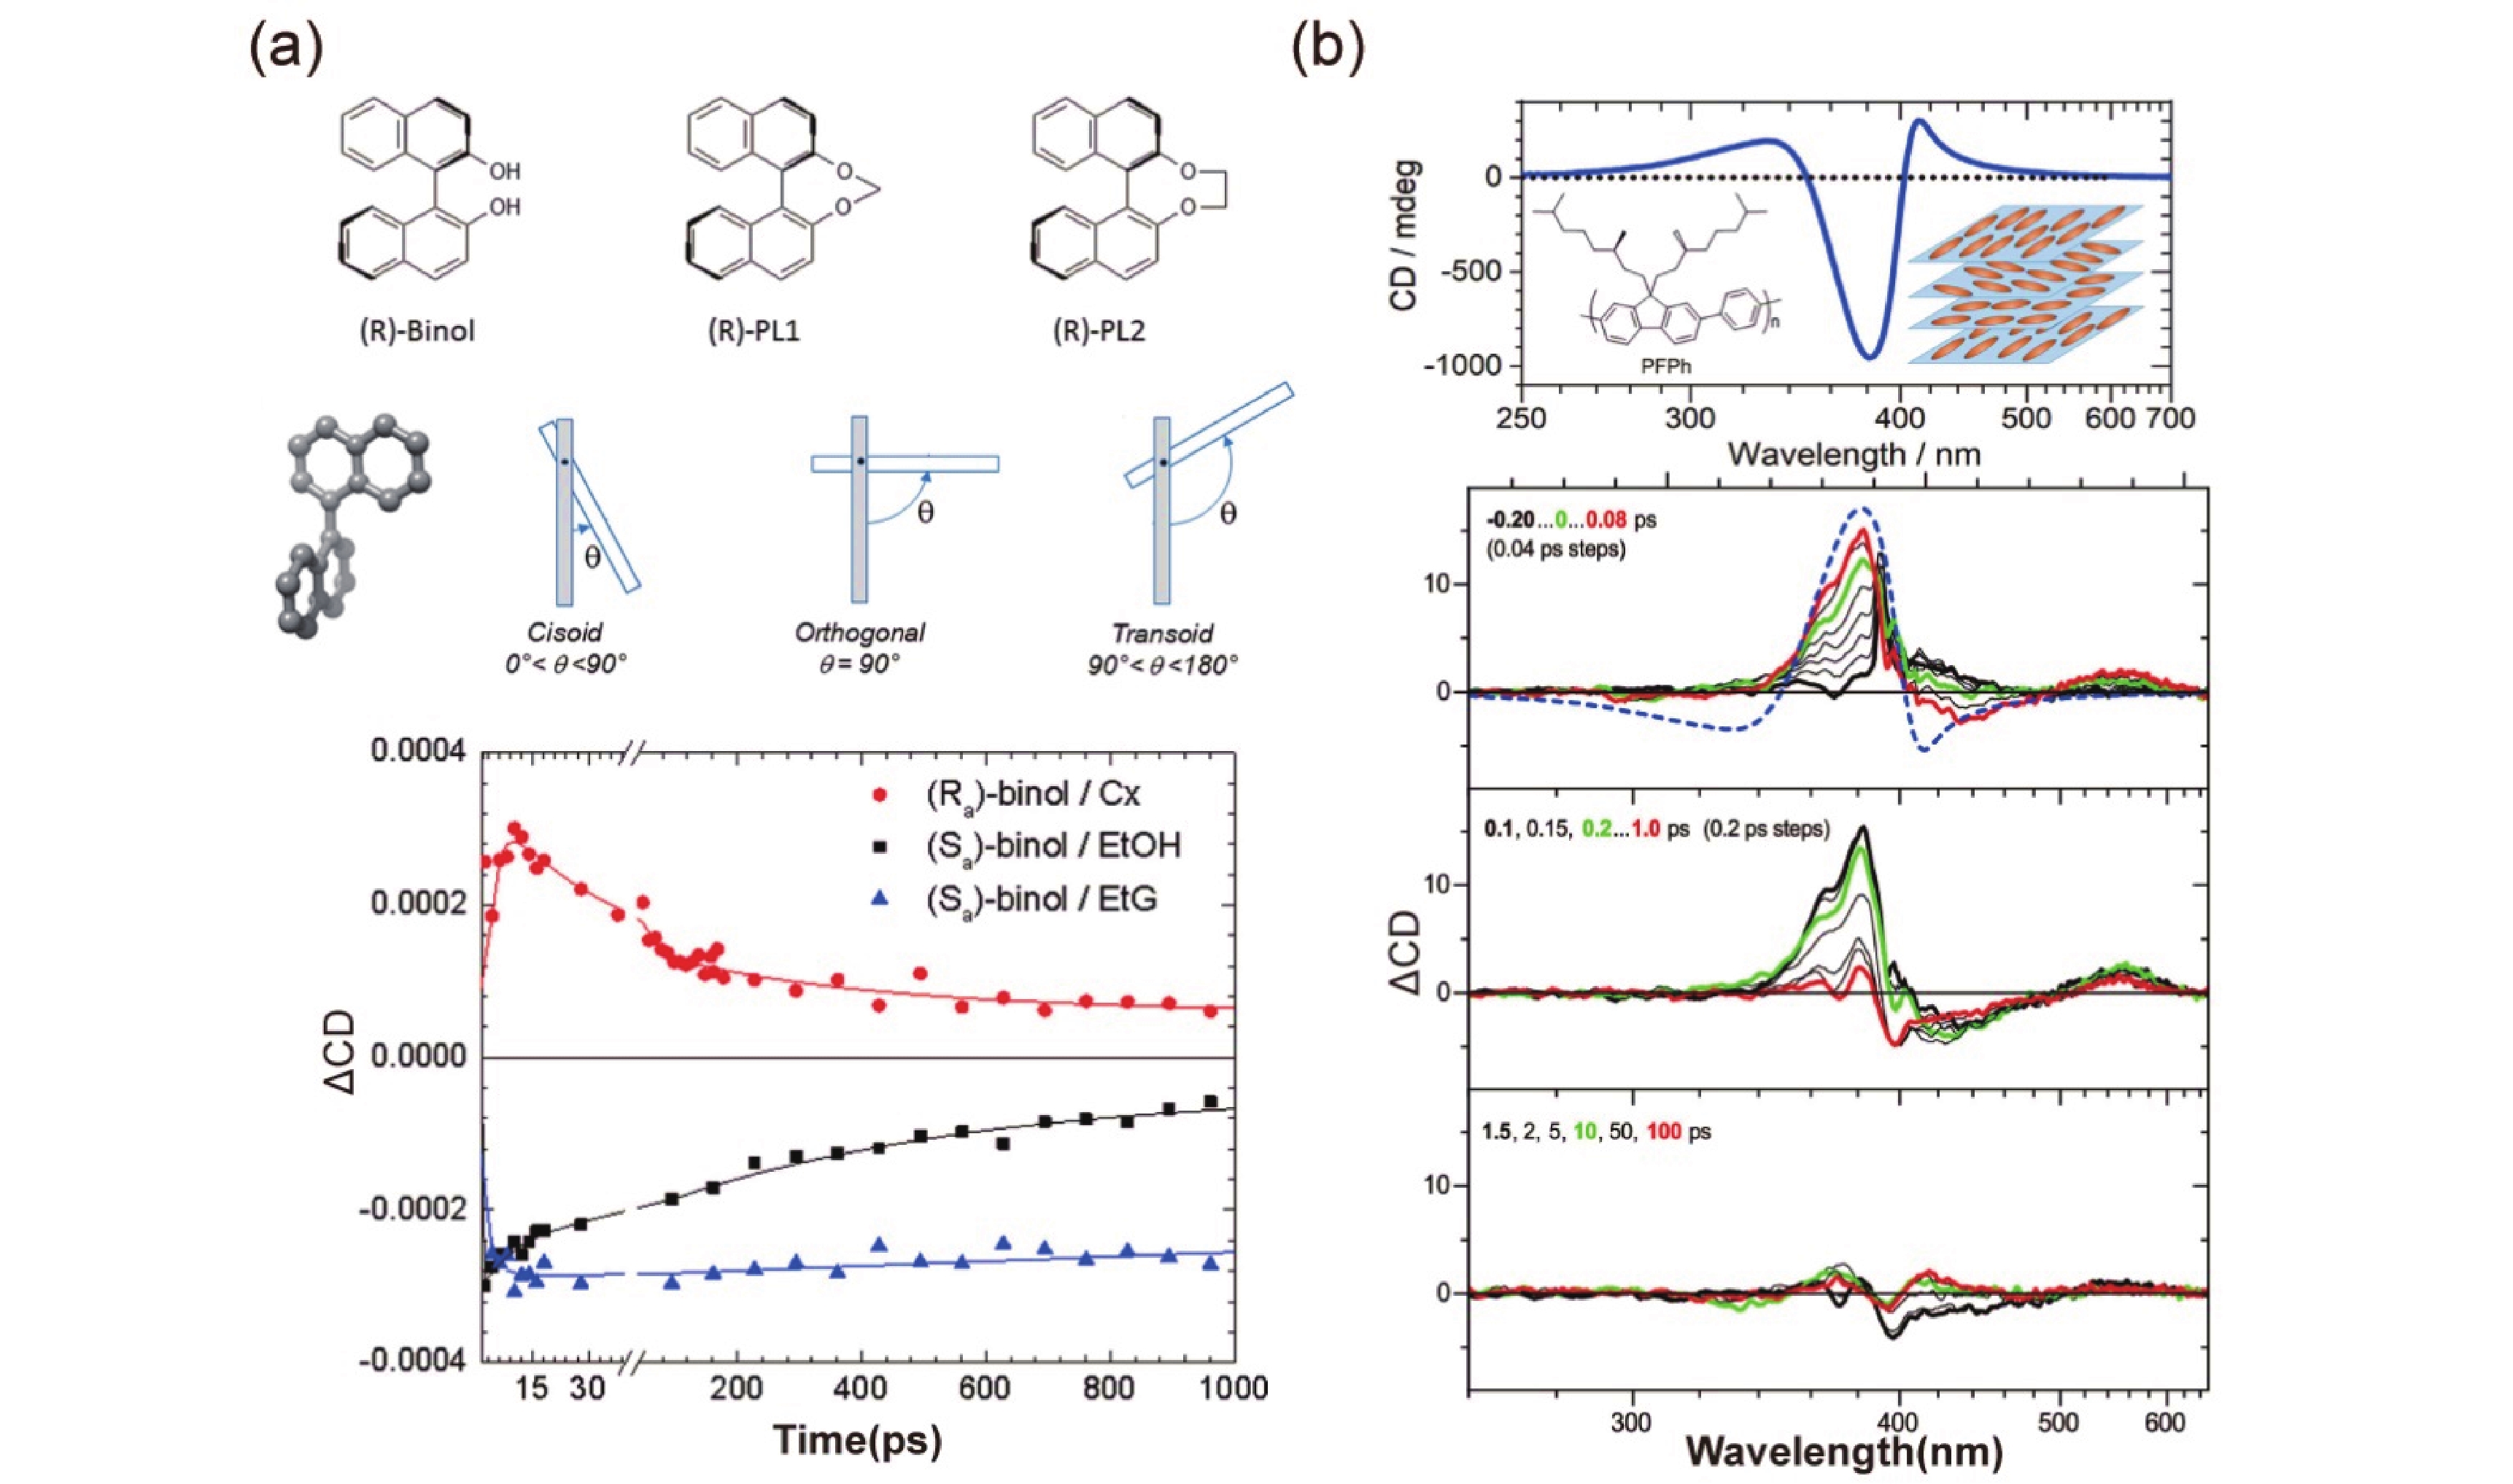
Figure 4. Probing molecular structure with TRCD spectroscopy. (a) TRCD dynamics of axial chiral molecular torsion probed by Schmid et al. Reprinted with permission from Ref.[32], copyright 2019 American Chemical Society. (b) TRCD spectroscopy probing PFPh films and suggested copolymer structural changes by Scholz et al. reprinted with permission from Ref.[33], copyright 2019 American Chemical Society.
-
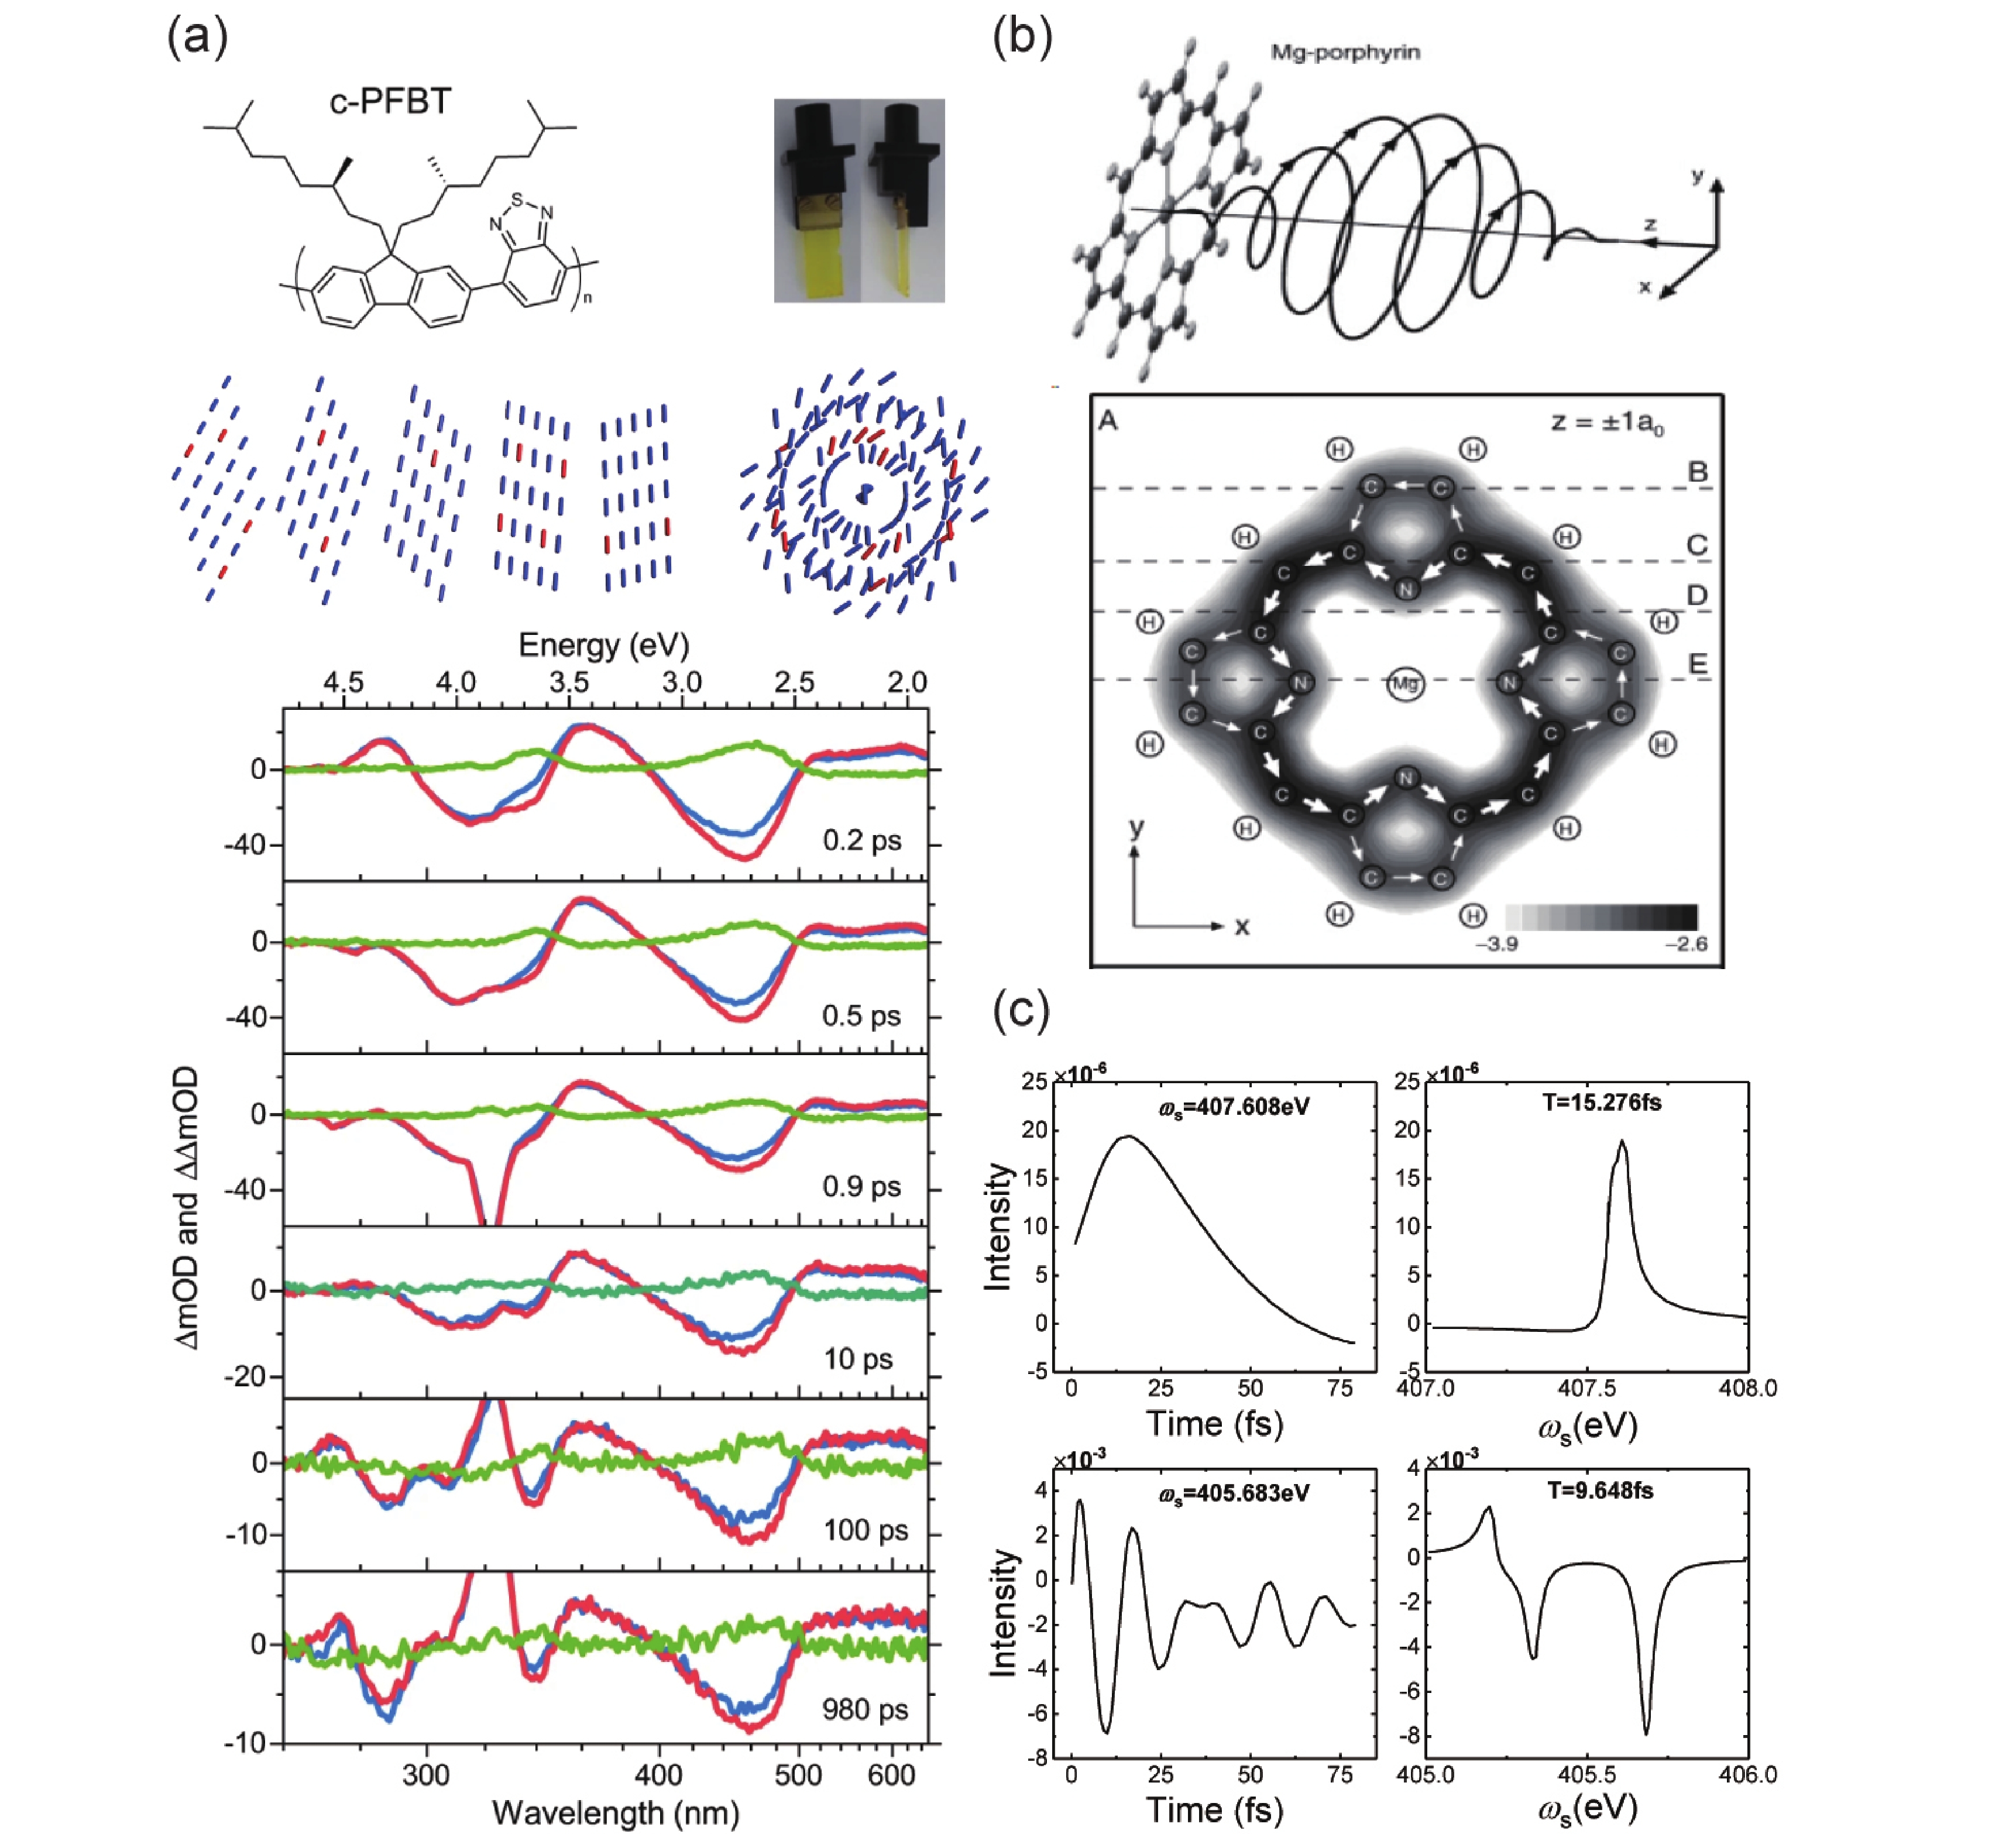
Figure 5. Probing chiral origins with TRCD spectroscopy. (a) Denial of monomolecular chiral origin of copolymer films by analyzing TRCD spectra. Reproduced from Ref.[34], copyright 2022 Nature Publishing Group. (b) Generation of ring current distribution in a porphyrin molecule upon light excitation. Reprinted with permission from Ref.[35], copyright 2006 American Chemical Society. (c) Spectrograms and kinetic curves of complex chiral signals induced by narrowband pumping and broadband pumping, reproduced from Ref.[36].
-
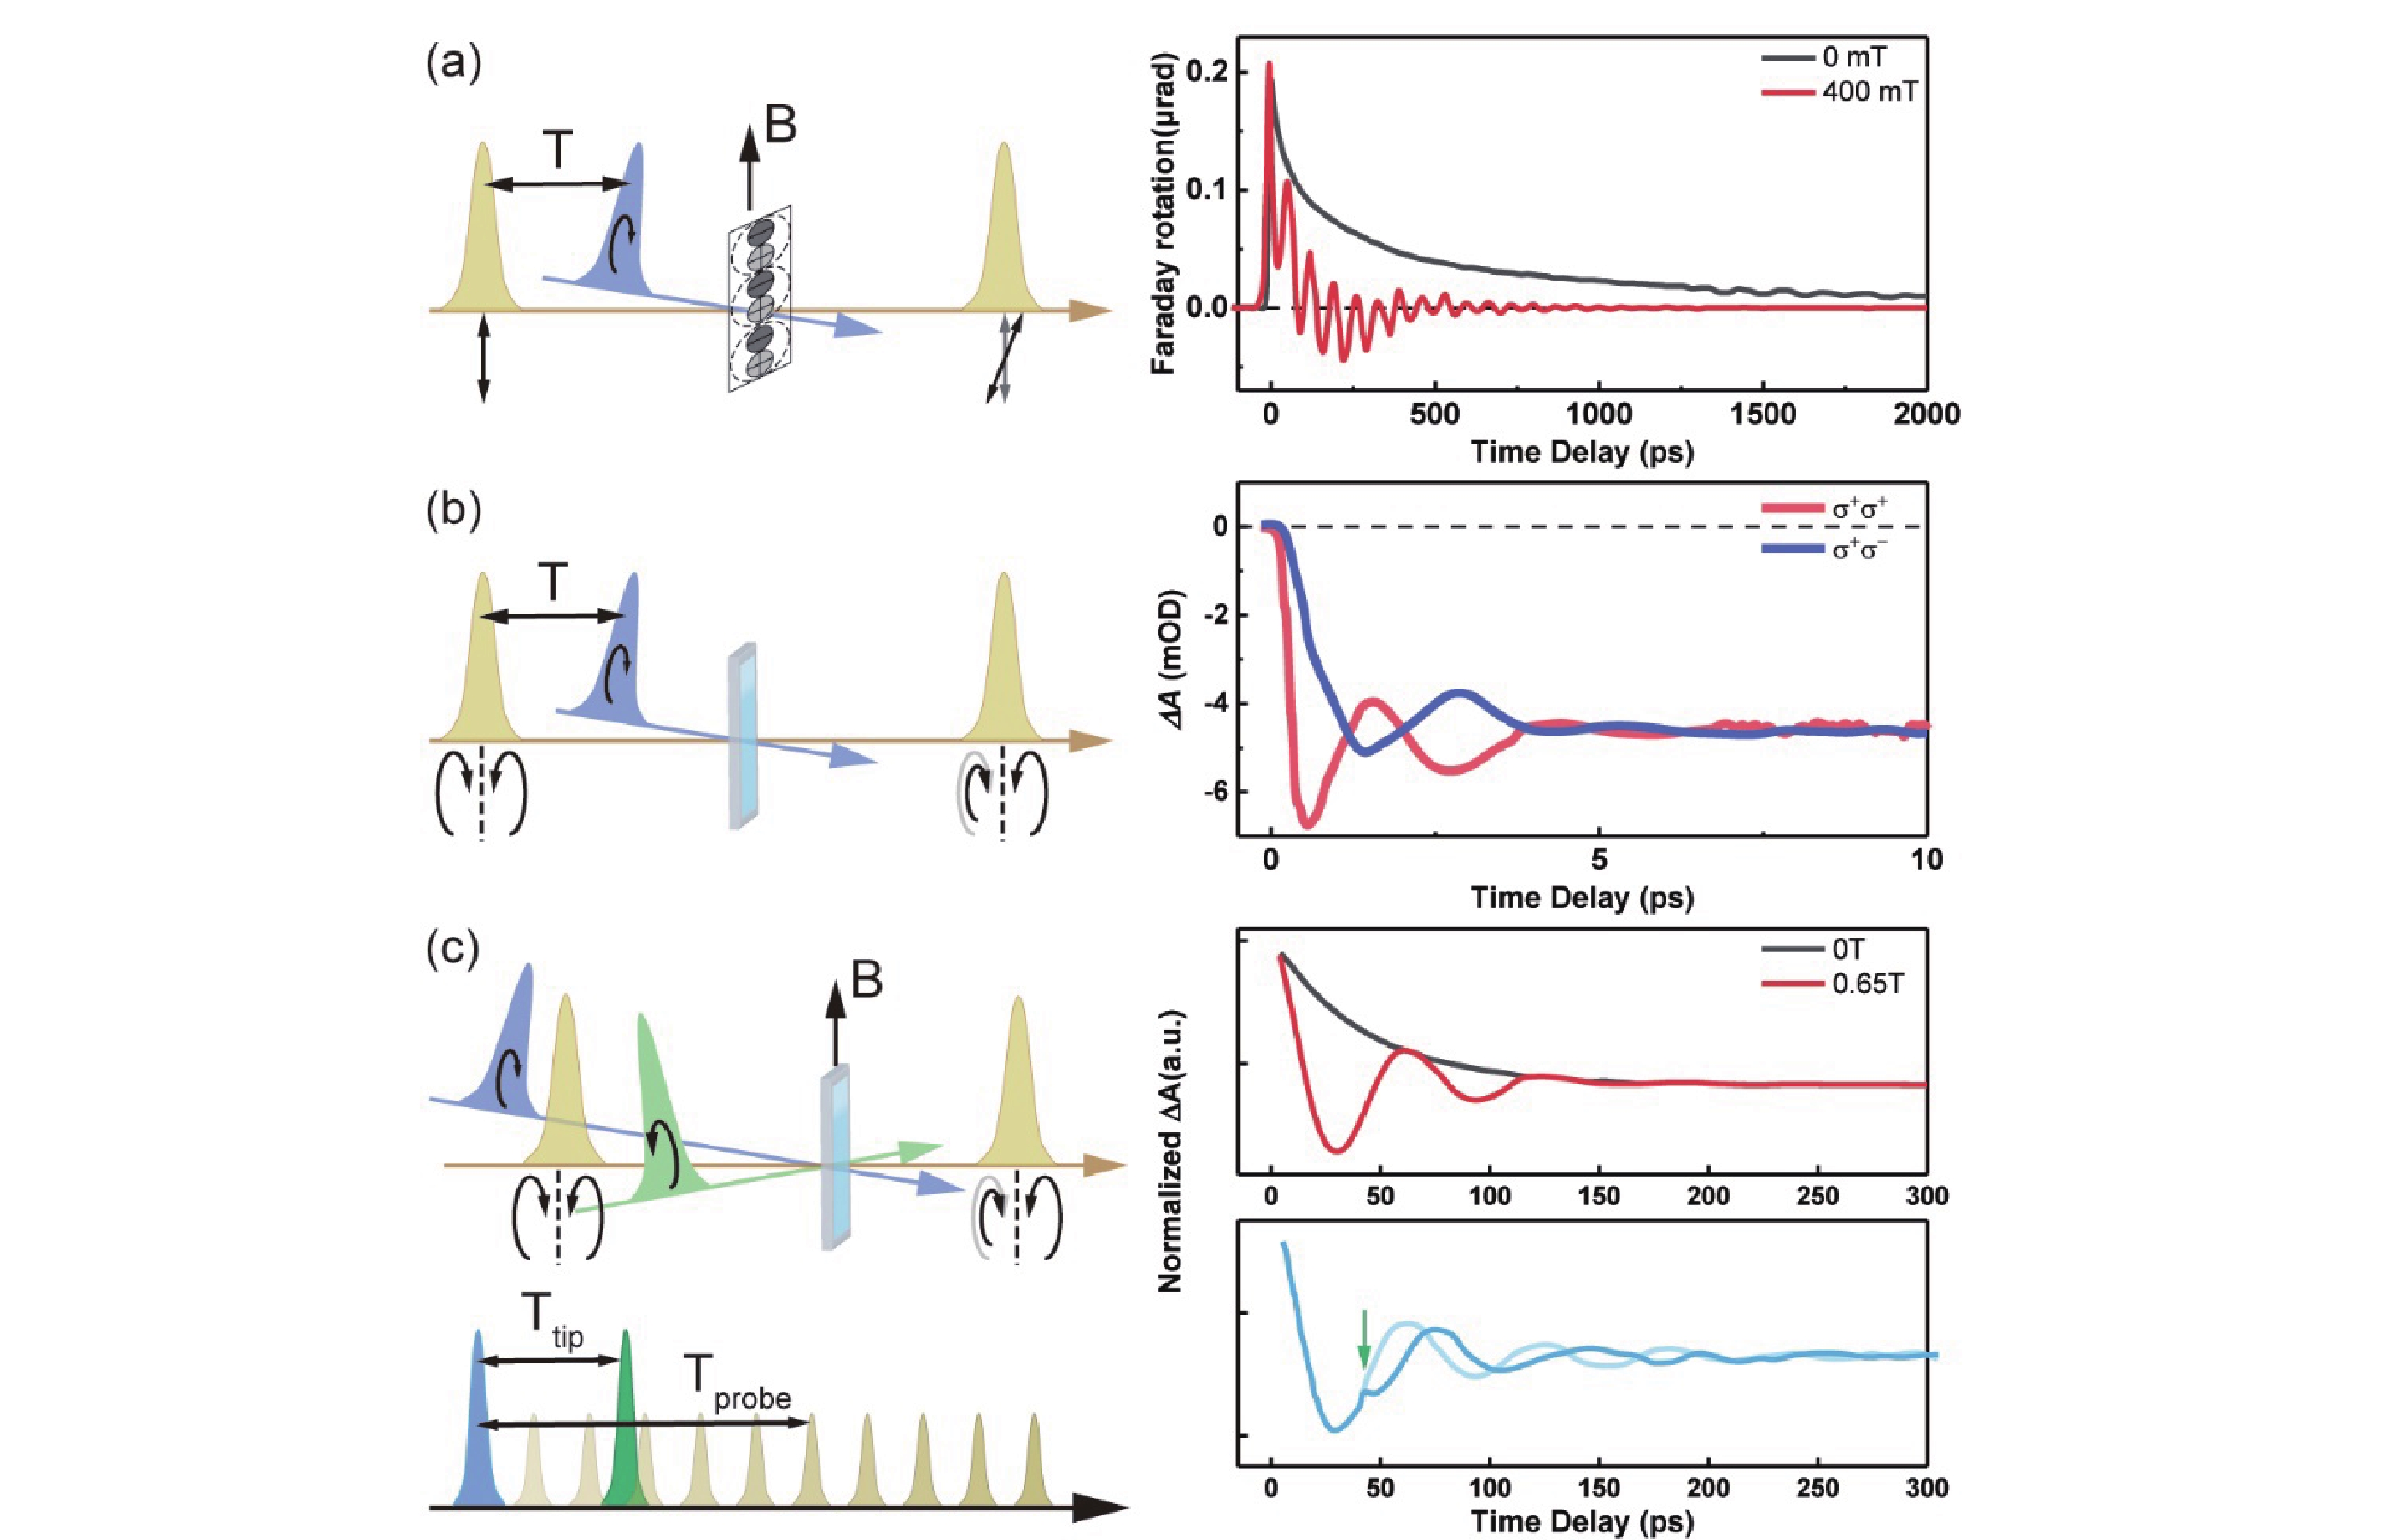
Figure 6. Detection of quantum beating by TRCD spectroscopy. (a) Detection of quantum jumps by probing the Faraday rotation signal for self-selected dynamics, revealing the relationship between its frequency and external field, reproduced from Ref.[37]. (b) Detection of quantum beating by probing quantum dots by differential absorption, responding to its frequency versus particle scale, reproduced from Ref.[38]. (c) Illustration of spin manipulation through the Stark effect combined with differential absorption detection, reproduced from Ref.[39].
Figure
6 ,Table
0 个