-
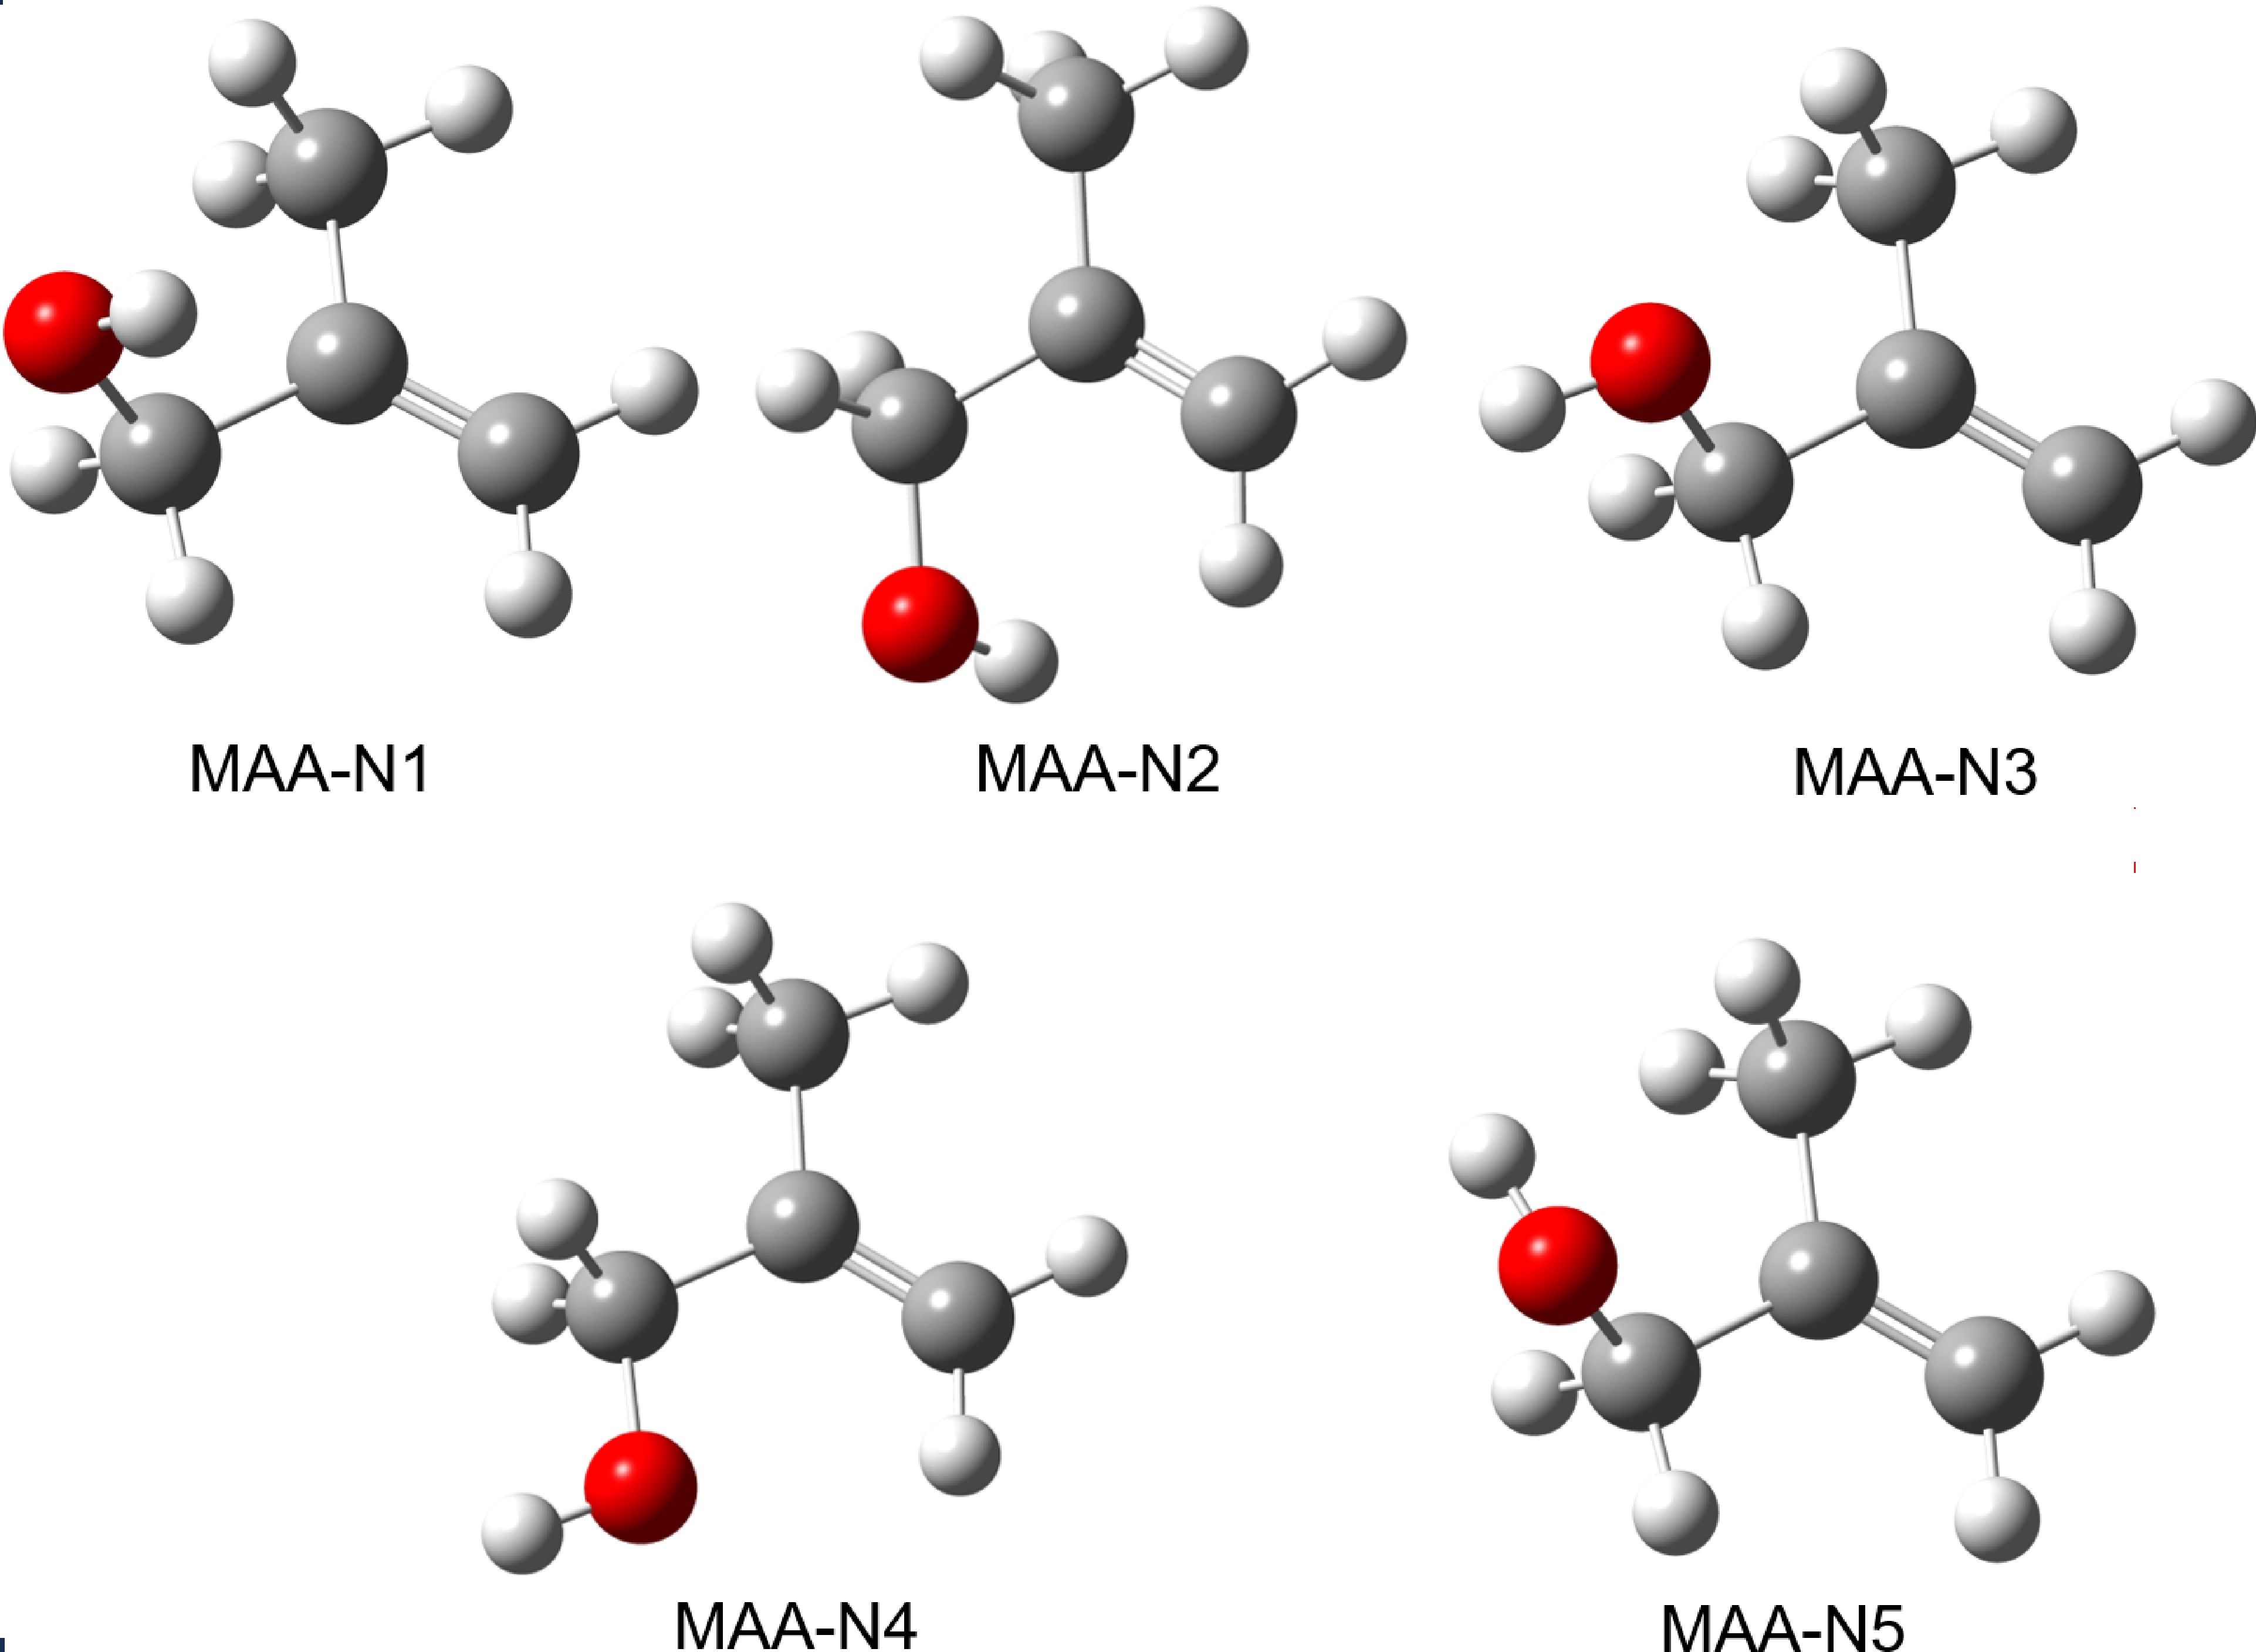
Figure 1. Structures of the five most stable conformers of neutral MAA, optimized at the B3LYP-D3(BJ)/def2-TZVPP level of theory.
-
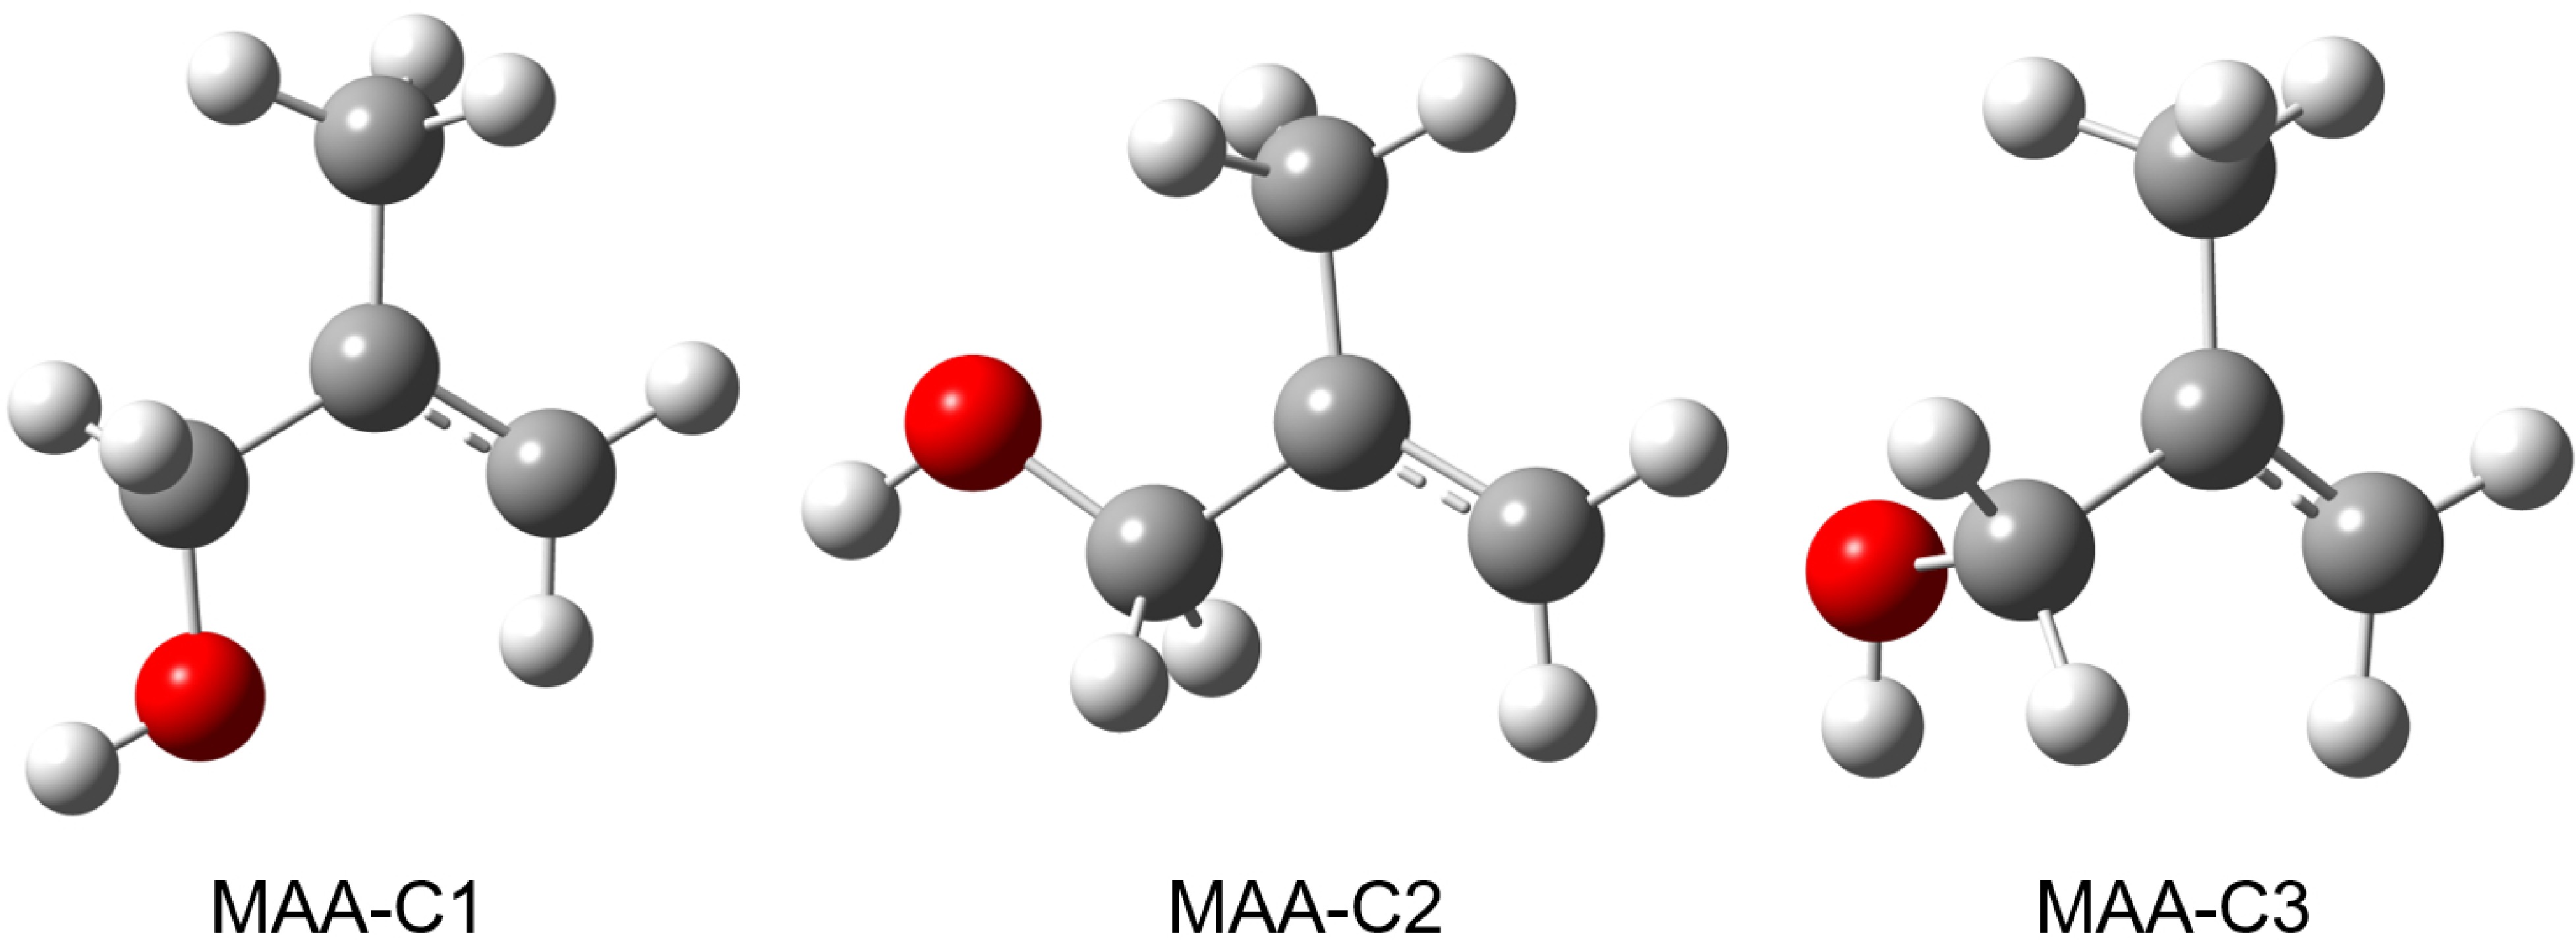
Figure 2. Structures of the three most stable conformers of cationic MAA, optimized at the B3LYP-D3(BJ)/def2-TZVPP level of theory.
-
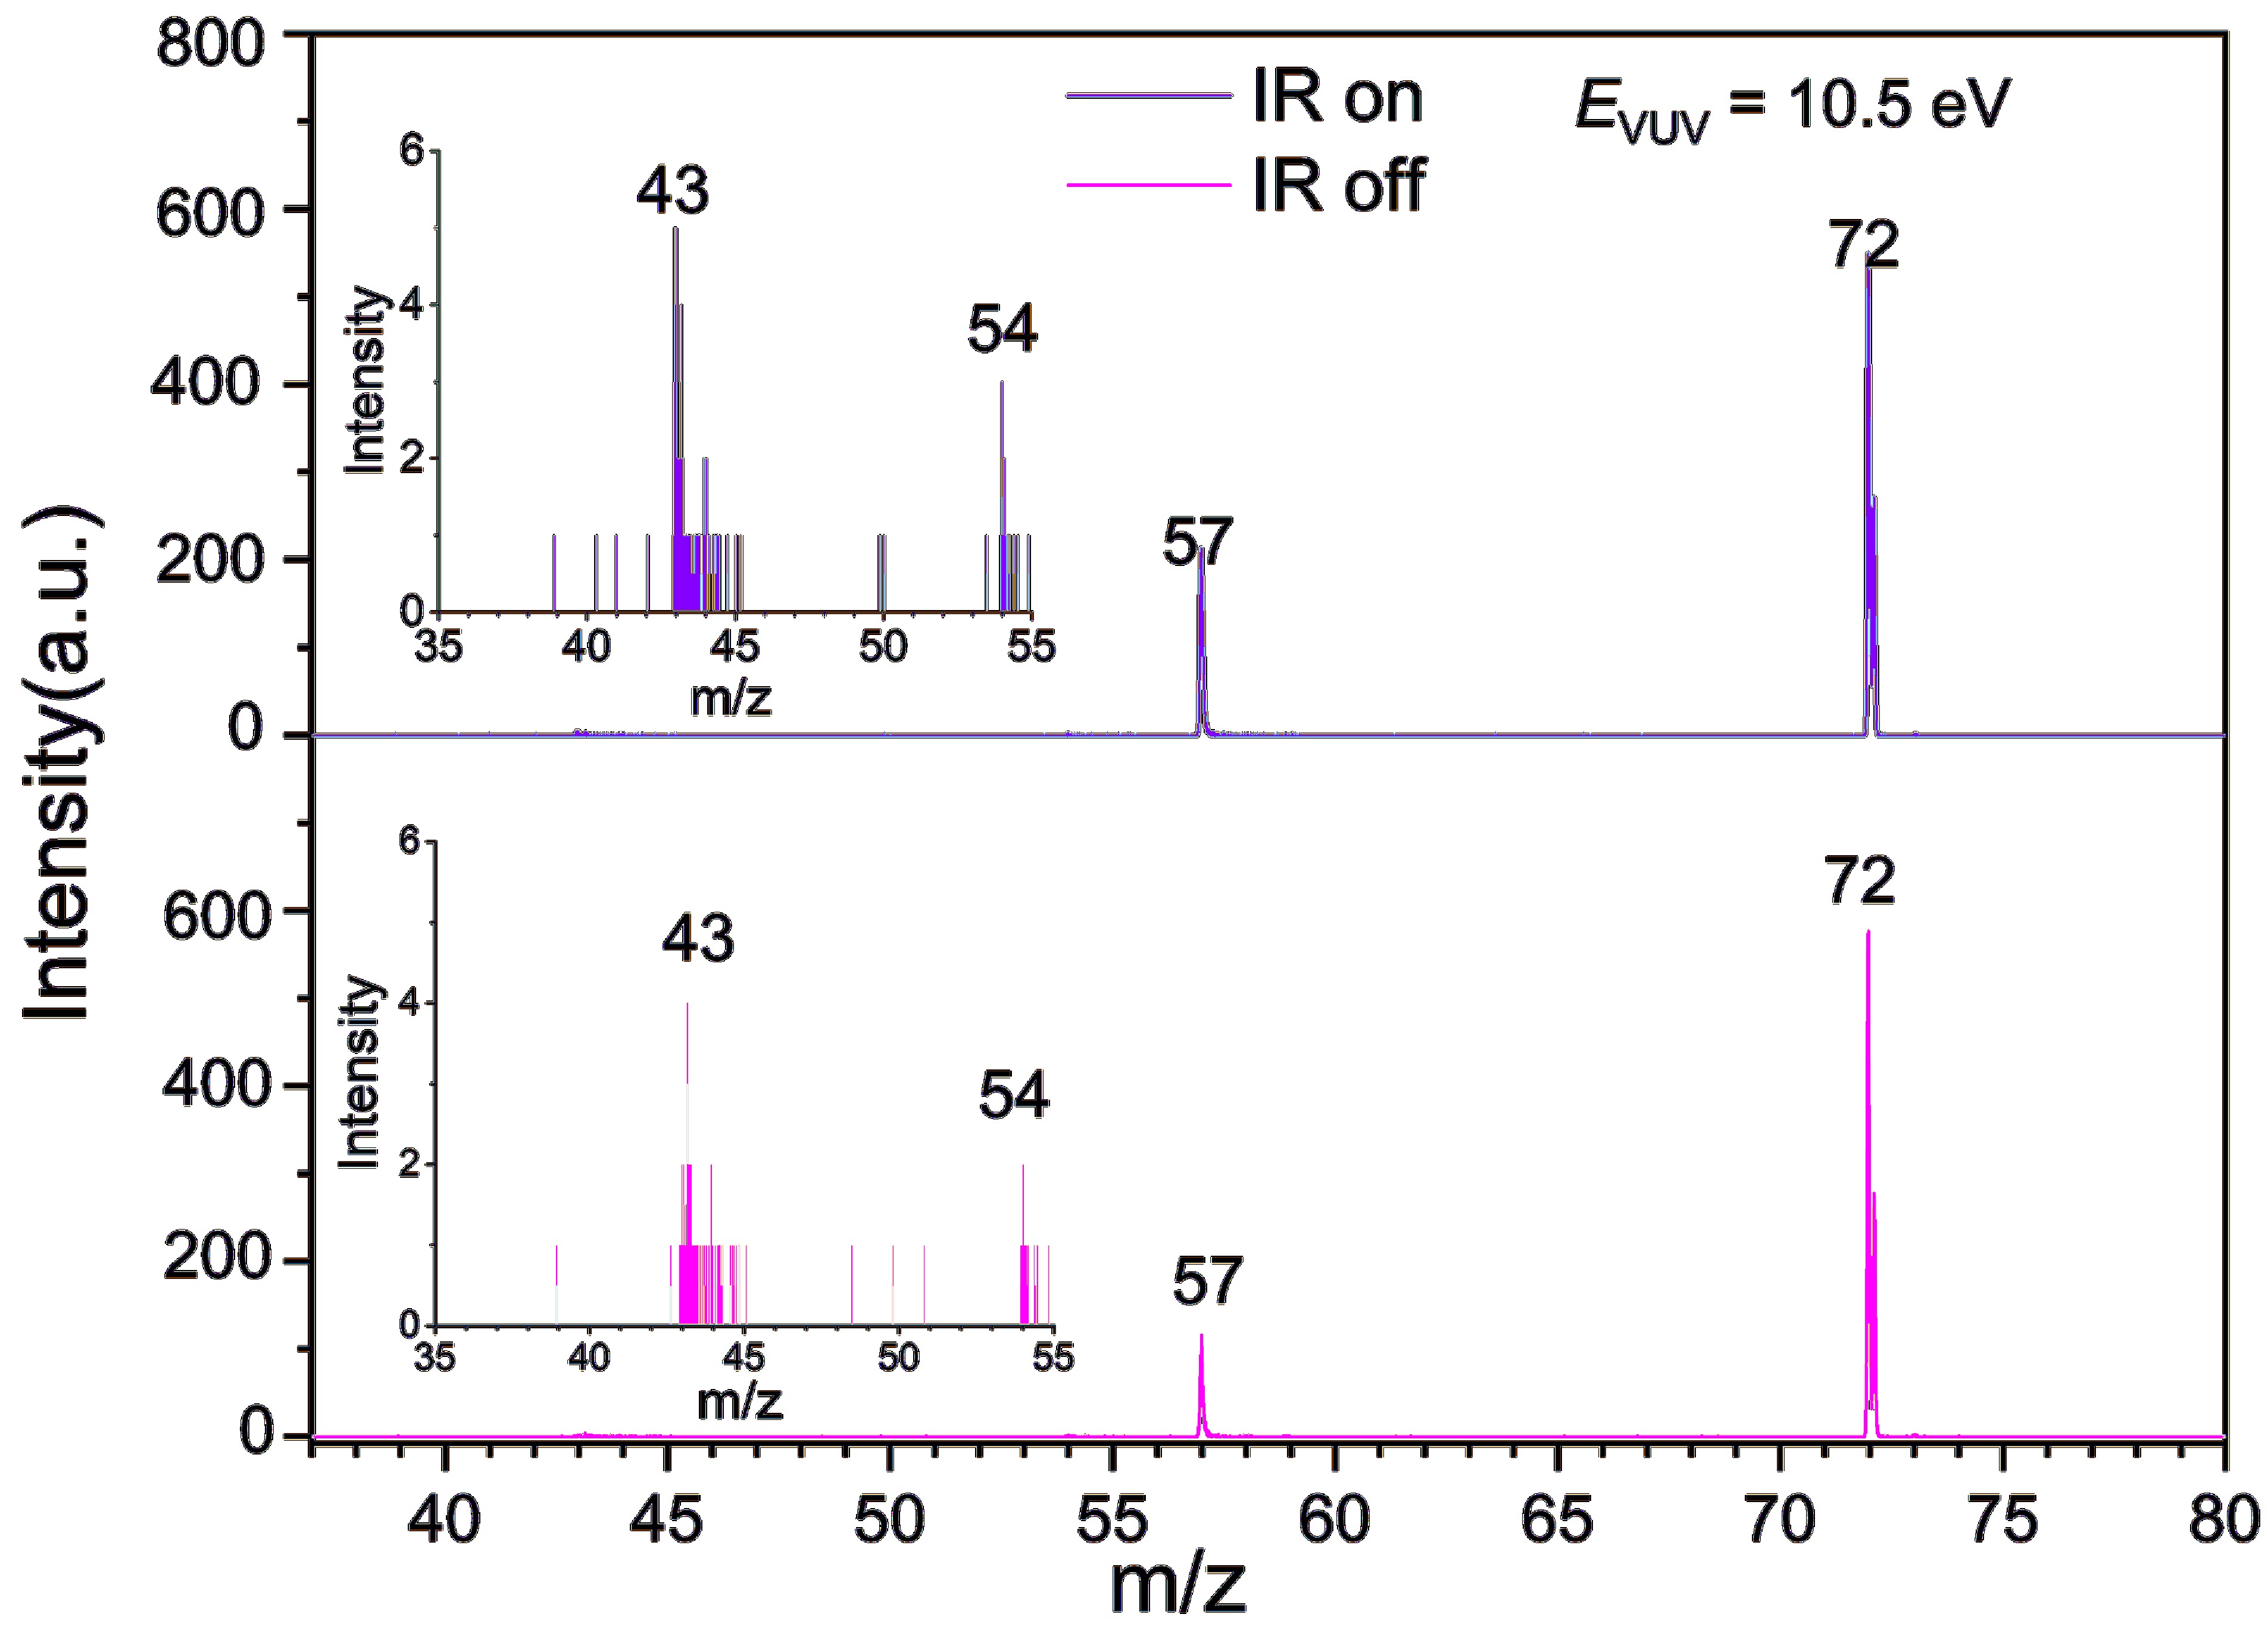
Figure 3. Mass spectra of MAA and its fragmentation products acquired using 118 nm single-photon ionization in the absence (bottom panel) and presence (top panel) of IR radiation at 2930 cm−1. The inset displays a partial enlargement of the m/z=35–55 range.
-
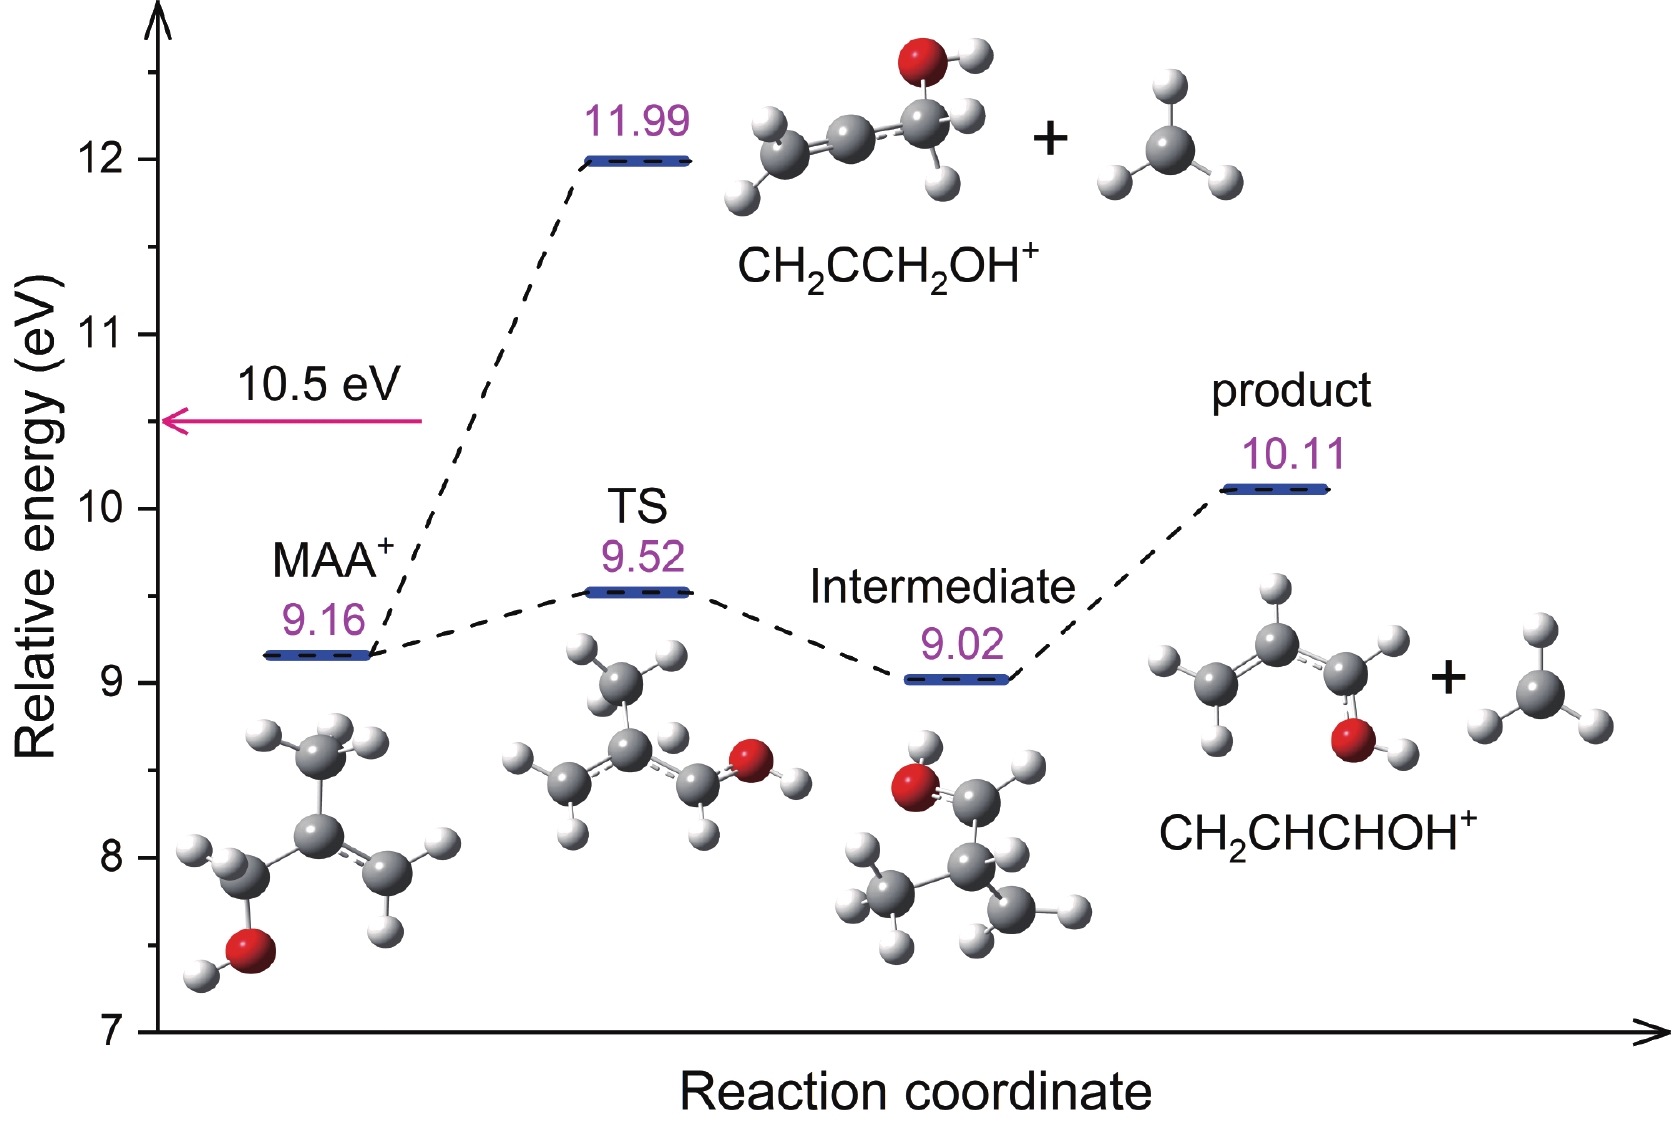
Figure 4. Two potential dissociative pathways of cationic MAA leading to the formation of CH2CHCHOH+ and CH2CCH2OH+. The relative energies (in eV) were calculated at DLPNO-CCSD(T)/aug-cc-pVTZ//B3LYP-D3(BJ) /def2-TZVPP level with zero-point energy correction.
-
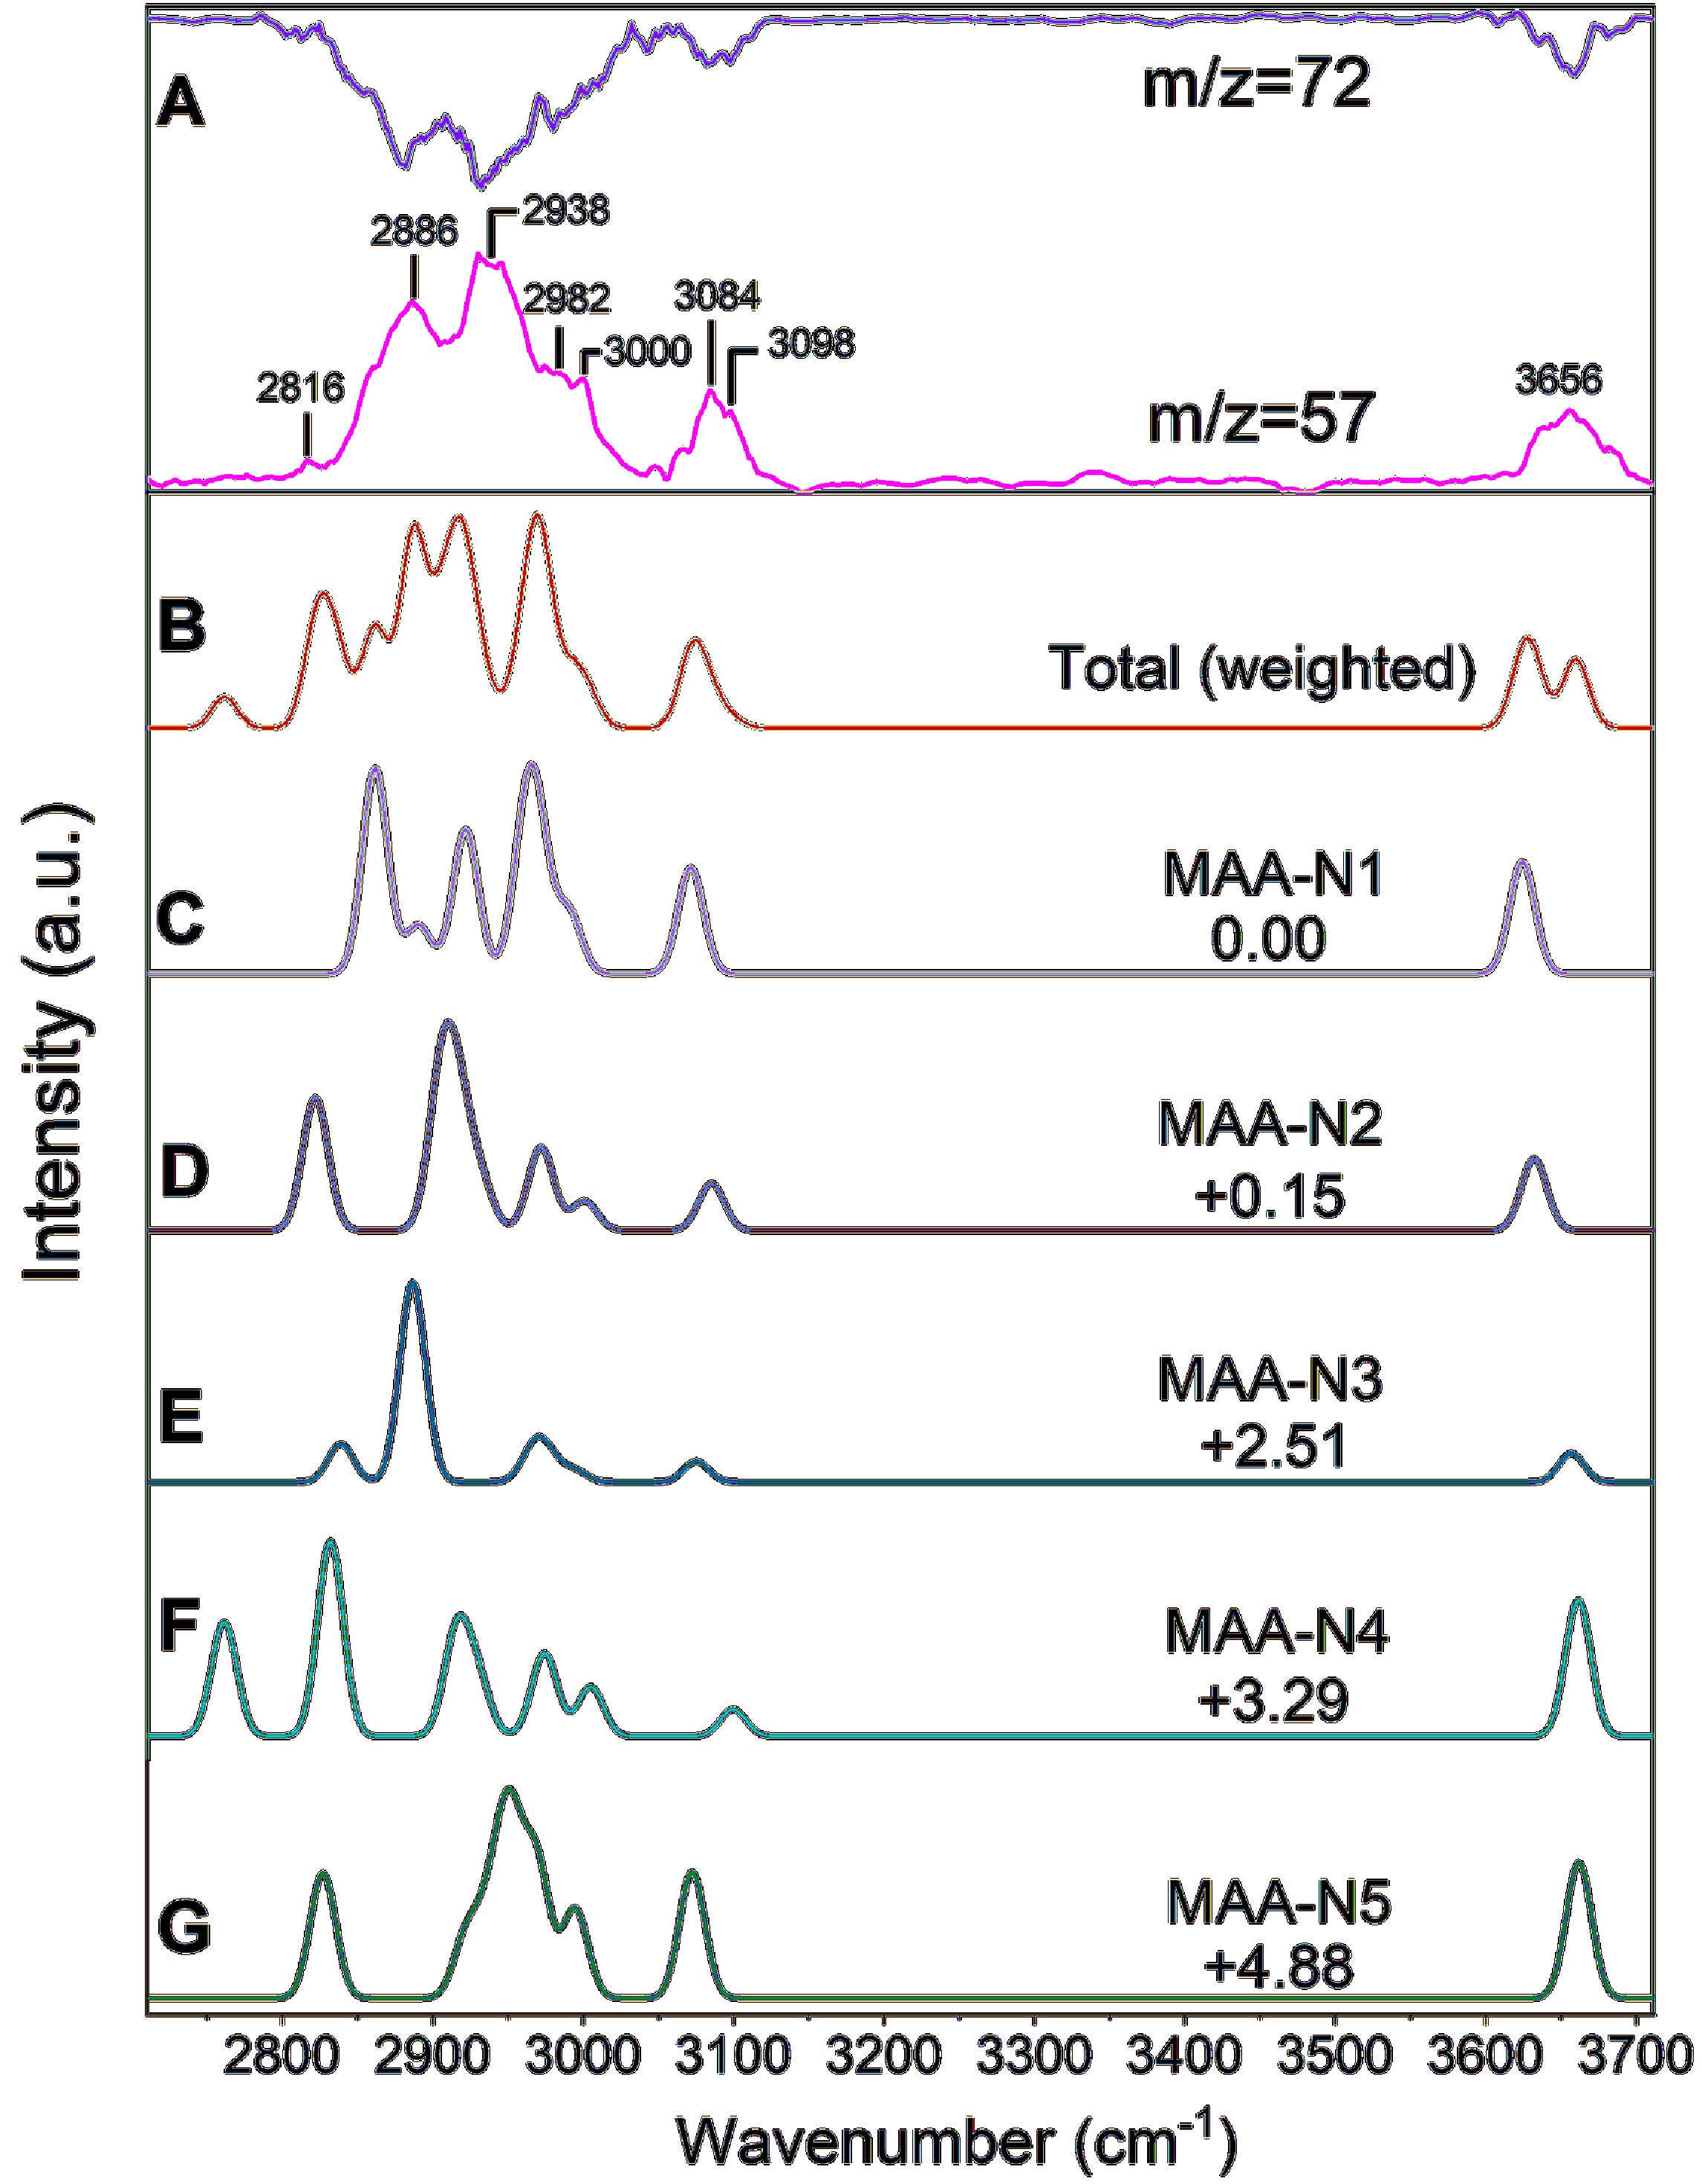
Figure 5. Comparison of the experimental and calculated IR spectra of neutral MAA. (A) Experimental IR spectrum of neutral MAA by monitoring both the parent ion (m/z=72) and fragment ion (m/z=57). (B) Simulated total anharmonic IR spectra of neutral MAA, weighted by the Boltzmann populations of the five conformers. (C–G) Simulated anharmonic IR spectrum (VPT2) of each isomer, with DFT calculations performed at the B3LYP-D3(BJ)/def2-TZVPP level of theory. The ZPE-corrected relative energies are shown in kJ/mol.
-
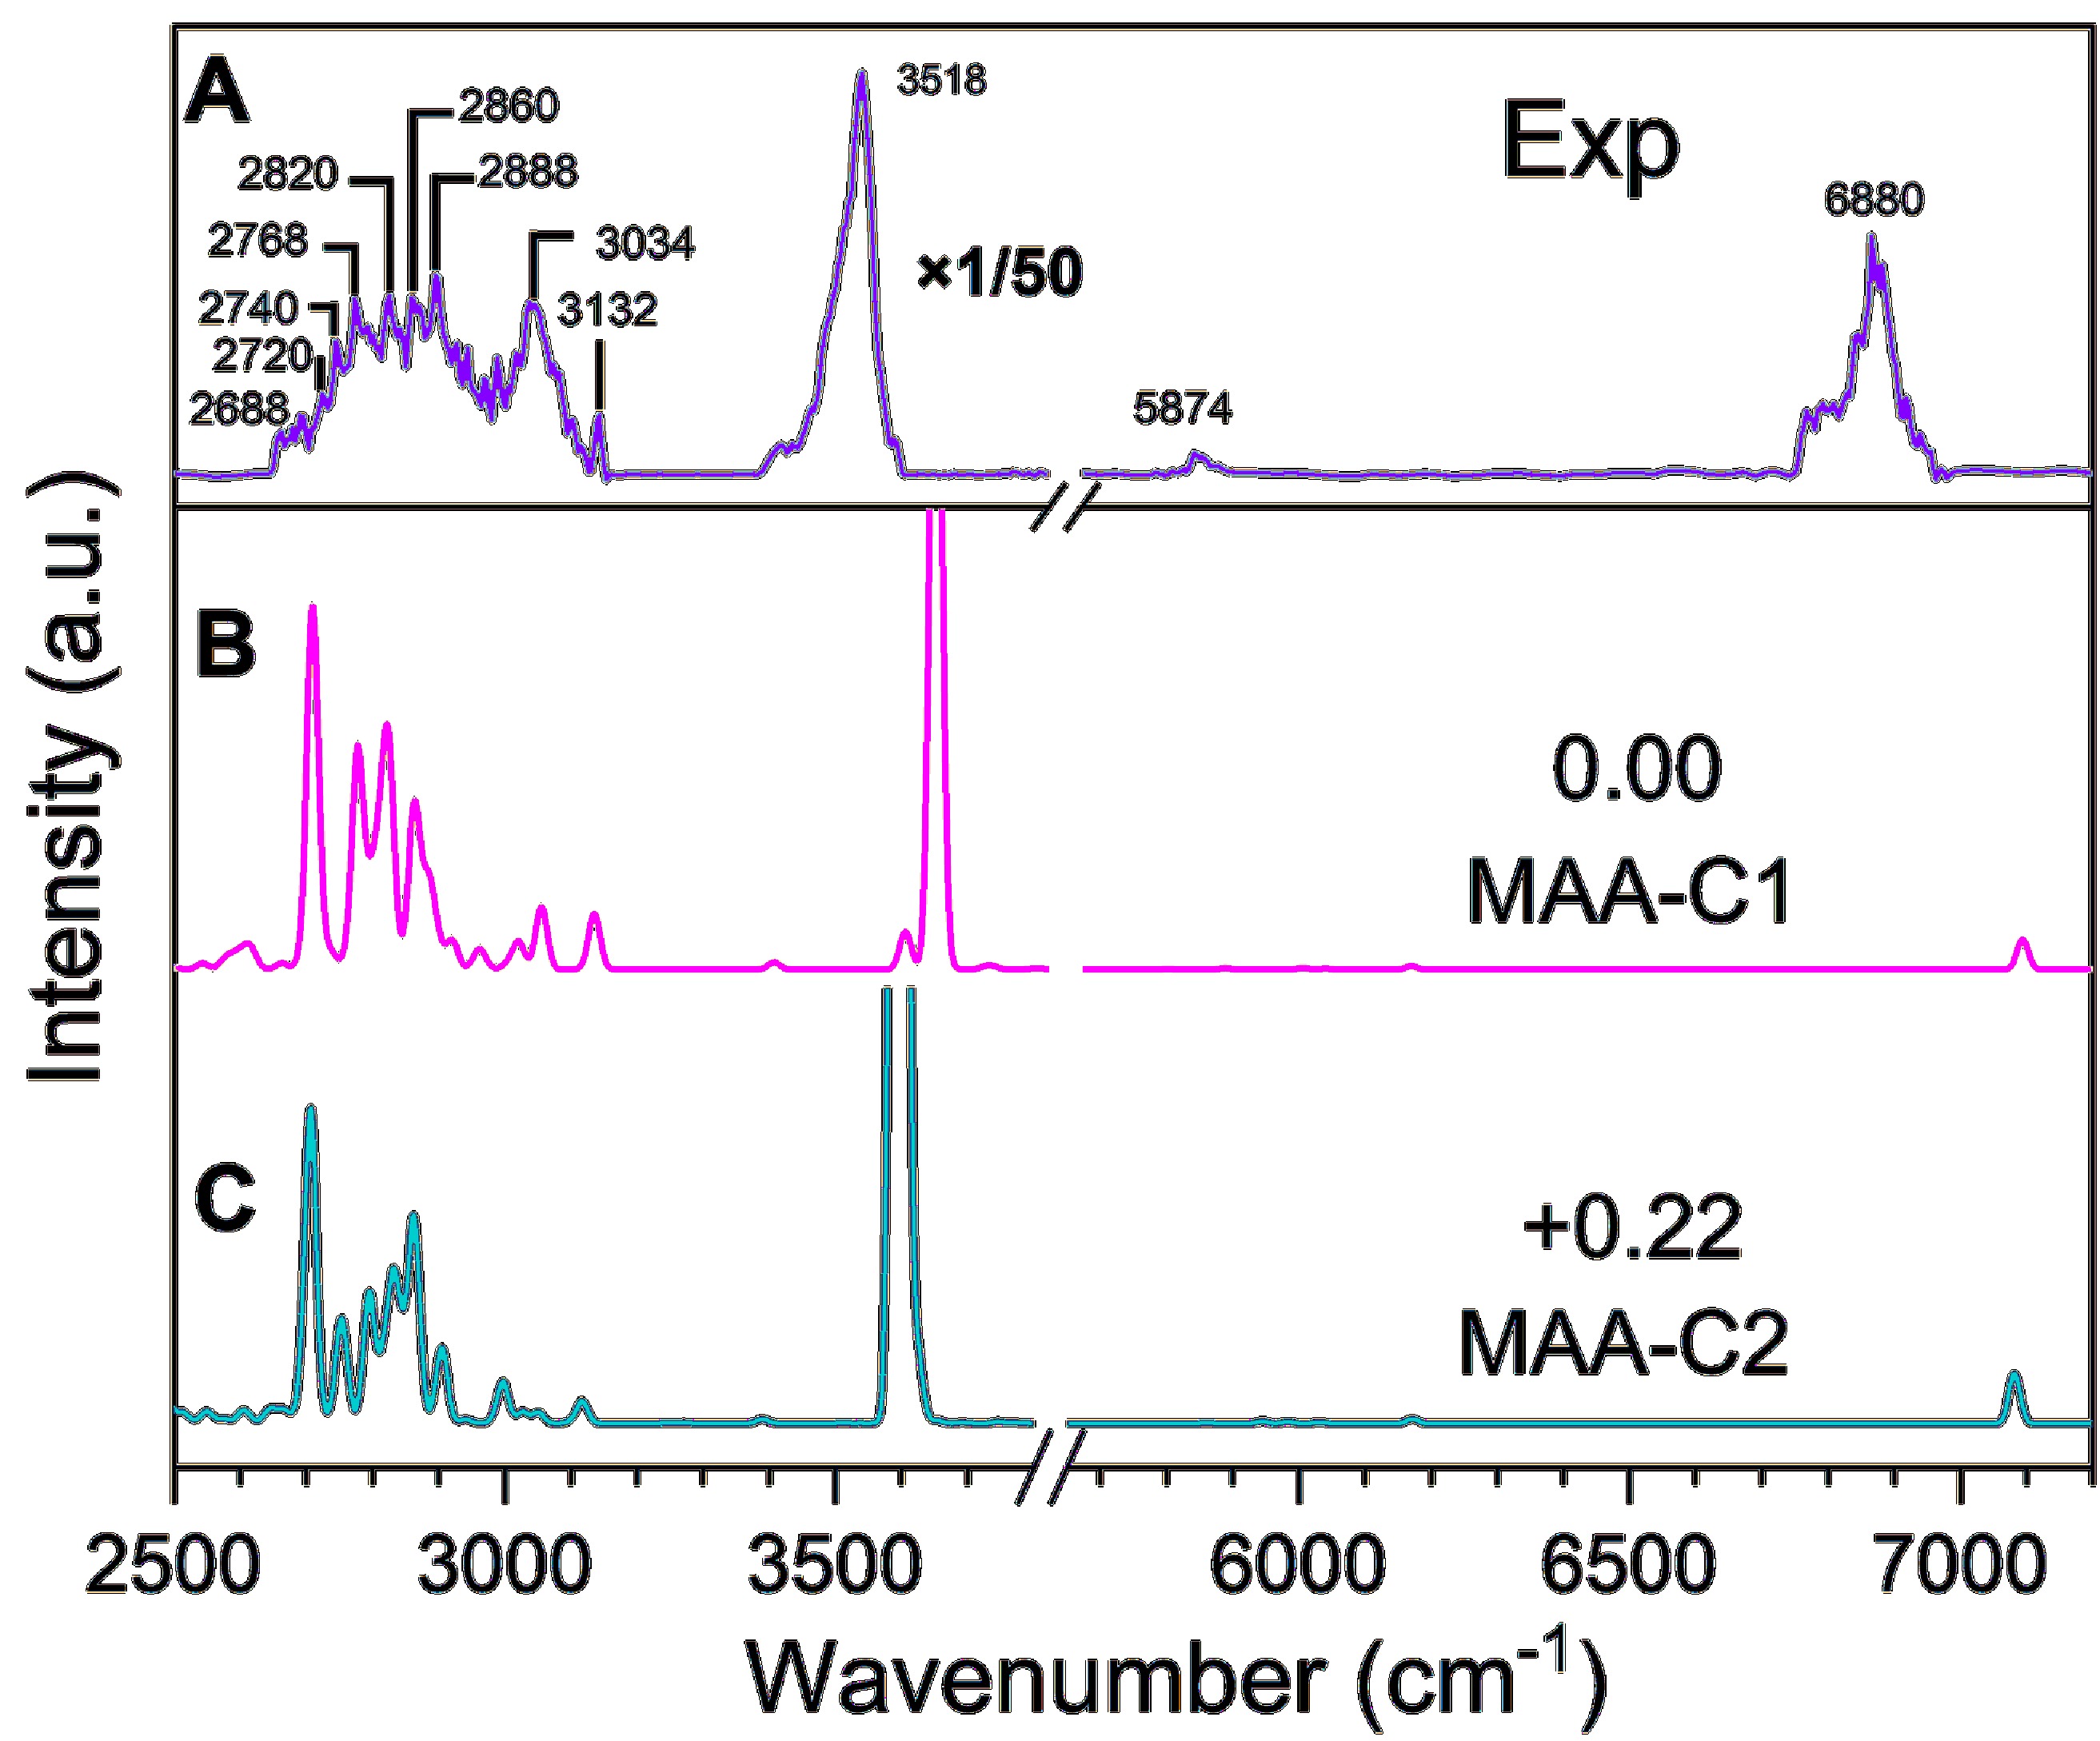
Figure 6. Comparison between the experimental and calculated IR spectra of the cationic MAA. (A) Experimental IR spectrum by monitoring the fragment ion (m/z=57). (B) and (C) The simulated anharmonic IR spectra of each isomer. The ZPE-corrected relative energies of the two conformers are shown in kJ/mol.
-
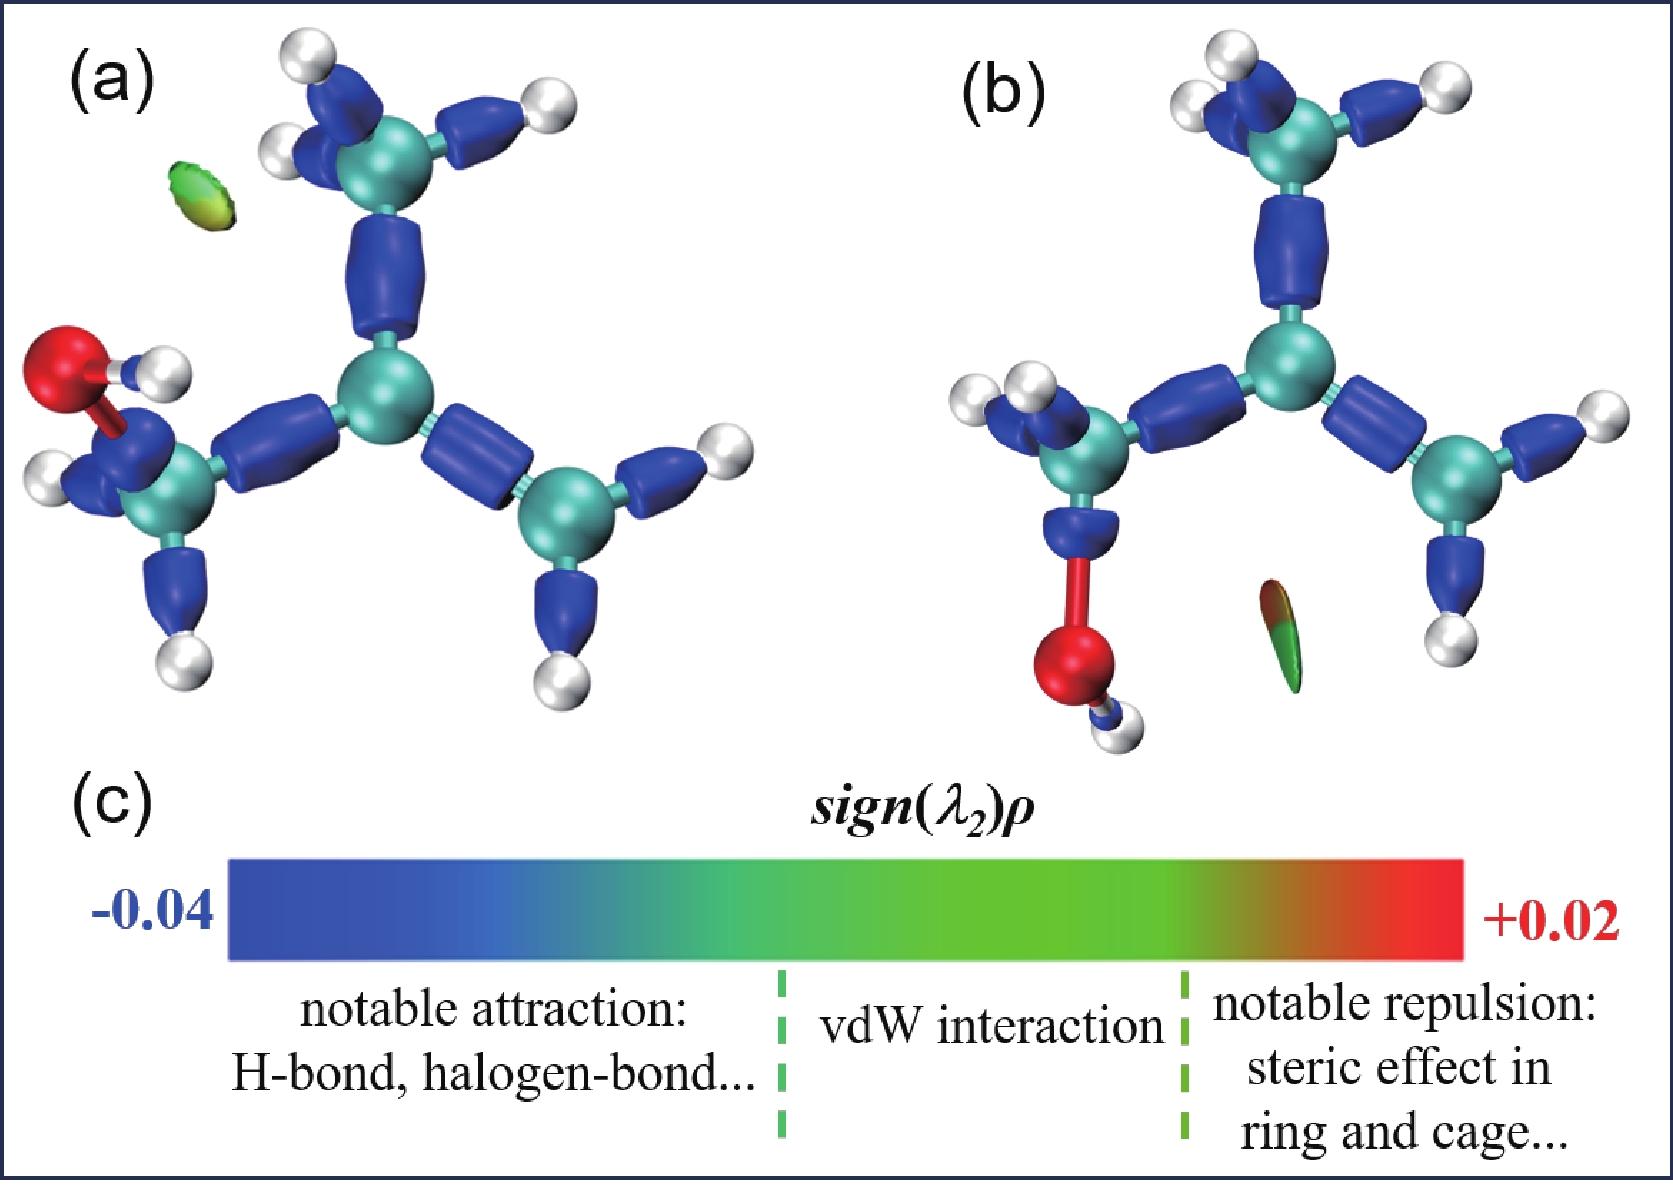
Figure 7. IRI isosurface maps for MAA-N1 (a) and MAA-N2 (b). (c) Sign(λ2)ρ is mapped onto the isosurfaces using the coloring method described in Ref.[47].
Figure
7 ,Table
2 个