-
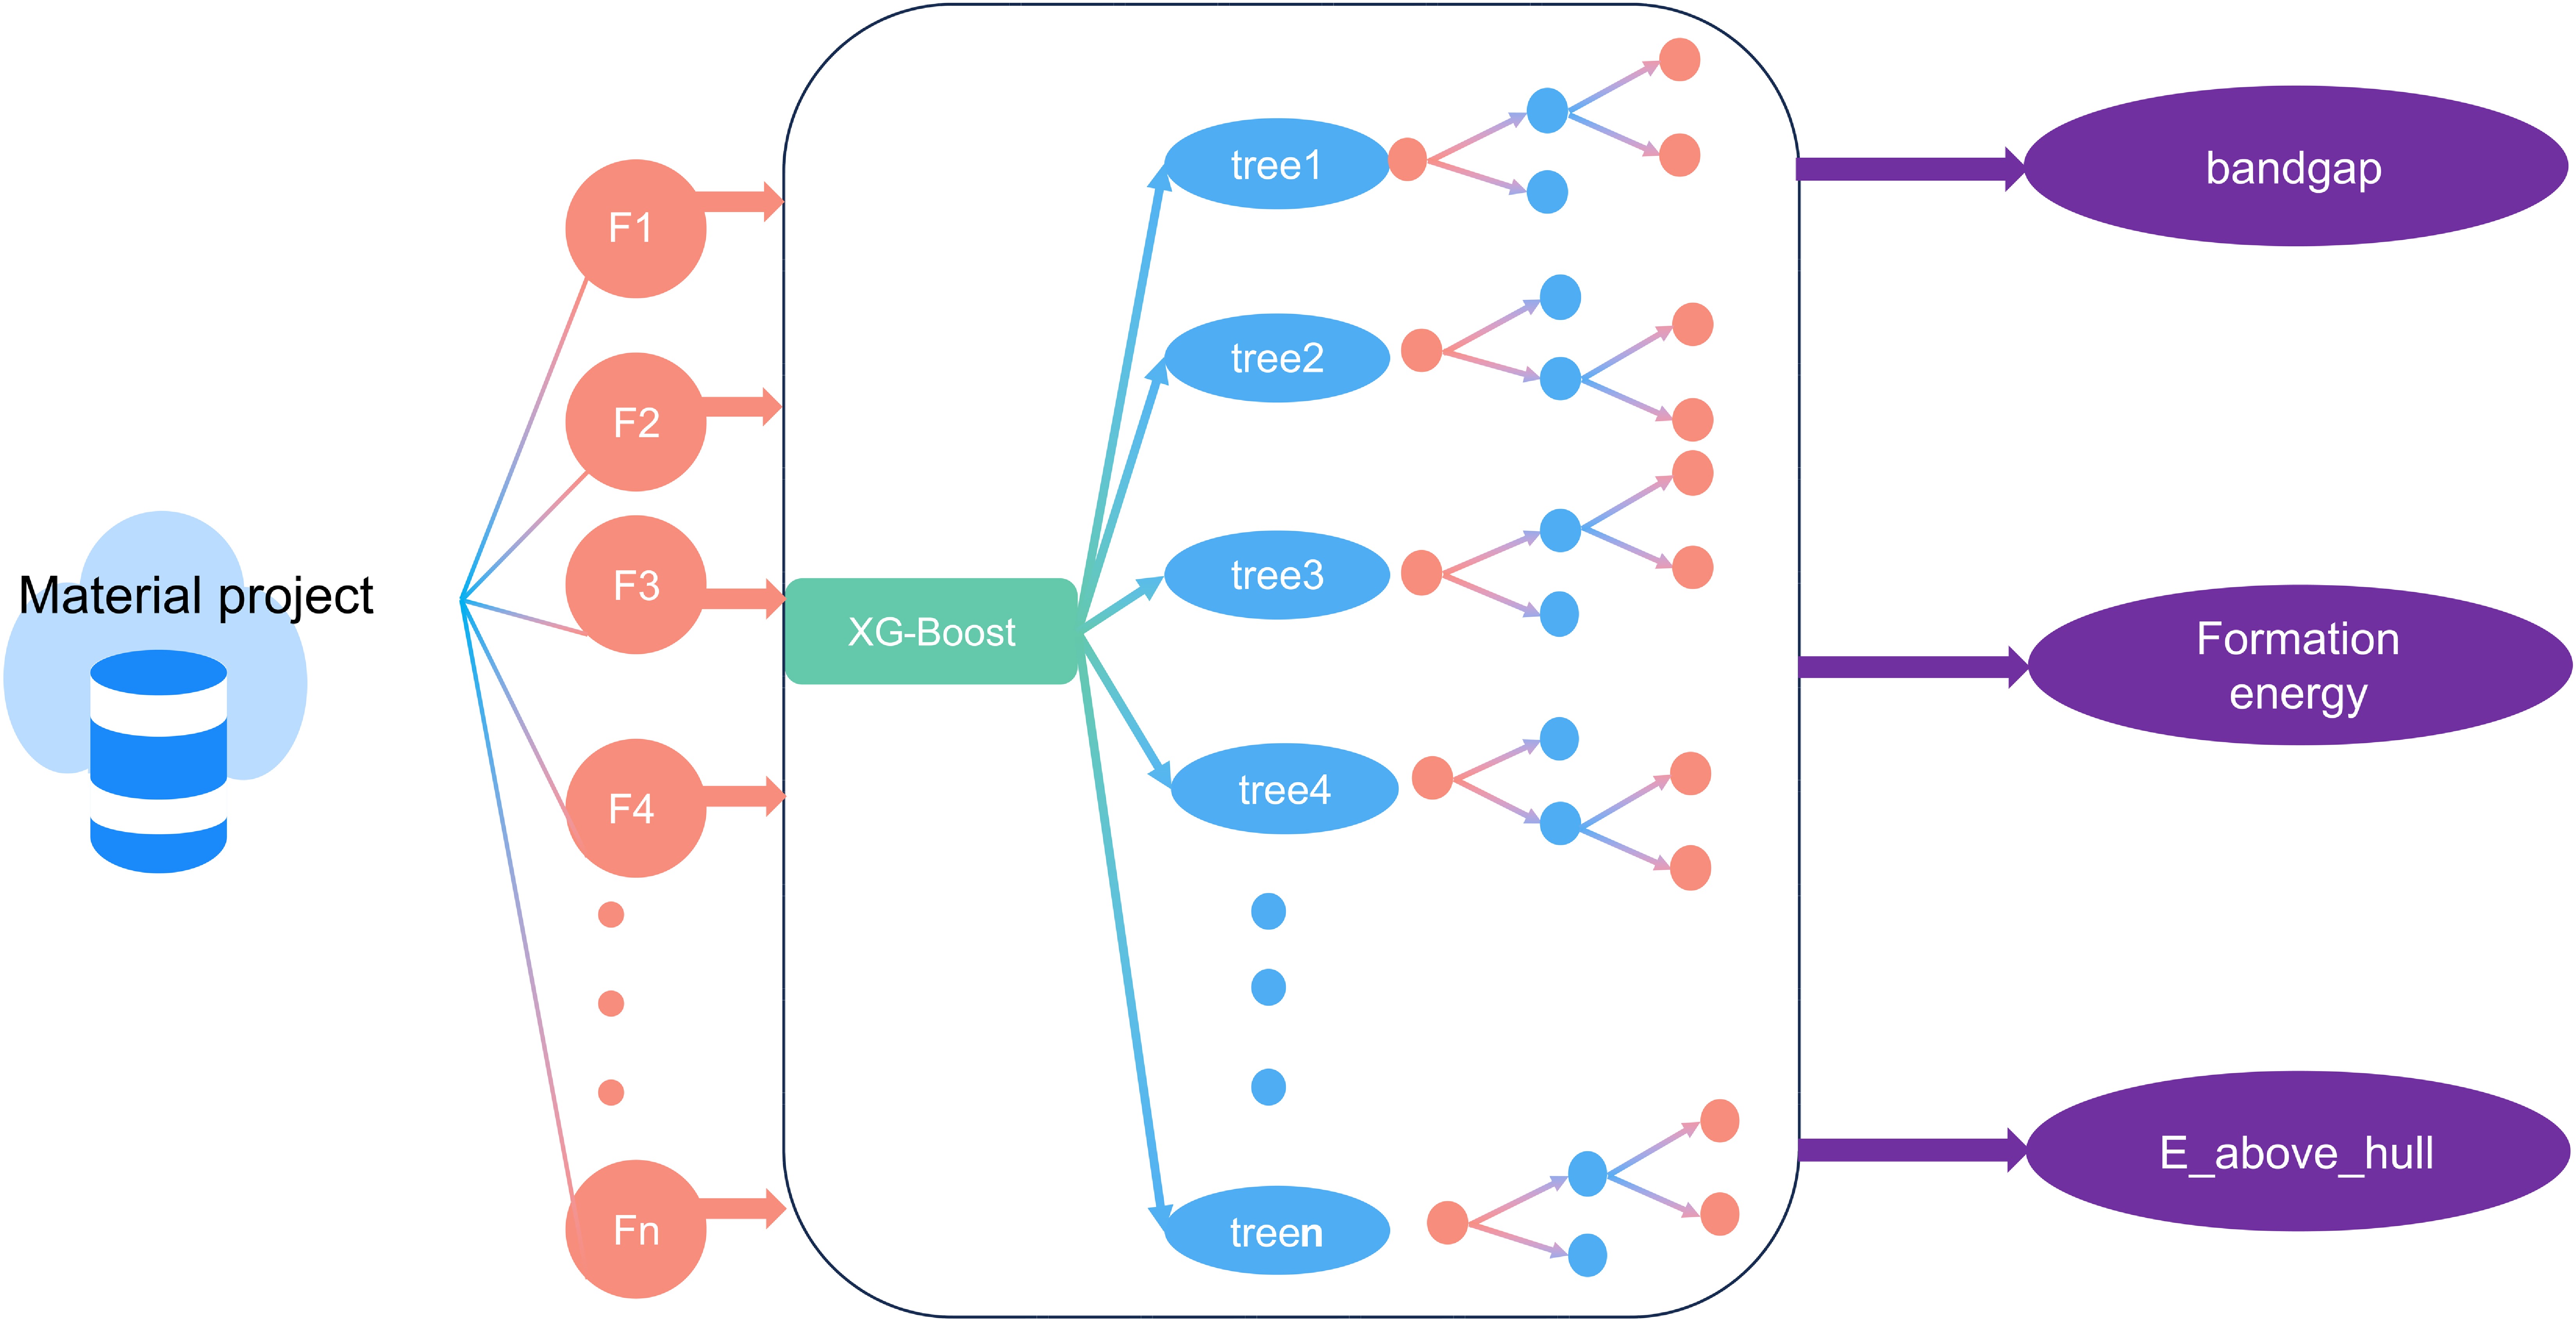
Figure 1. Framework for predicting the properties of solid-state electrolytes using XGBoost.
-

Figure 2. The distribution of band gap and stability characteristics of three different types of solid-state electrolytes. (a) The distribution of bandgap properties among three types of solid-state electrolytes. (b) Formation energy distributions for all bandgap ranges of the three structure types, as well as sulfide formation energy distributions in the bandgap > 2 eV range and oxide and halide formation energy distributions in the bandgap > 4 eV range. Phase stability distributions of (c) sulfides, (d) halides, (e) oxides, and corresponding band gaps and formation energies (regions with z < 0.5 represent stable structures, regions with z > 0.5 represent unstable structures).
-

Figure 3. Machine learning models for prediction of solid state electrolyte structure. (a) Feature correlation of 24 atomic descriptors. (b) Classification models for classification of wide and narrow band gaps and phase stability. (c) Regression prediction model for wide band gap structure. (d) Regression prediction model for formation energies. (e) Ranking of the three models for regression of band gaps, regression of formation energies and classification of phase stability. Ranking of the feature significance of the three models for band gap regression, formation energy regression, and phase stability classification.
-
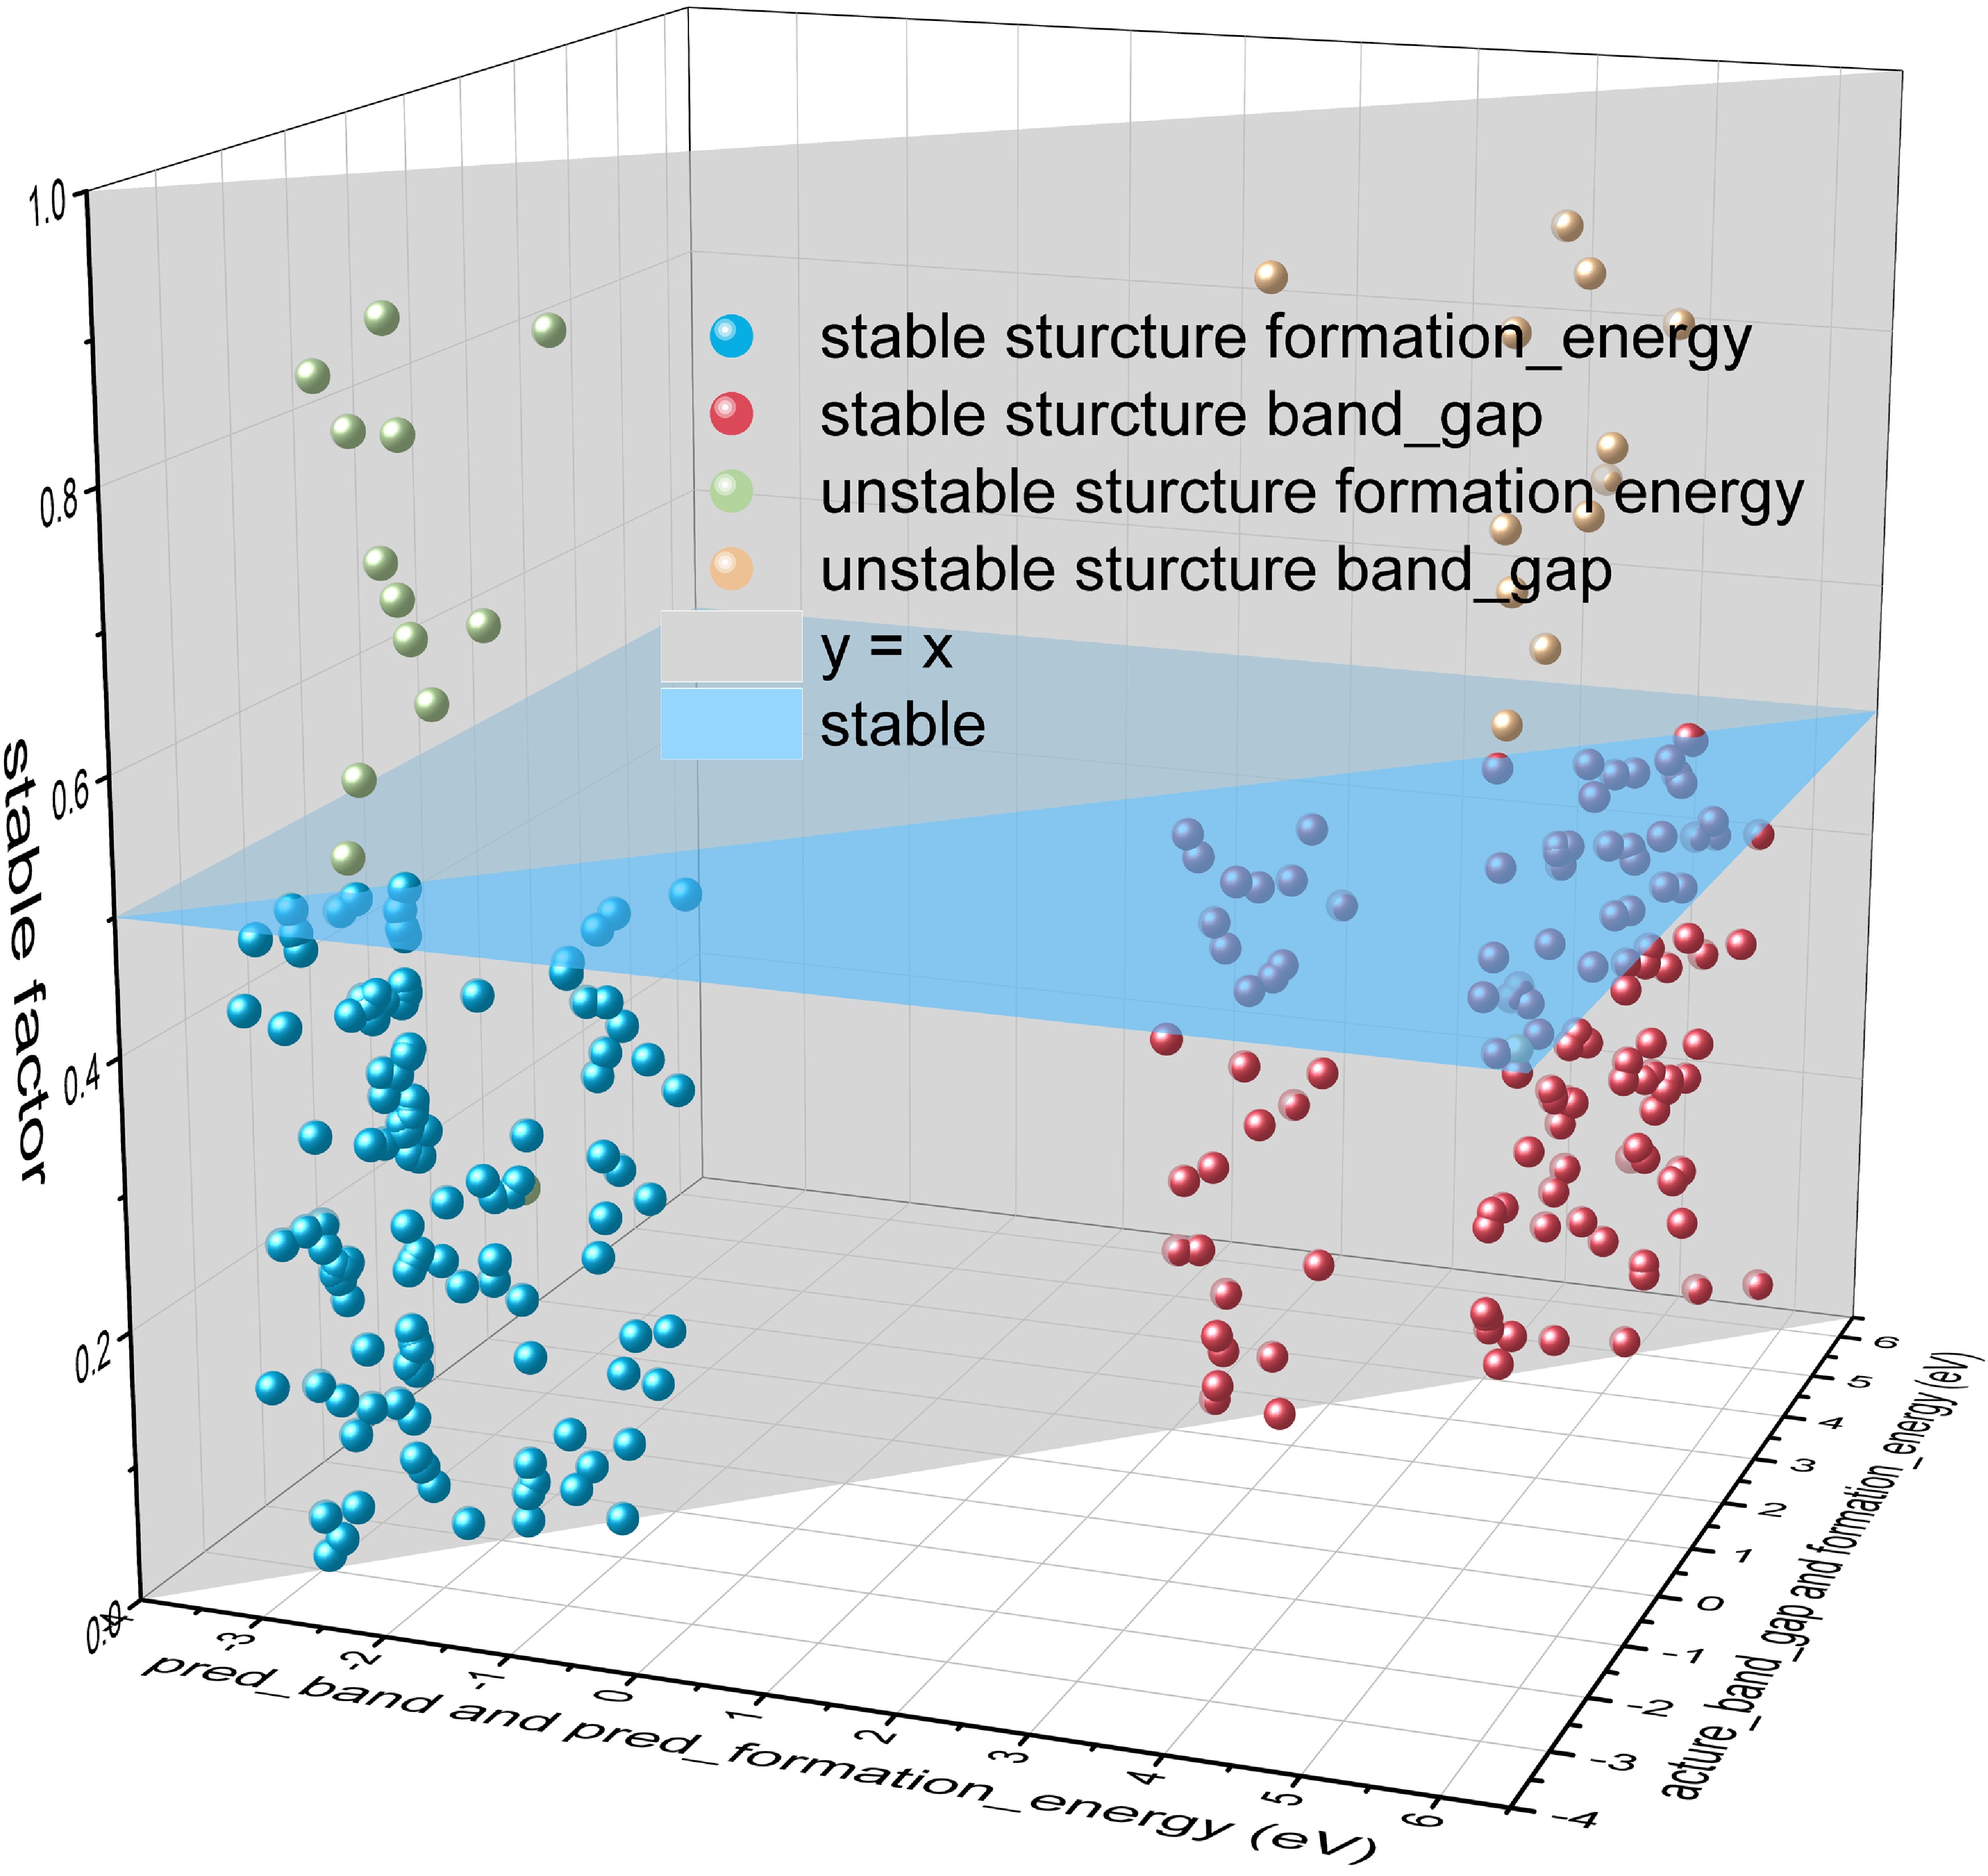
Figure 4. Validation of the accuracy of the model through the distribution of predicted and actual values. Distribution of predicted and actual values of properties after screening by machine learning algorithms (regions below z = 0.5 are predicted stable structures).
Figure
4 ,Table
0 个