-
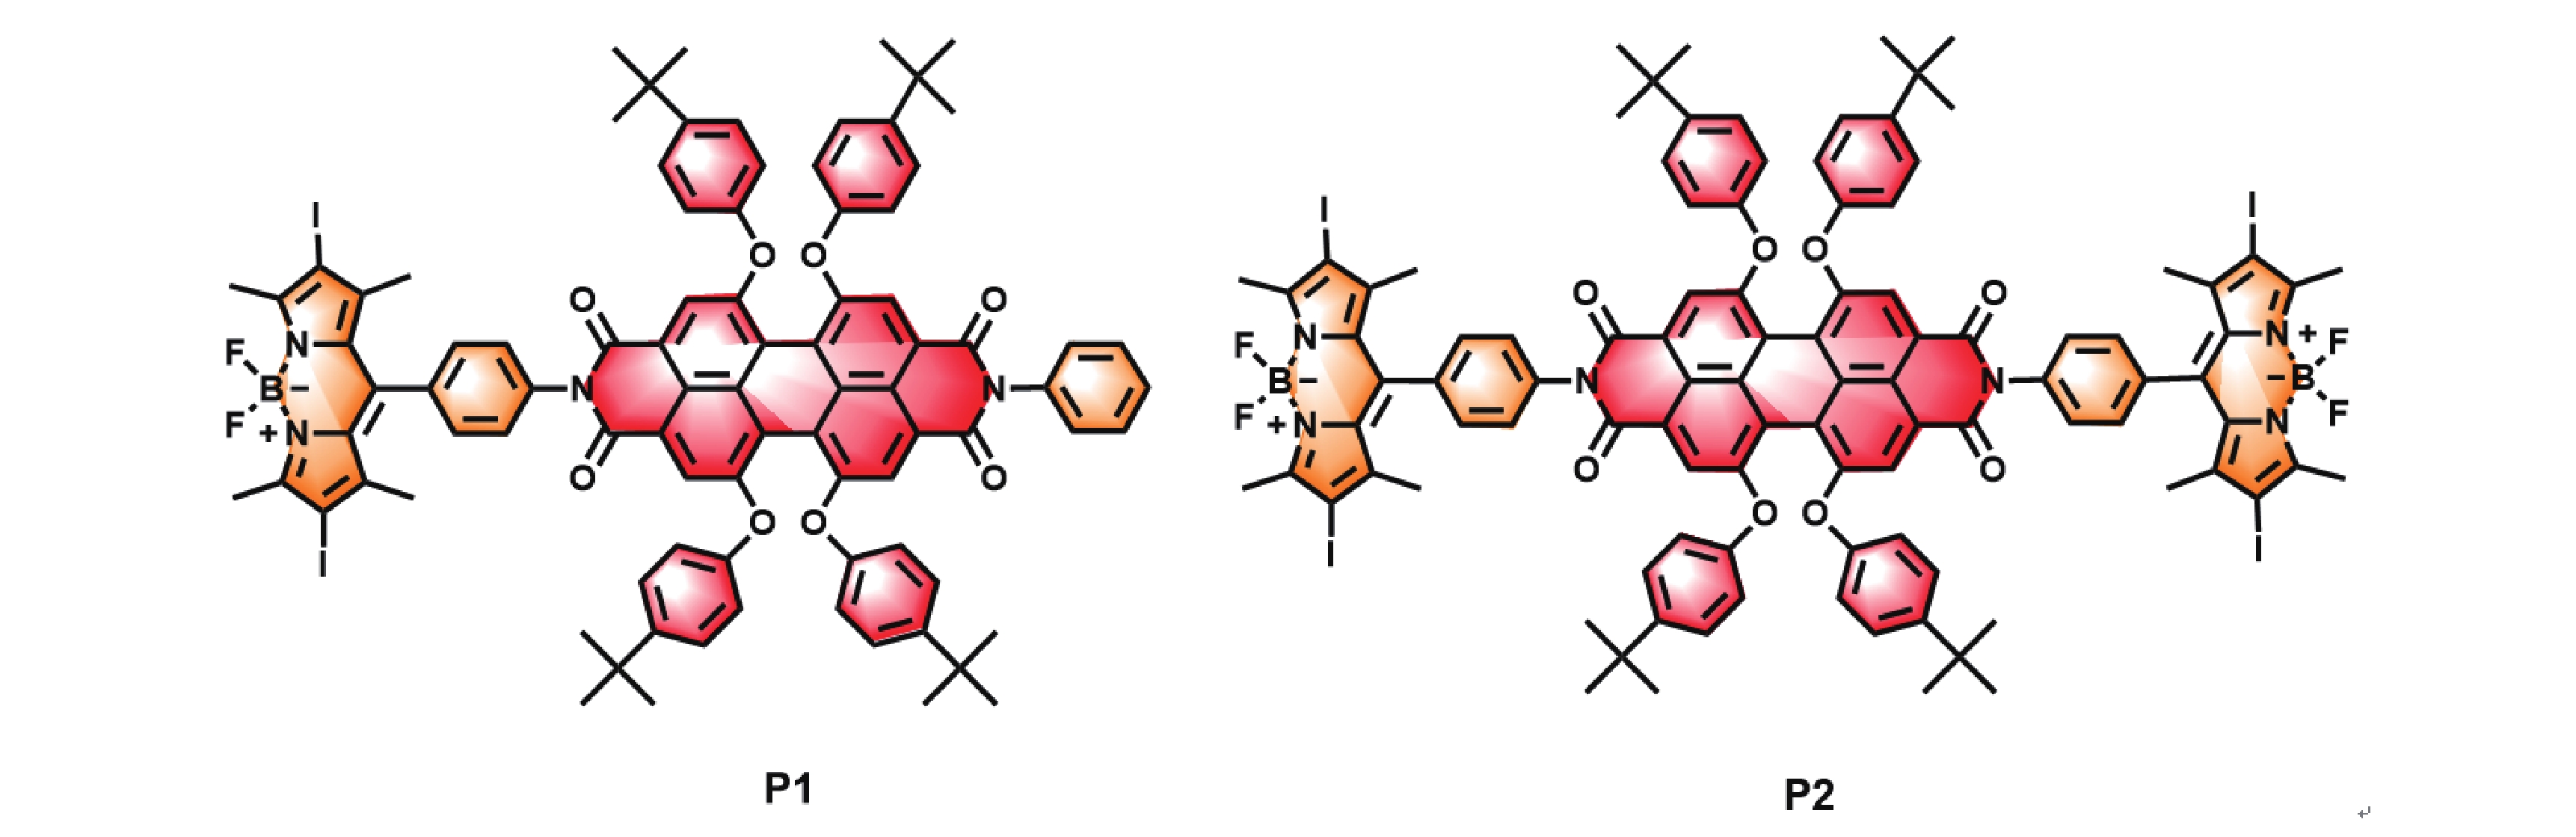
Figure 1. The structures of compounds P1 and P2.
-
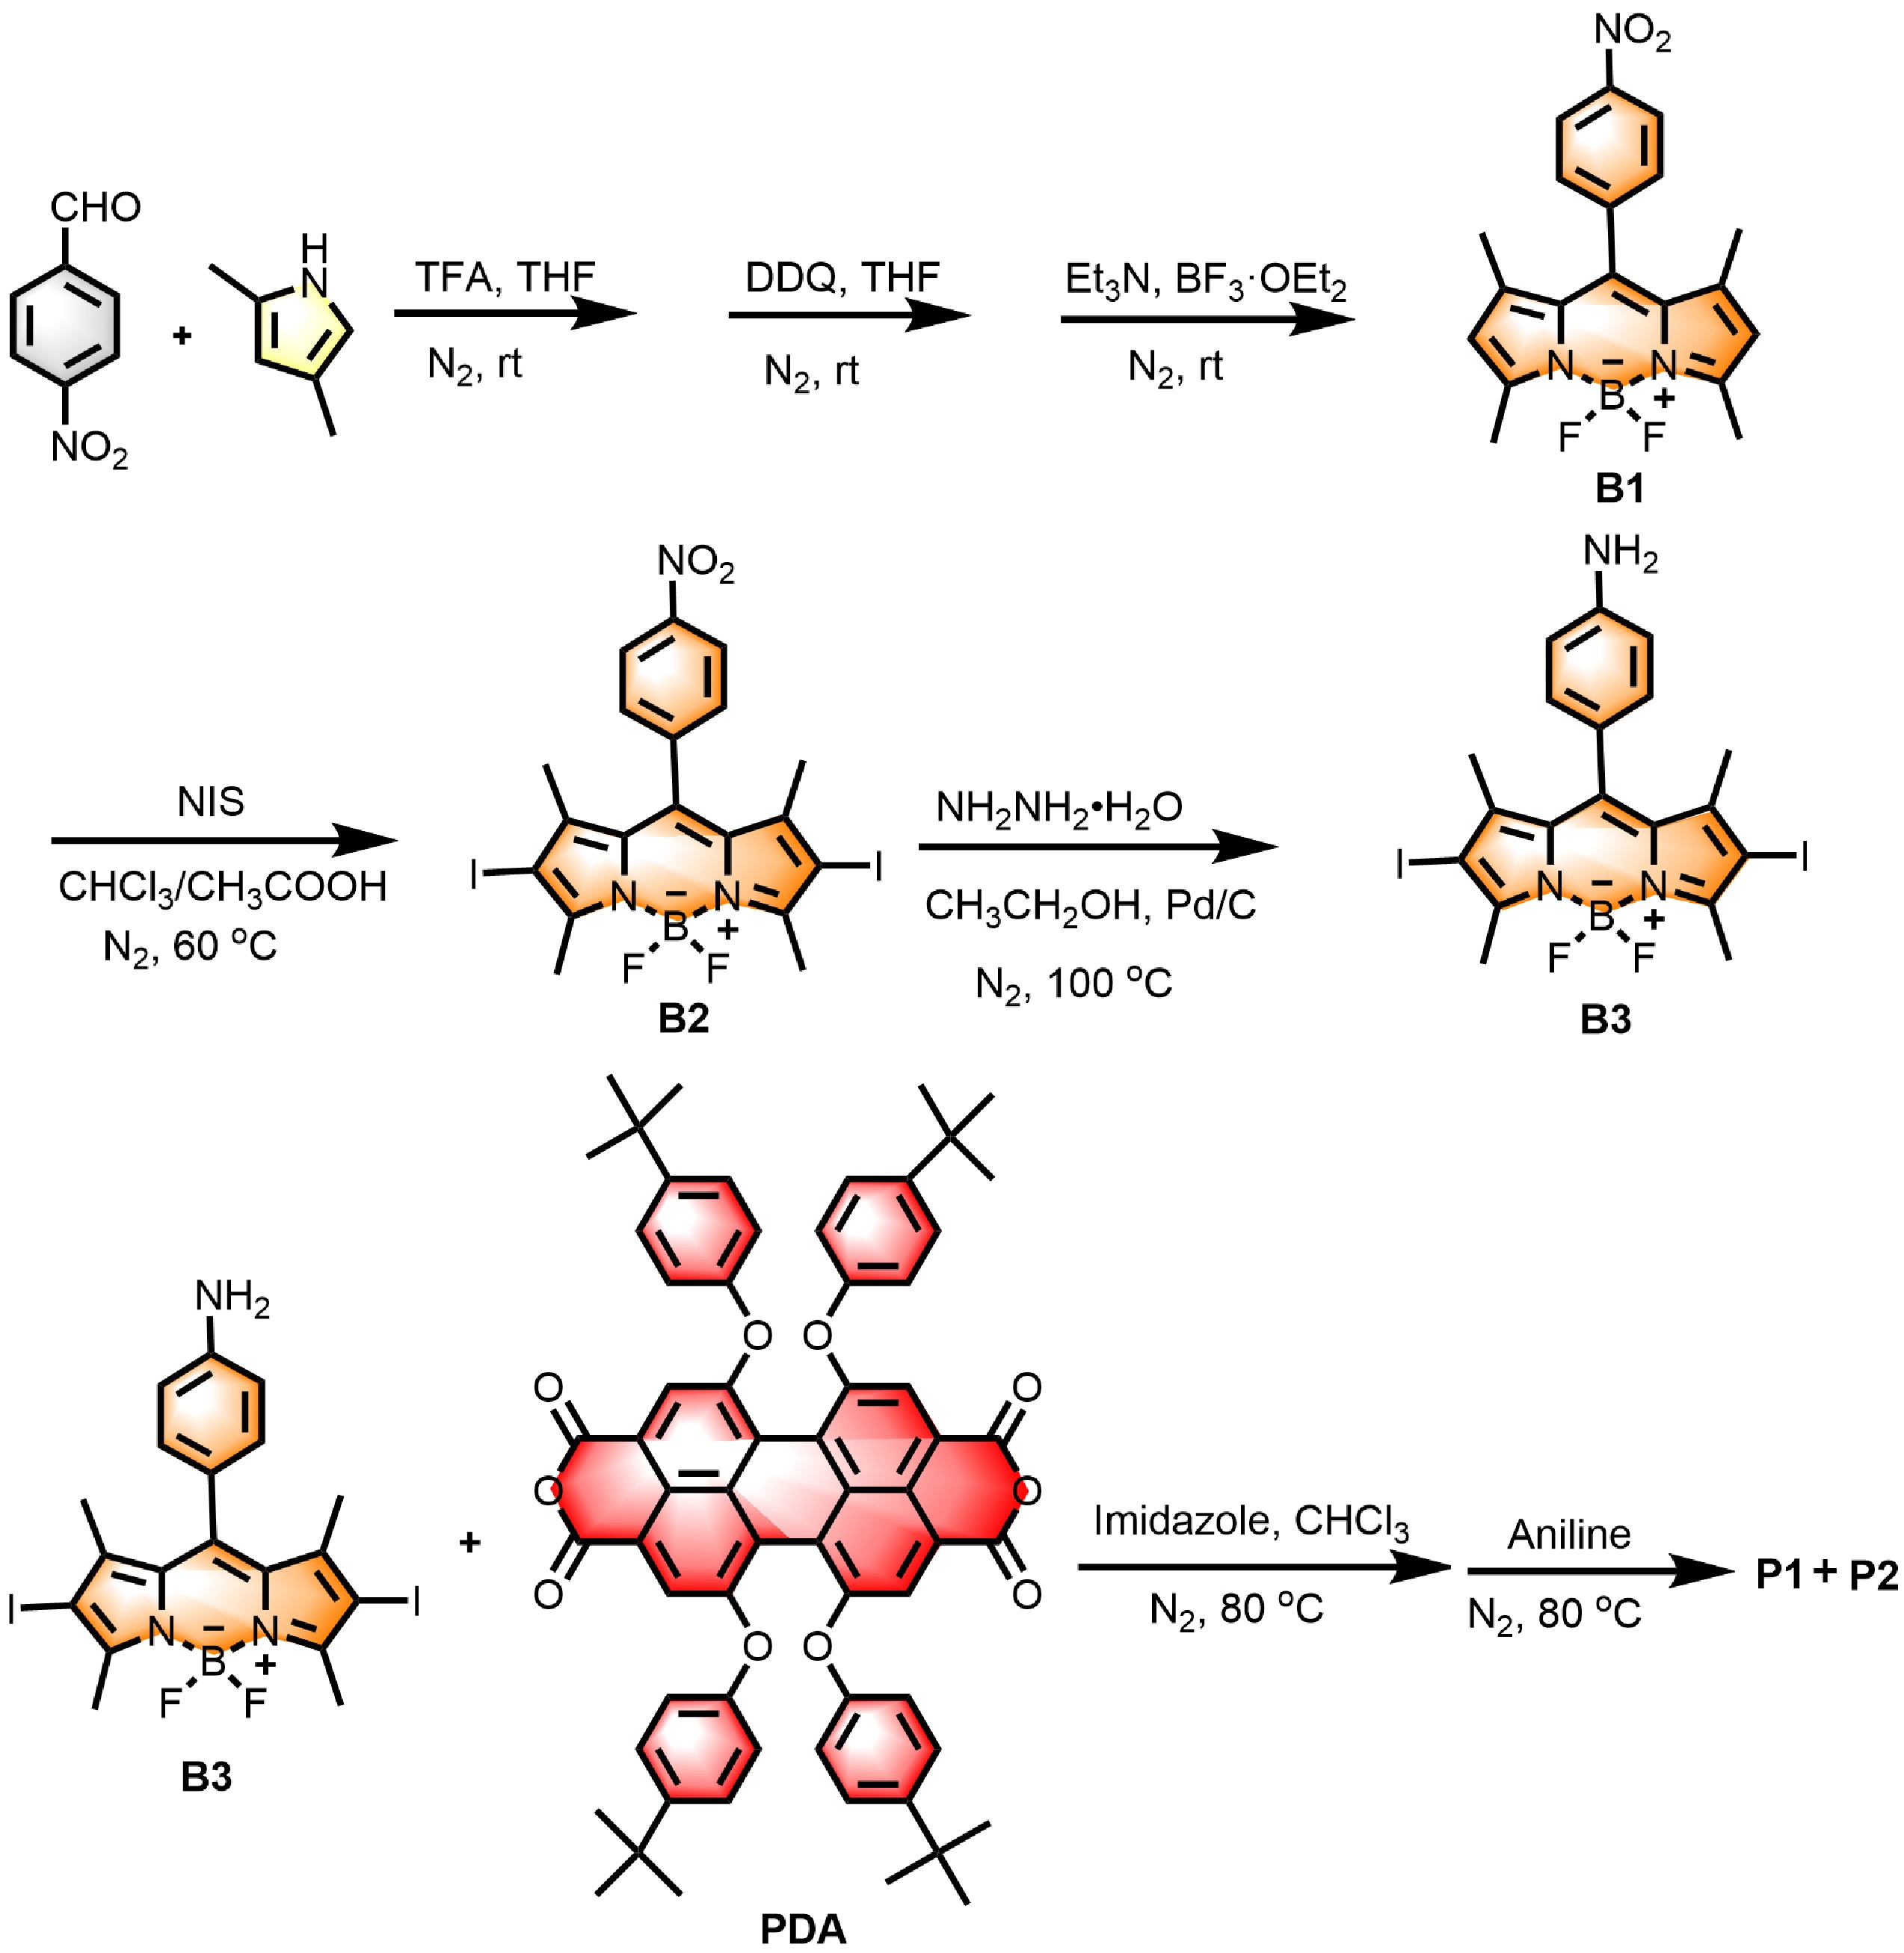
Figure 1. Synthetic route of compounds P1 and P2.
-

Figure 2. Expansions of the 1H NMR spectra for P1 (a) and P2 (b) in CDCl3.
-

Figure 3. (a) Steady-state absorption spectra of compounds B3, PDA, P1, and P2 in toluene. Fluorescence spectra of compounds B3, PDA, P1, and P2 in toluene excitation at (b) 489 nm, (c) 532 nm, and (d) 580 nm (c = 1.0×10⁻⁵ mol/L).
-
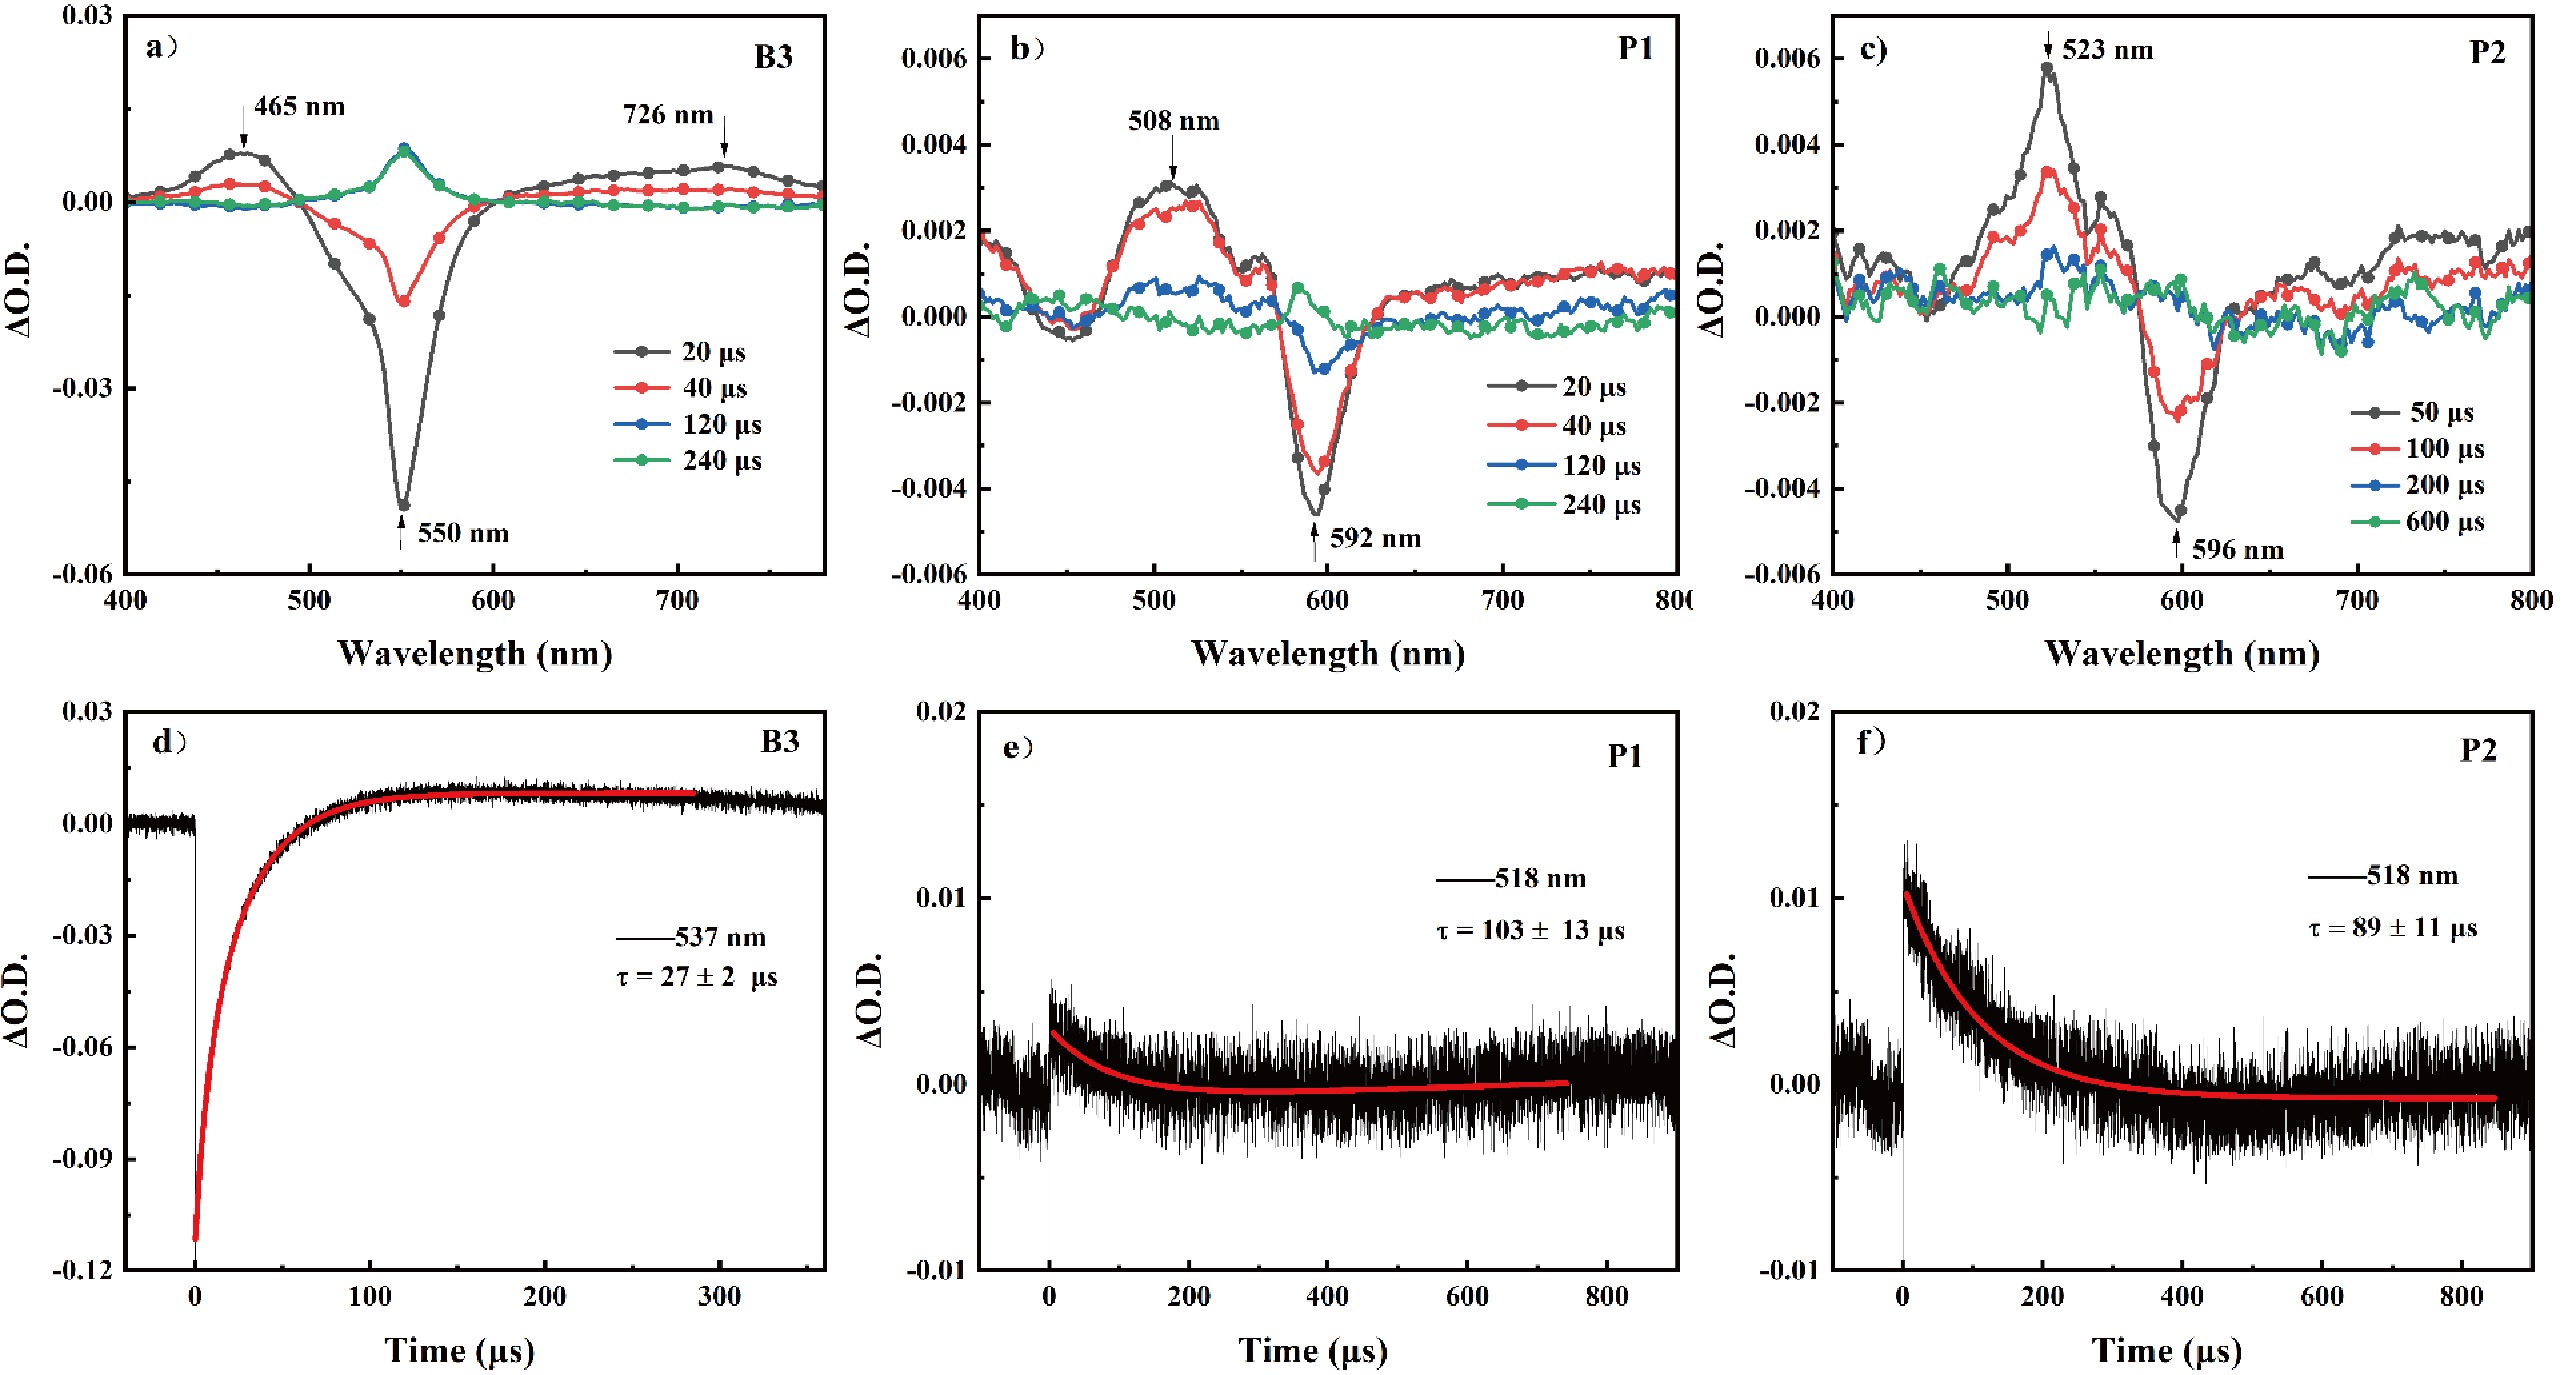
Figure 4. Nanosecond time-resolved transient absorption spectra of (a) B3, (b) P1, and (c) P2 upon 532 nm excitation with a pulsed laser (8 ns, 10 Hz) in deaerated toluene at room temperature. (d) Dynamic attenuation curve of B3 measured at 537 nm. Kinetic decay curves of (e) P1 and (f) P2 at 518 nm.
-
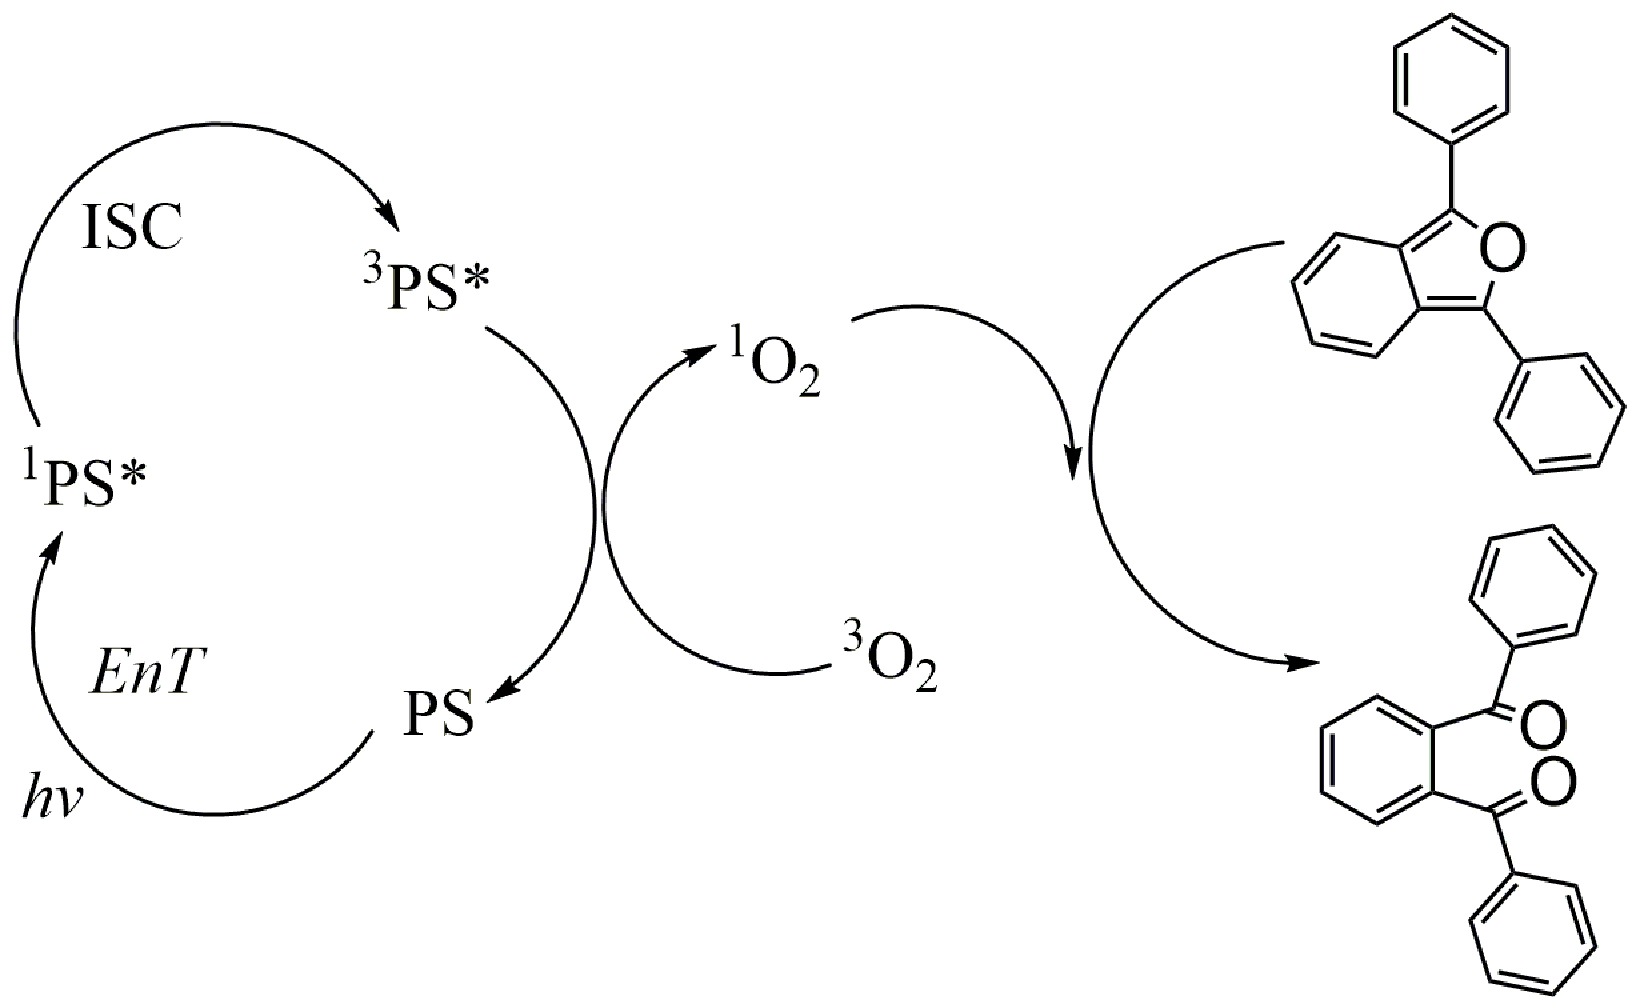
Figure 2. Mechanism for the photooxidation of DPBF (1,3-diphenylisobenzofuran) with a singlet oxygen PS.
-
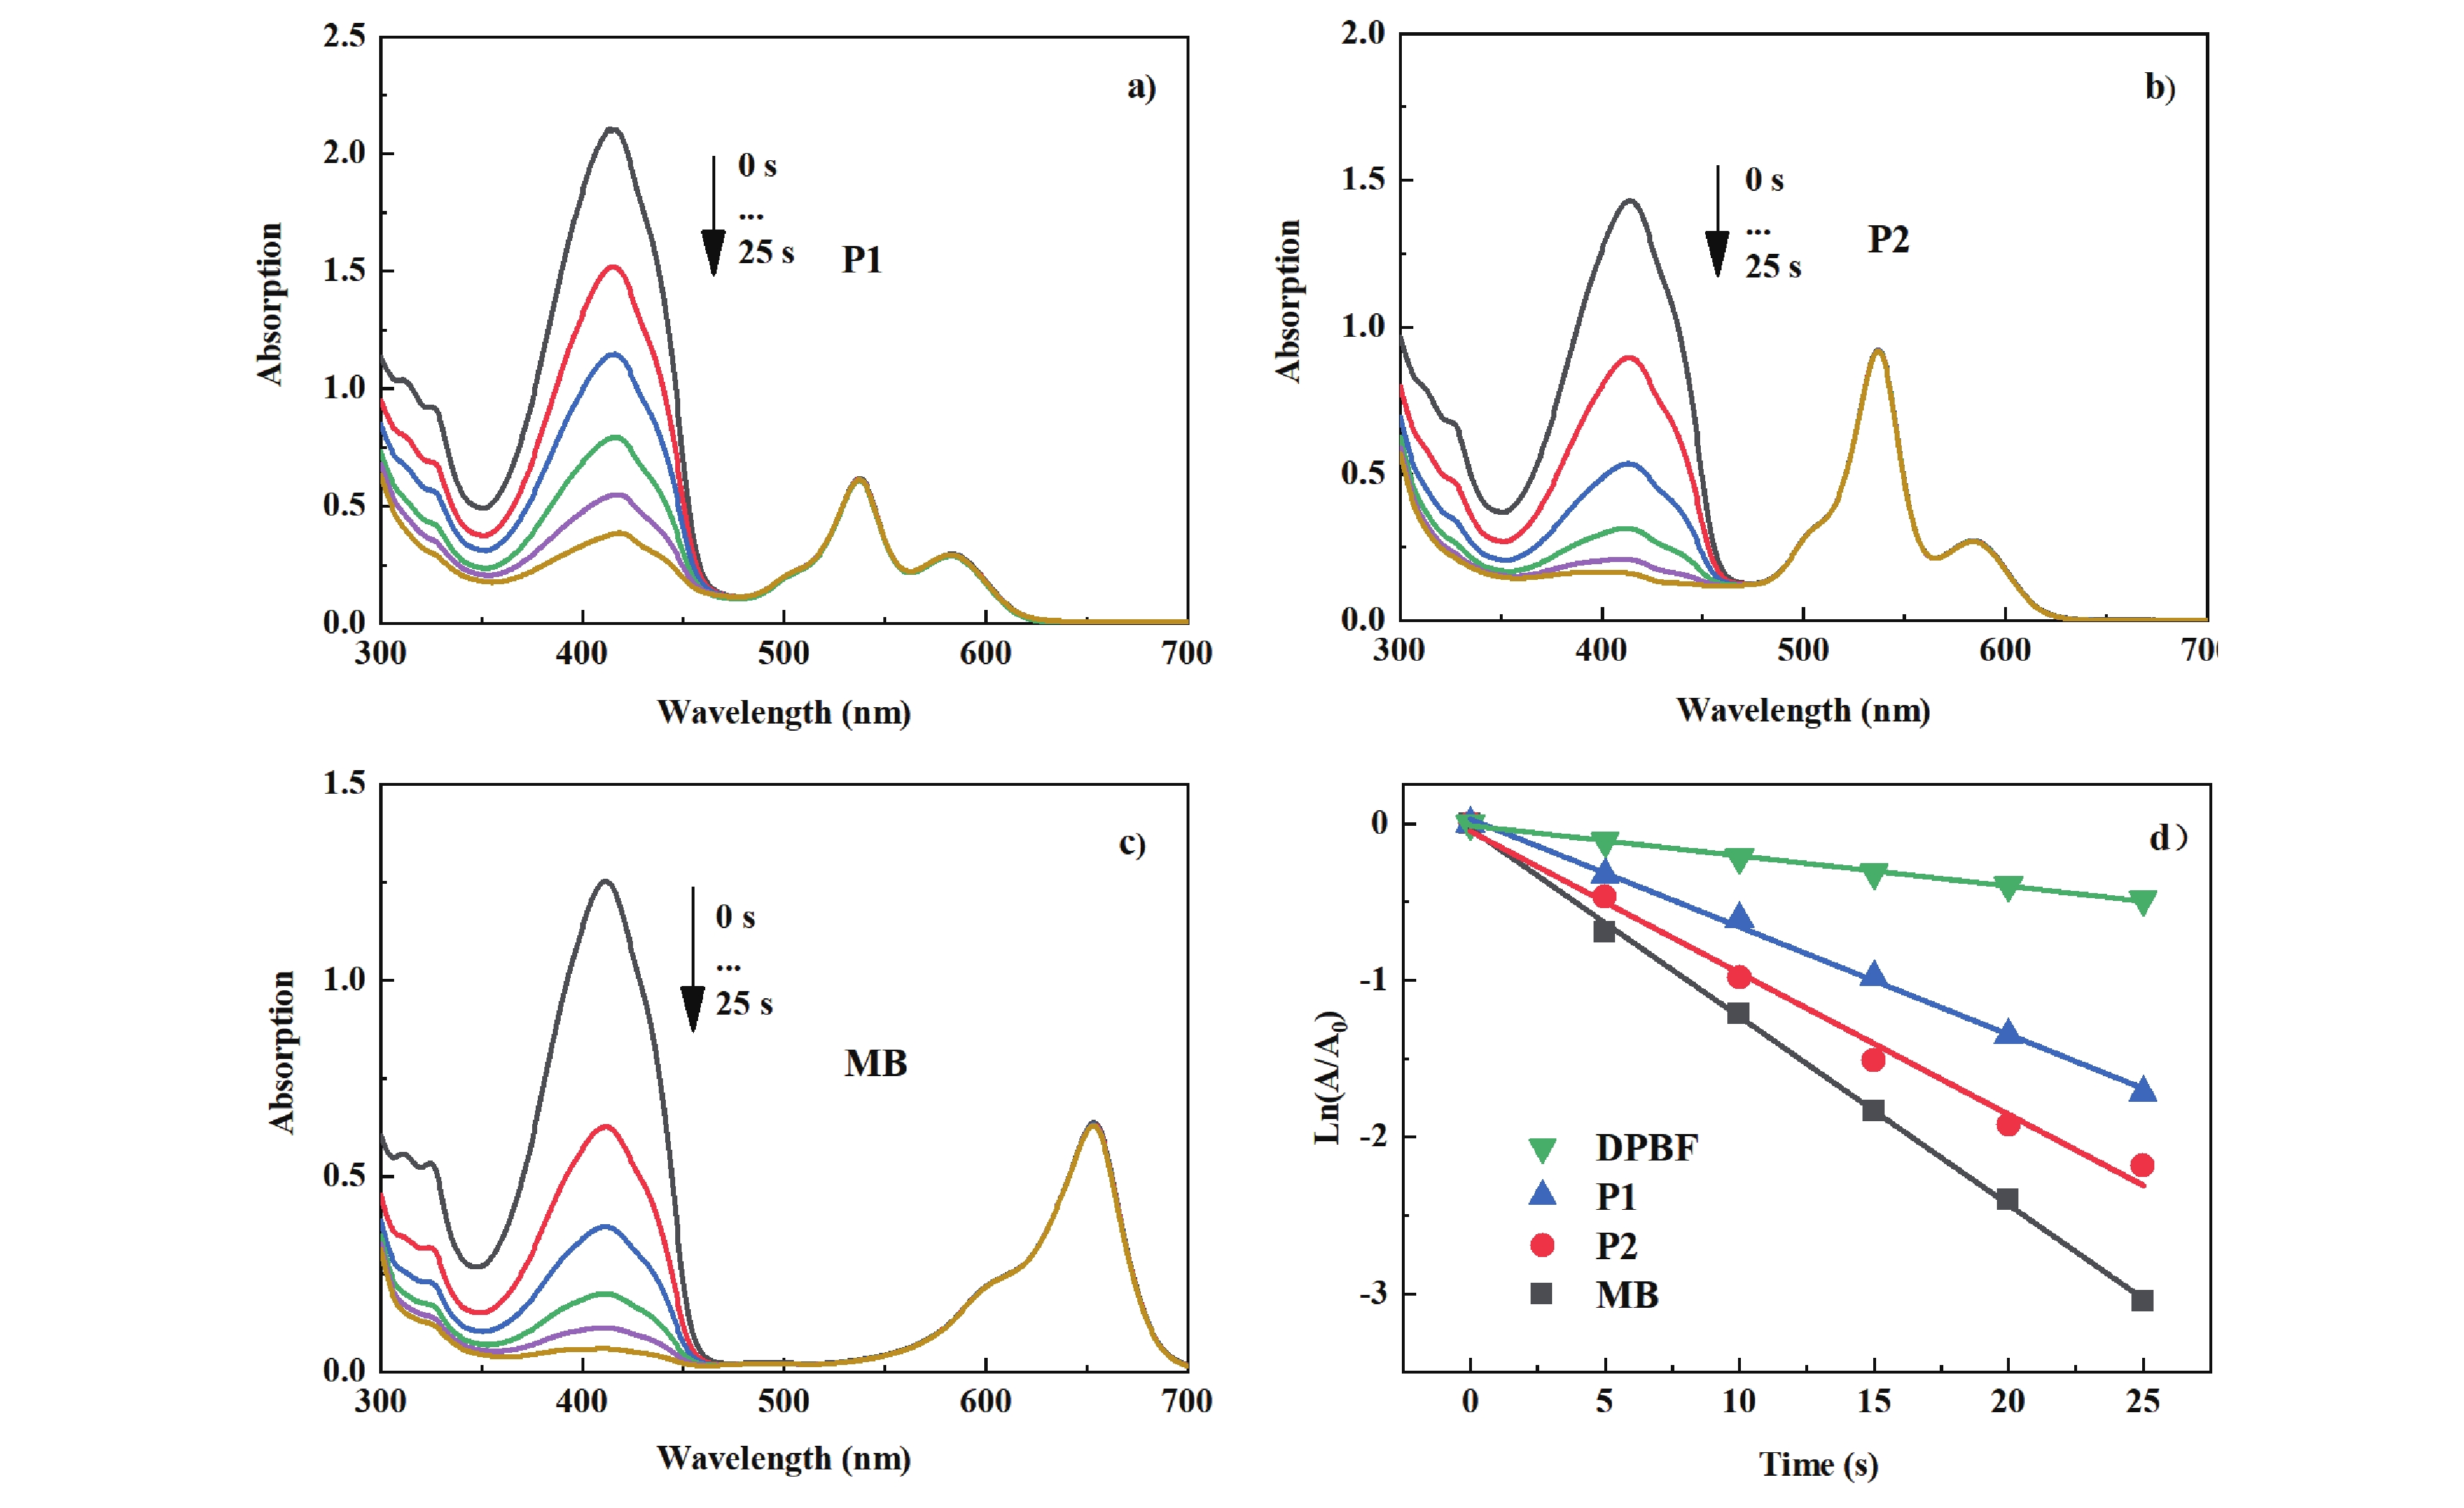
Figure 5. Absorption spectral evolution for the photooxidation of DPBF using (a) P1, (b) P2, and (c) methylene blue (MB) as photosensitizer for 0, 5, 10, 15, 20, 25 s. (d) Plots of ln(Ax/A0) vs. irradiation time (t) for the photooxidation of DPBF using different sensitizers (collected at 414 nm) in DCM/MeOH (9:1, v/v). c[sensitizers]=1.0 × 10⁻⁵ mol/L, c[DPBF] =1.0 × 10⁻⁴ mol/L.
-
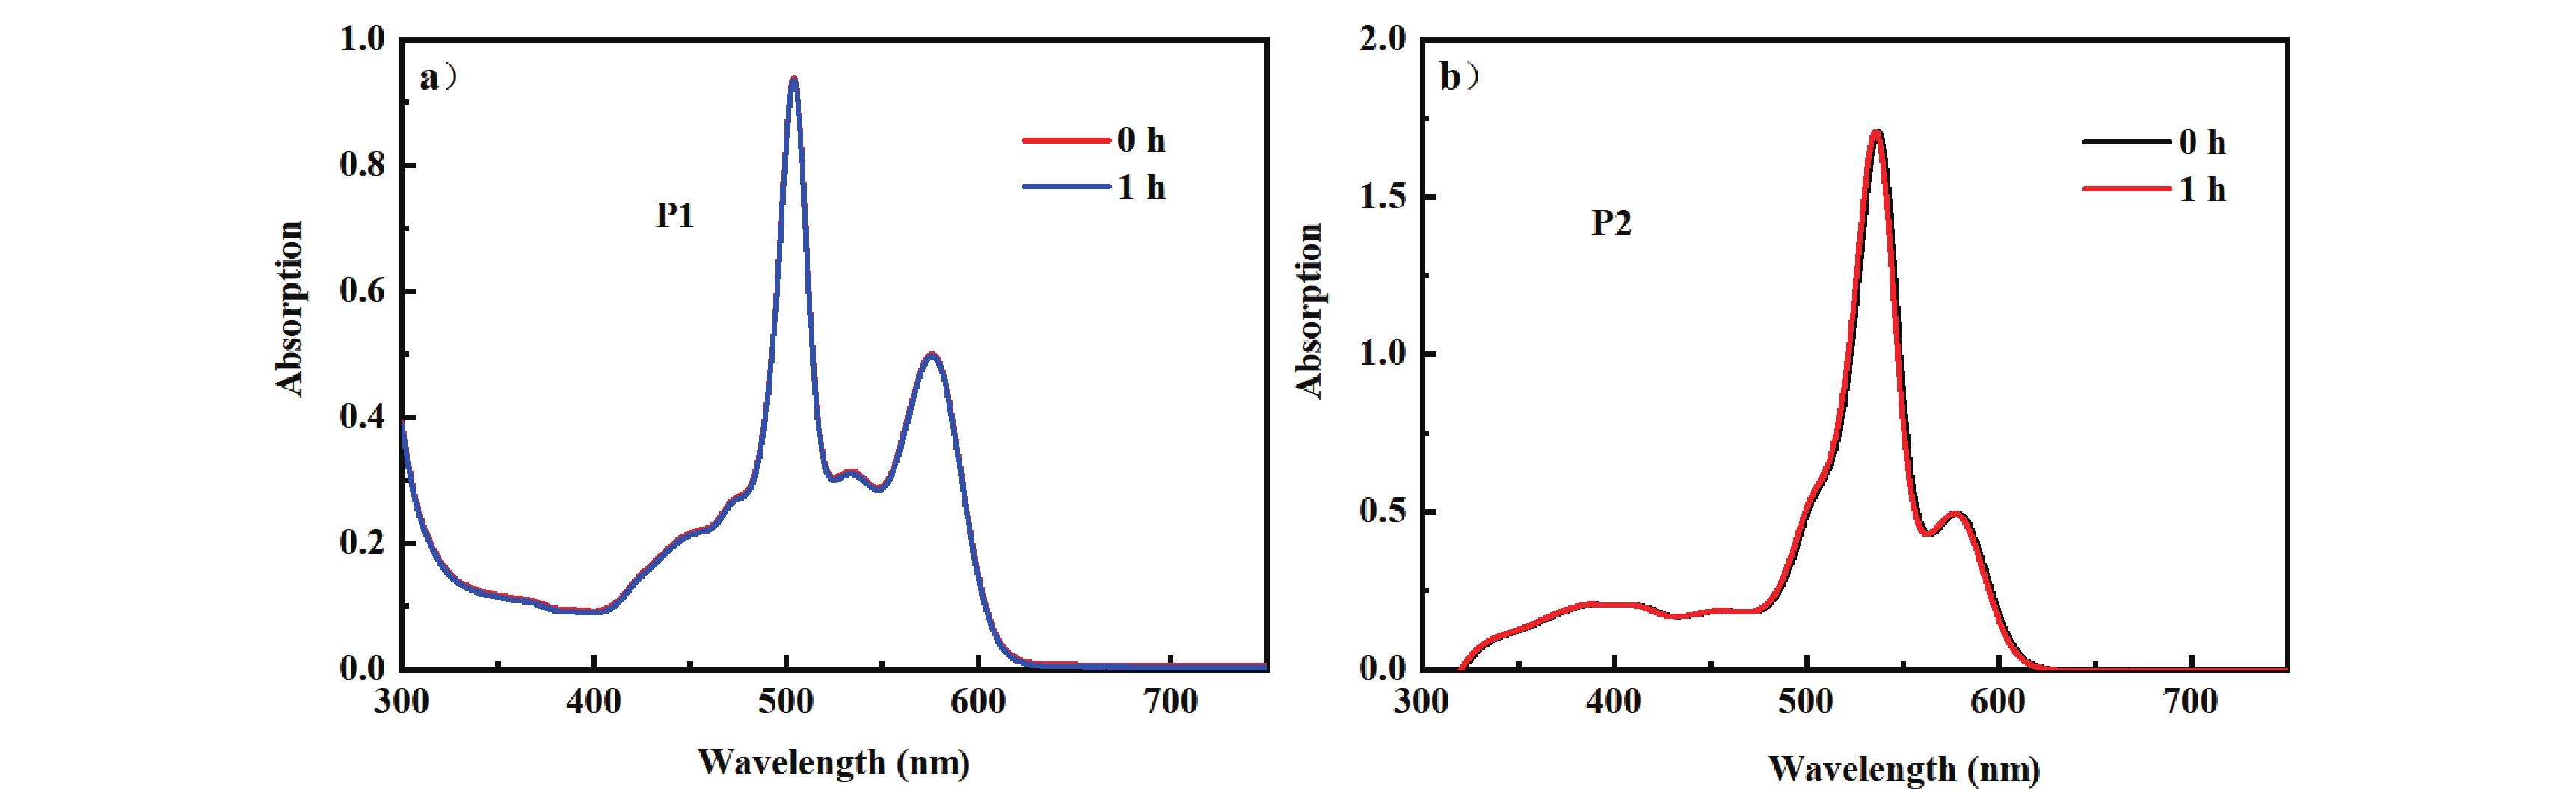
Figure 6. Steady-state absorption spectra of (a) P1 and (b) P2 after 1 h of exposure and illumination (dichloromethane/methanol, v/v = 9:1; c=1.0 × 10⁻⁵ mol/L).
Figure
8 ,Table
1 个