-
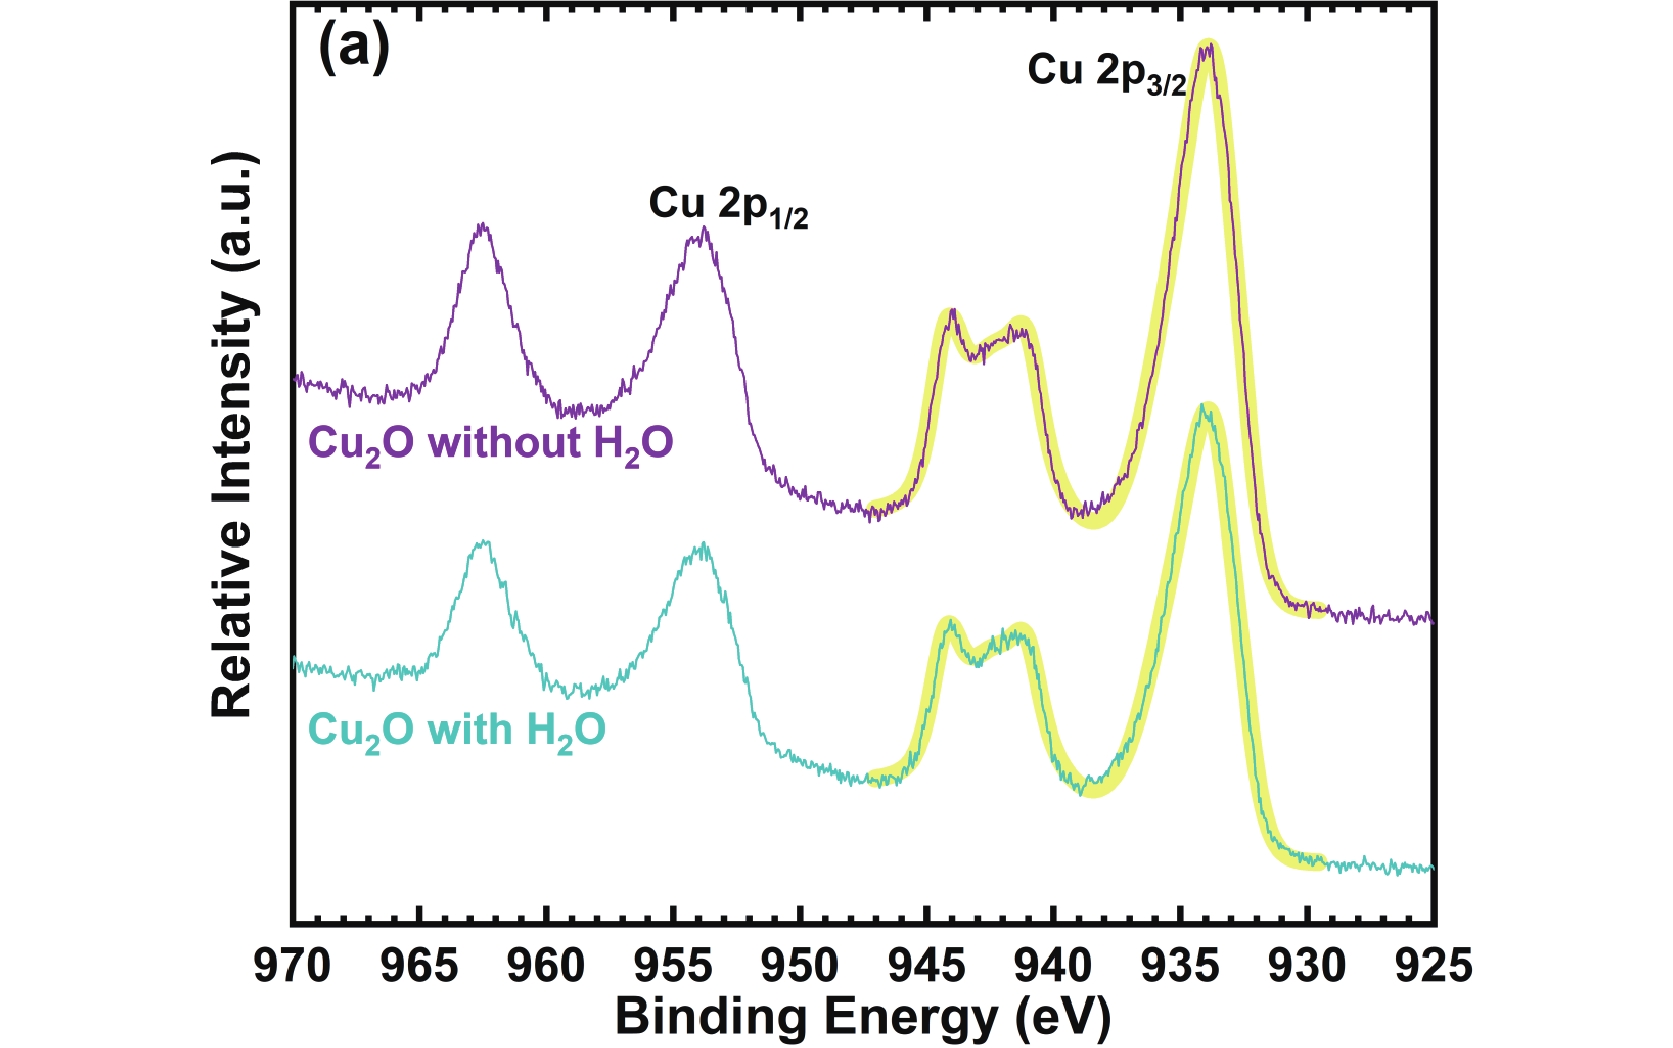
Figure 5. XPS spectra of (a) Cu 2p and (b) O 1s for Cu2O thin films. Thin lines display the measured data. Thick yellow lines show multi-peak fit curves according to Ref.[2], which are given as a guide to the eye. Figure adapted with permission from Ref.[1], copyright©2009 Elsevier.
Figure
1 ,Table
0 个