-
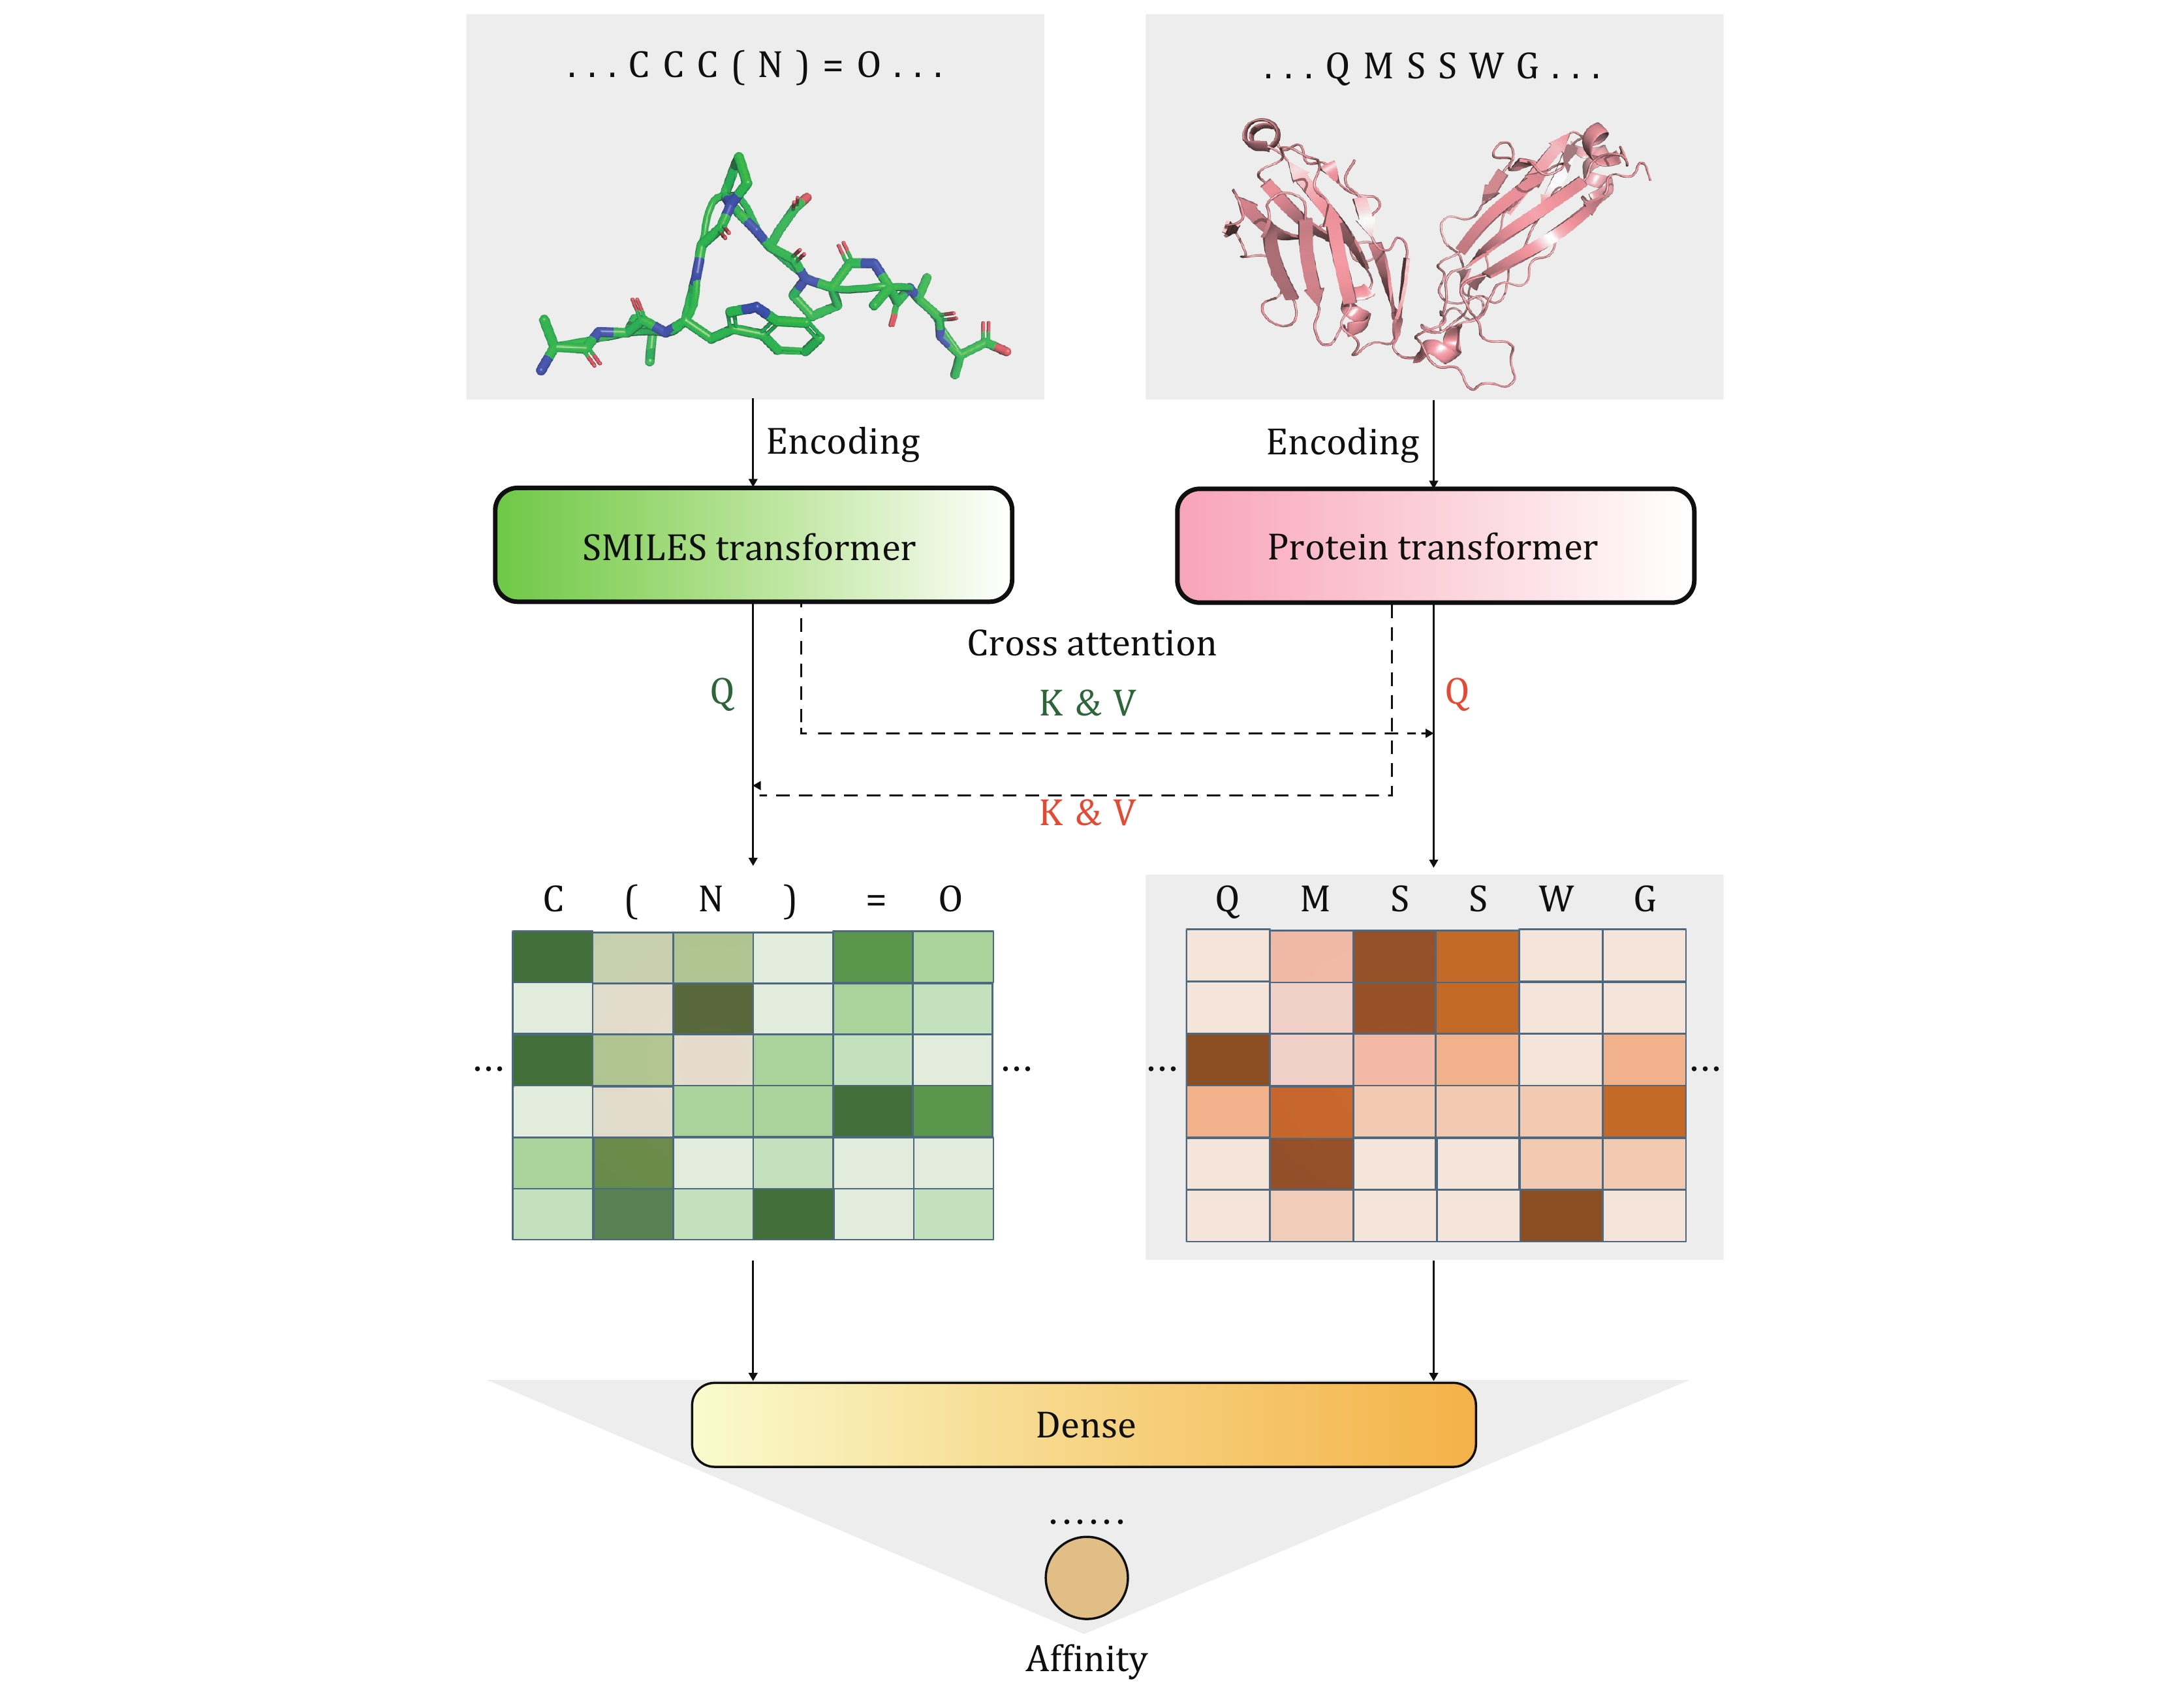
Figure 1. APTAnet architecture. APTAnet consists of three main components: the encoding module, the cross-attention module, and the fully connected module. It begins by embedding the peptide and TCR sequences separately using the encoding module. Then, it allows interaction between the encoded vectors using cross-attention, and finally, the fully connected module extracts relationships between the features to predict the affinity score
-
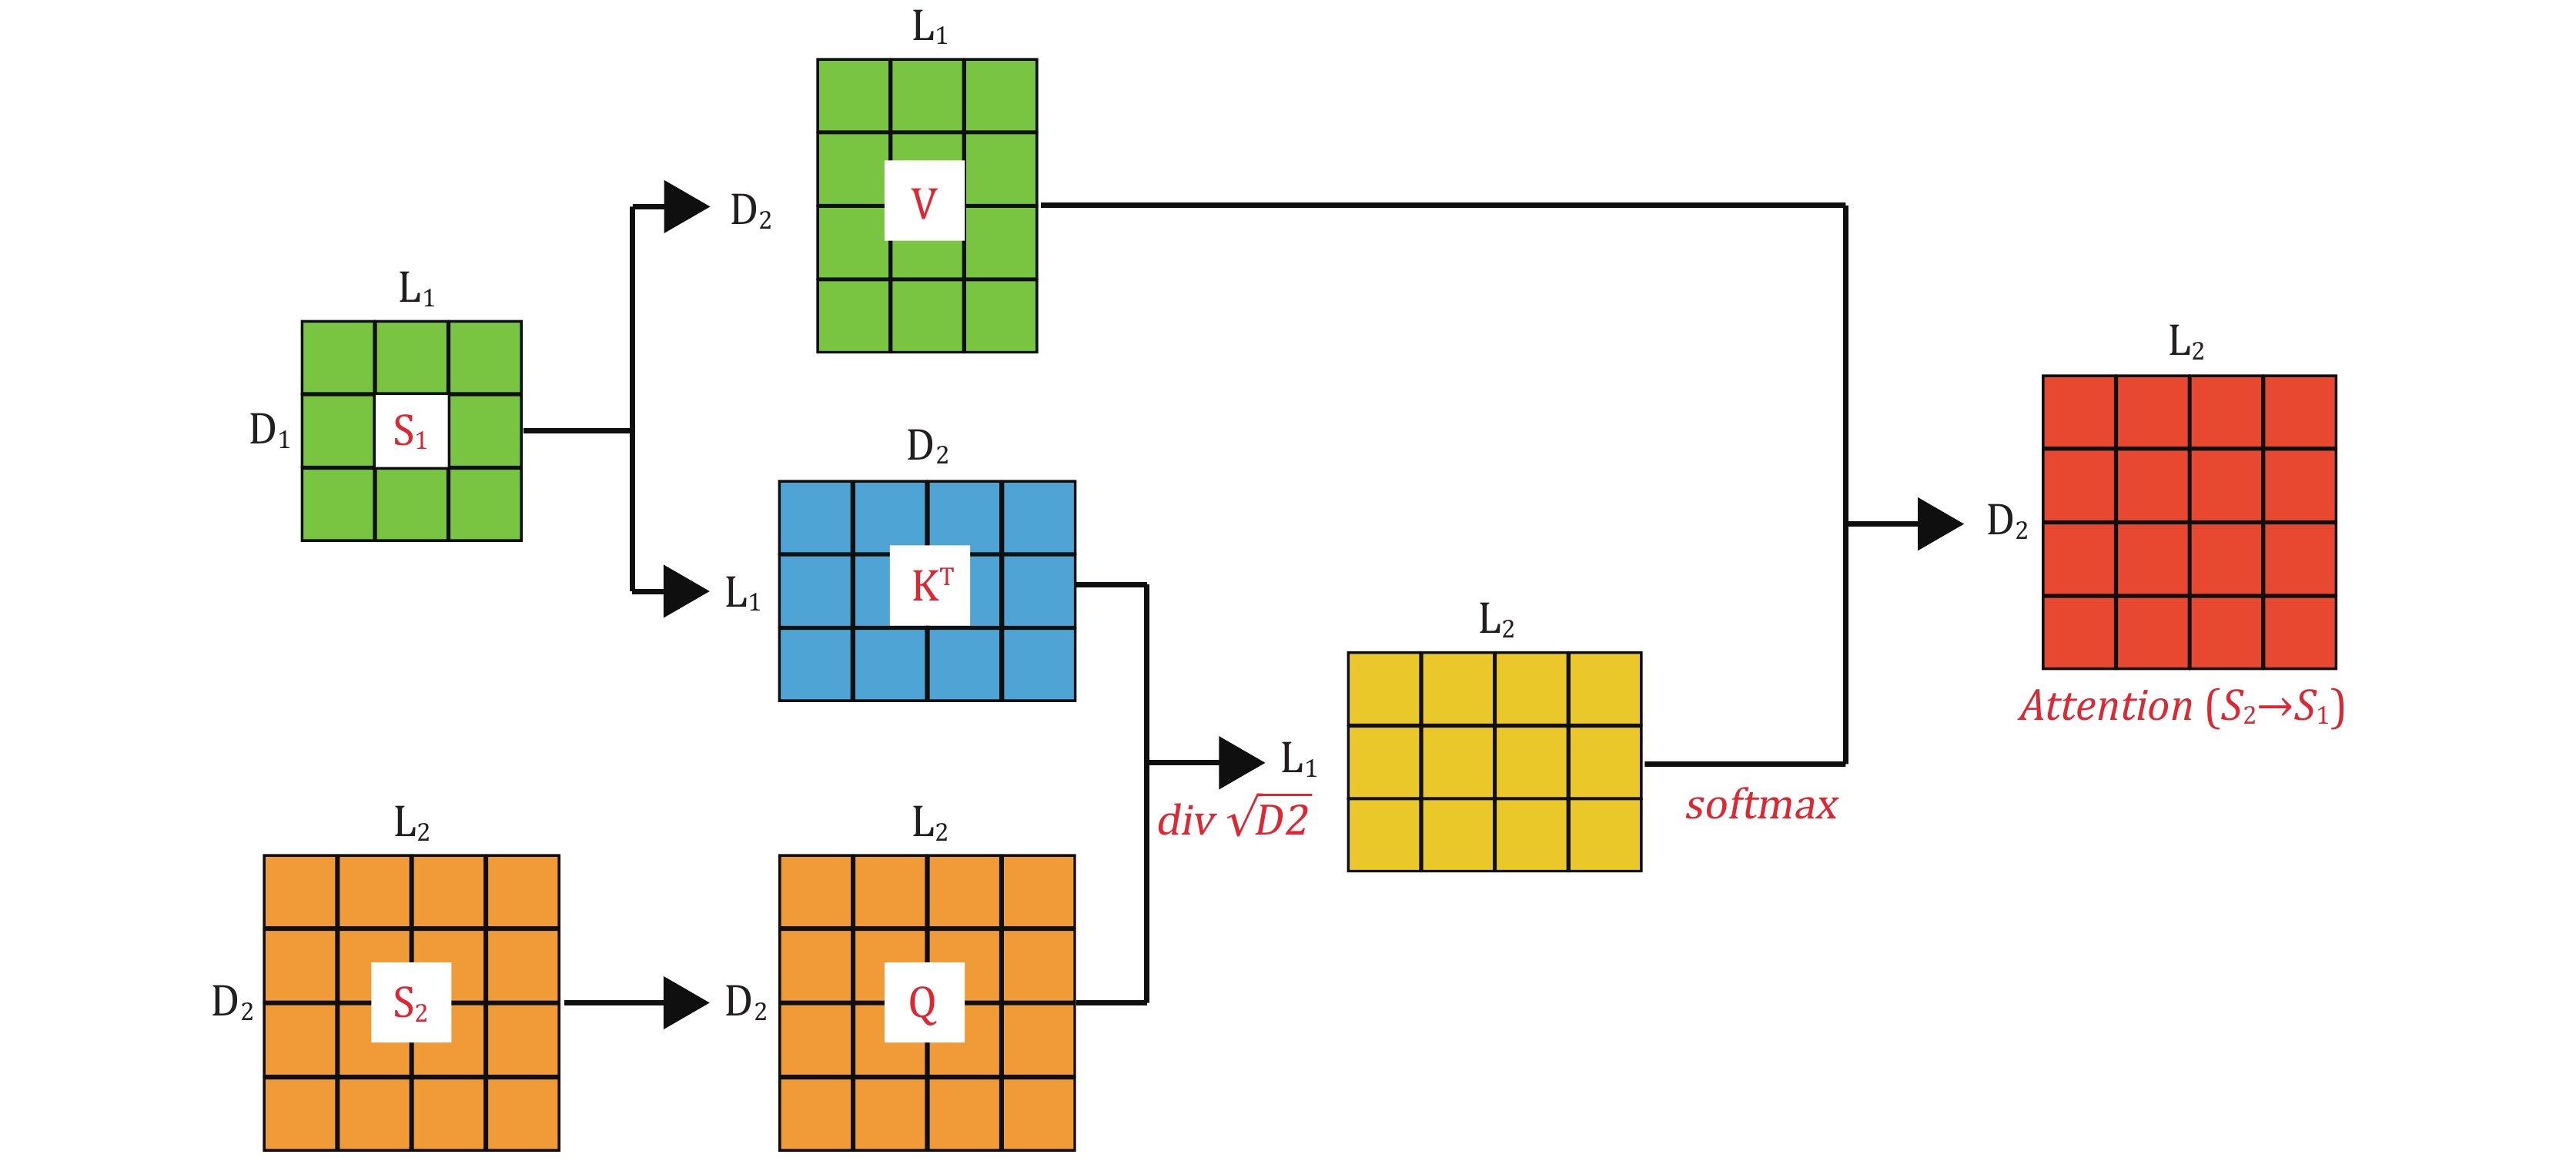
Figure 2. Cross-Attention involves two input matrices,
$ {S}_{1} $ and$ {S}_{2} $ , which have different dimensions. It is necessary to project Q, K, and V to different attention spaces using distinct projection matrices$ {W}_{Q} $ ,$ {W}_{K} $ , and$ {W}_{V} $ . Afterward, attention weights are calculated through dot-product operations and softmax activation functions. The final output matrix has the same dimensions as the receptor matrix$ {S}_{2} $ -
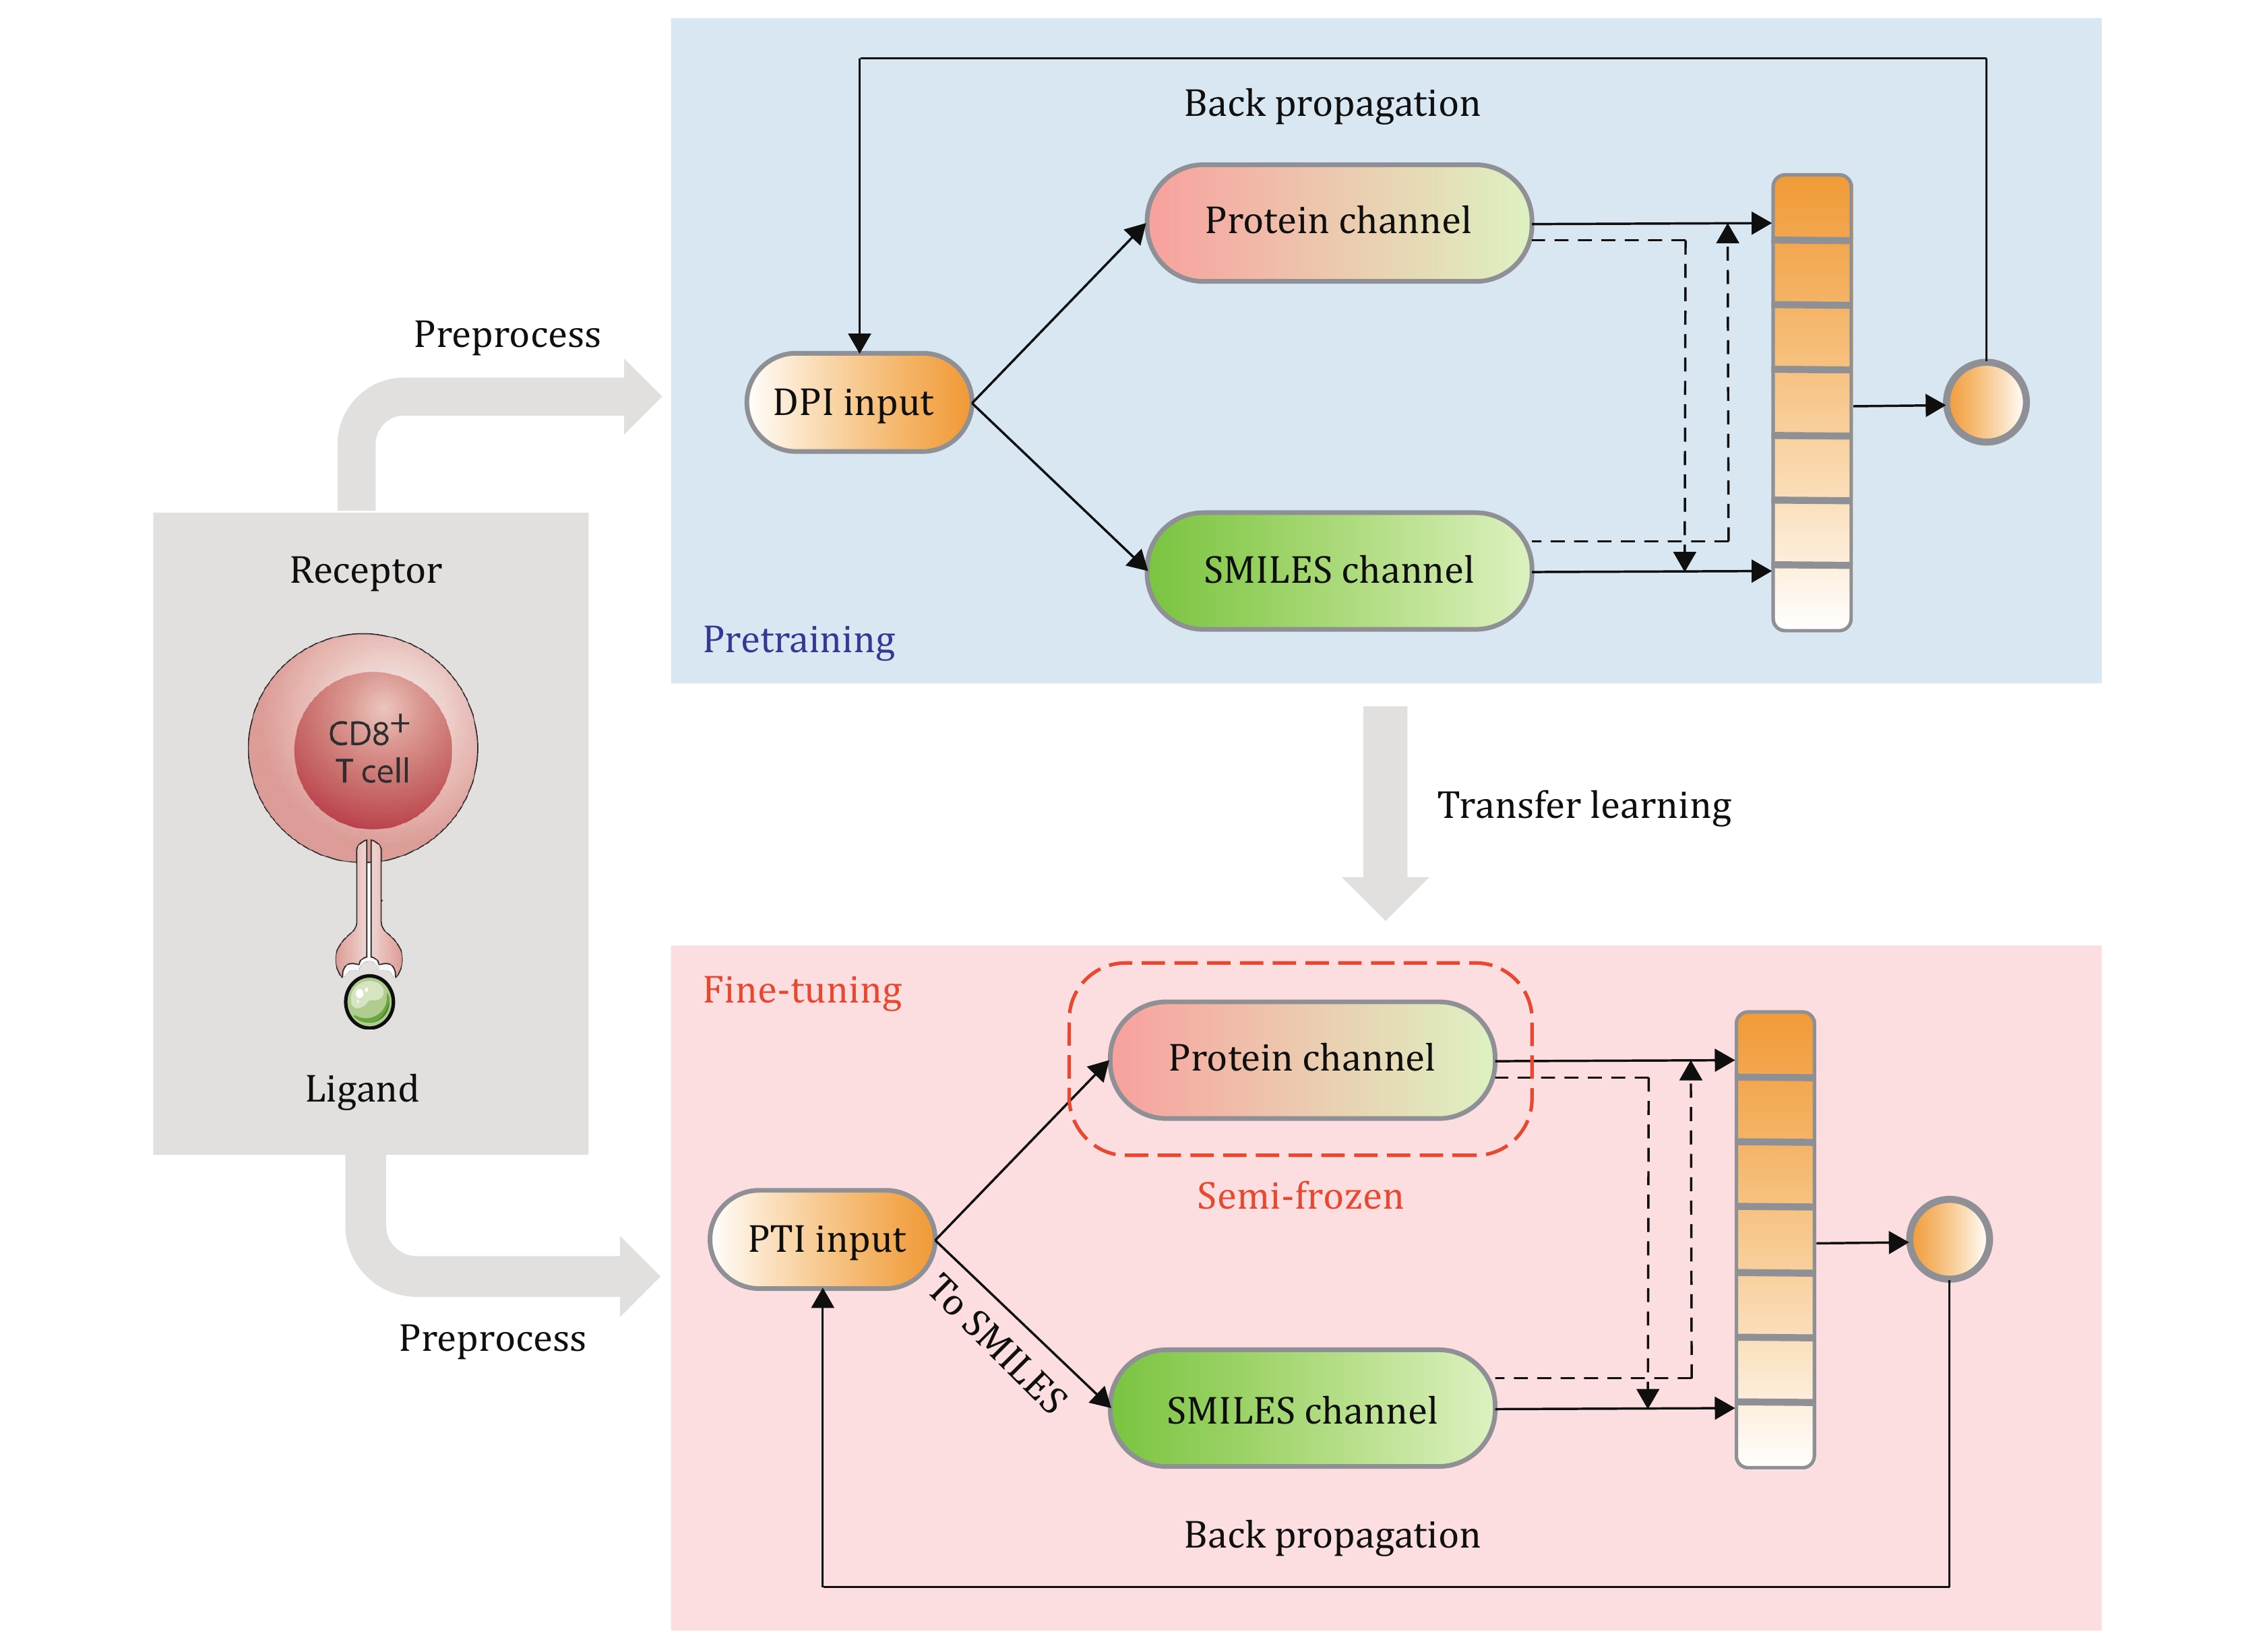
Figure 3. APTAnet architecture. The training process of the APTAnet model is divided into two stages: pre-training and fine-tuning. In the pre-training stage, affinity data between drugs and proteins from the DPI dataset are used to learn a broad range of ligand-receptor interactions. In the fine-tuning stage, the model is fine-tuned using PTI data
-
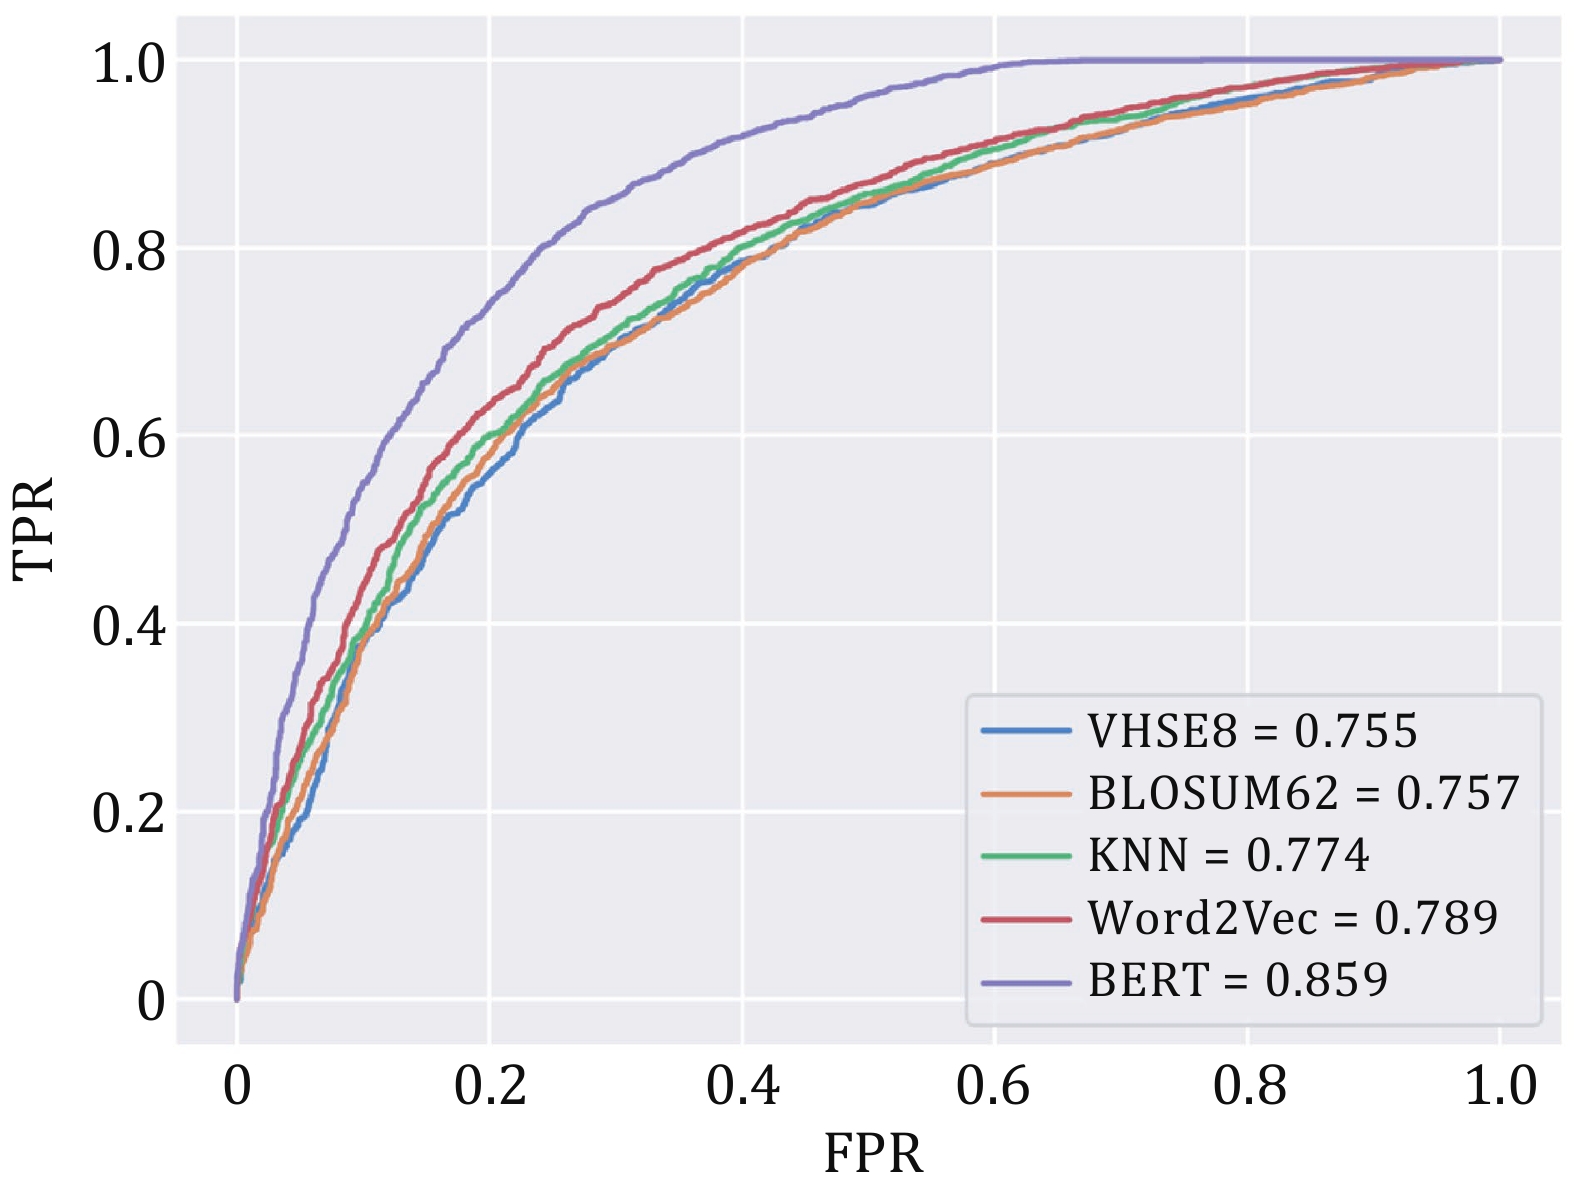
Figure 4. ROC curves for different encoding methods
-
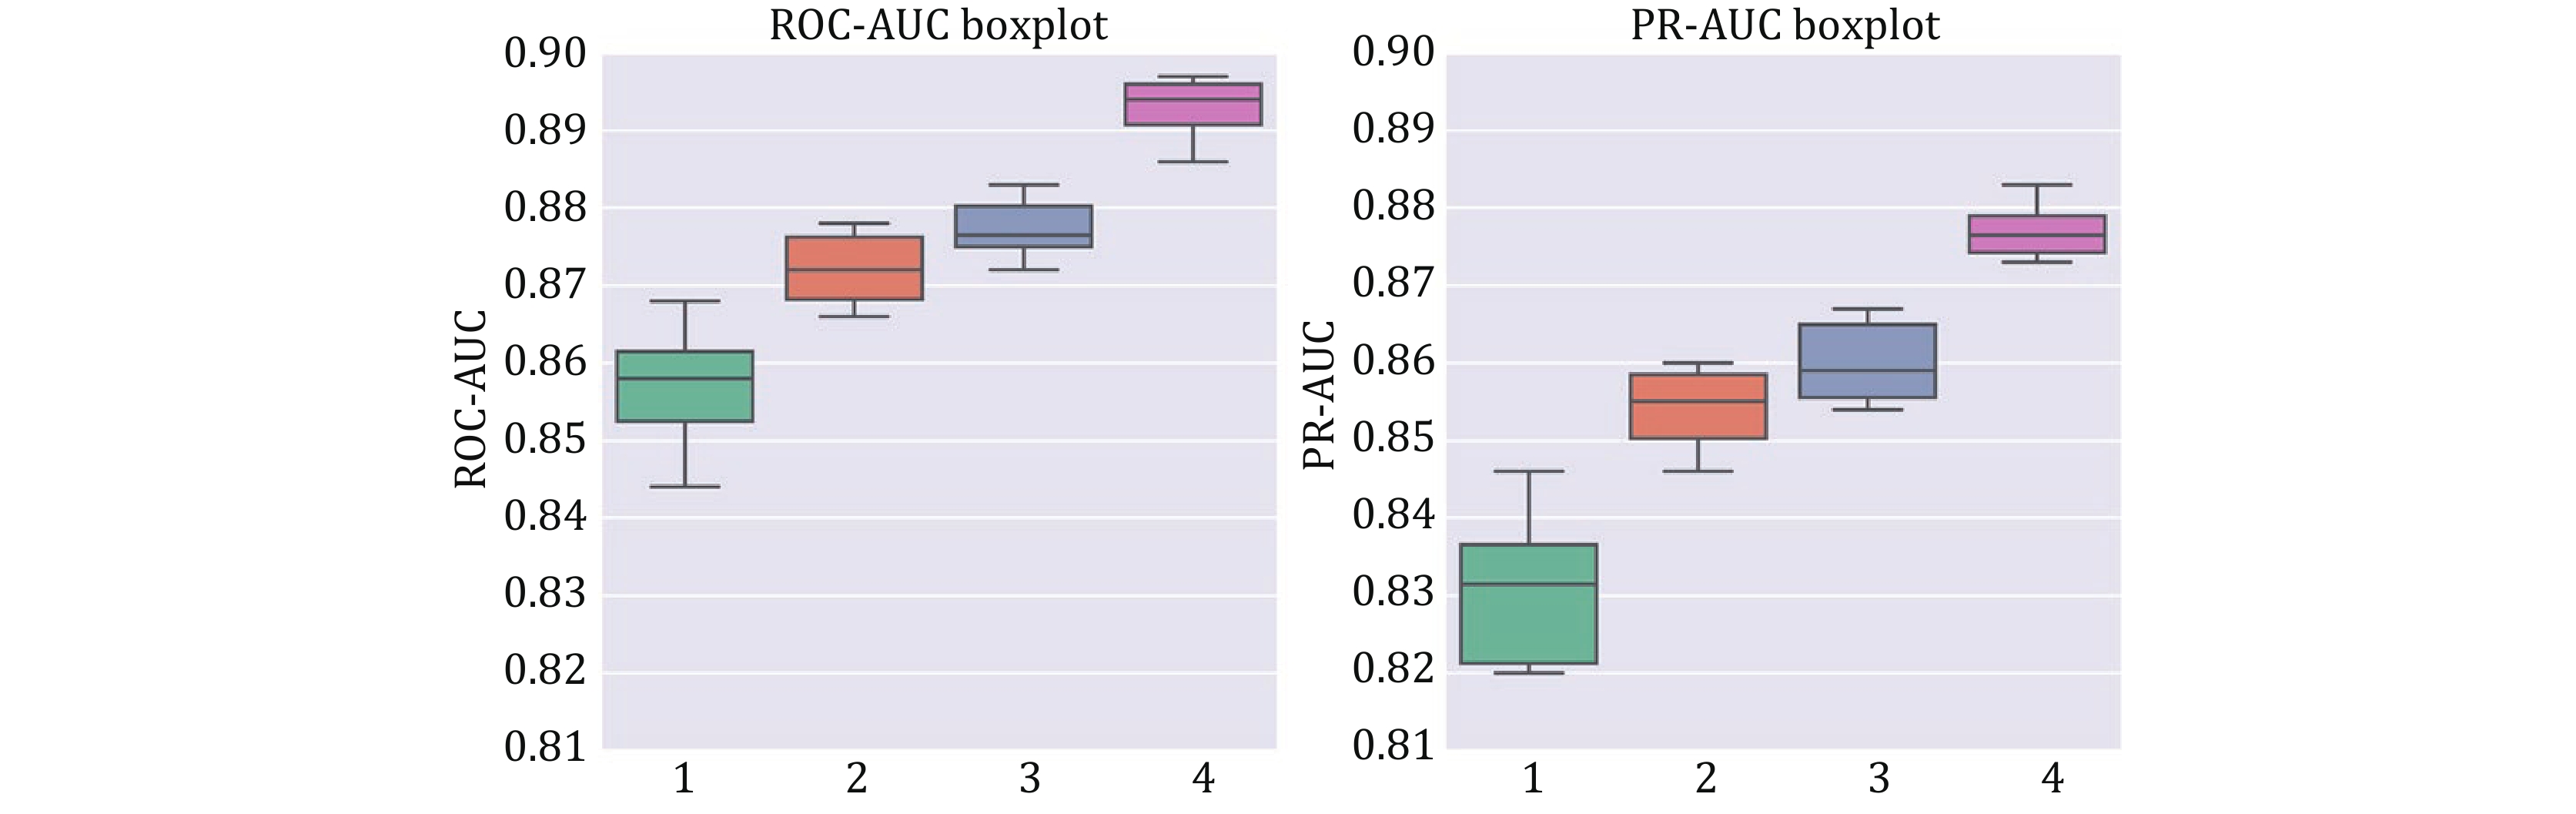
Figure 5. Box plots of ten-fold cross-validation ROC-AUC (left) and PR-AUC (right) for different training modes. Group 1 is APTAnet without pre-training, Group 2 is APTAnet + Pretrain, Group 3 is APTAnet + Pretrain + Semifrozen, and Group 4 is APTAnet + Pretrain + Semifrozen + Augmentation
-
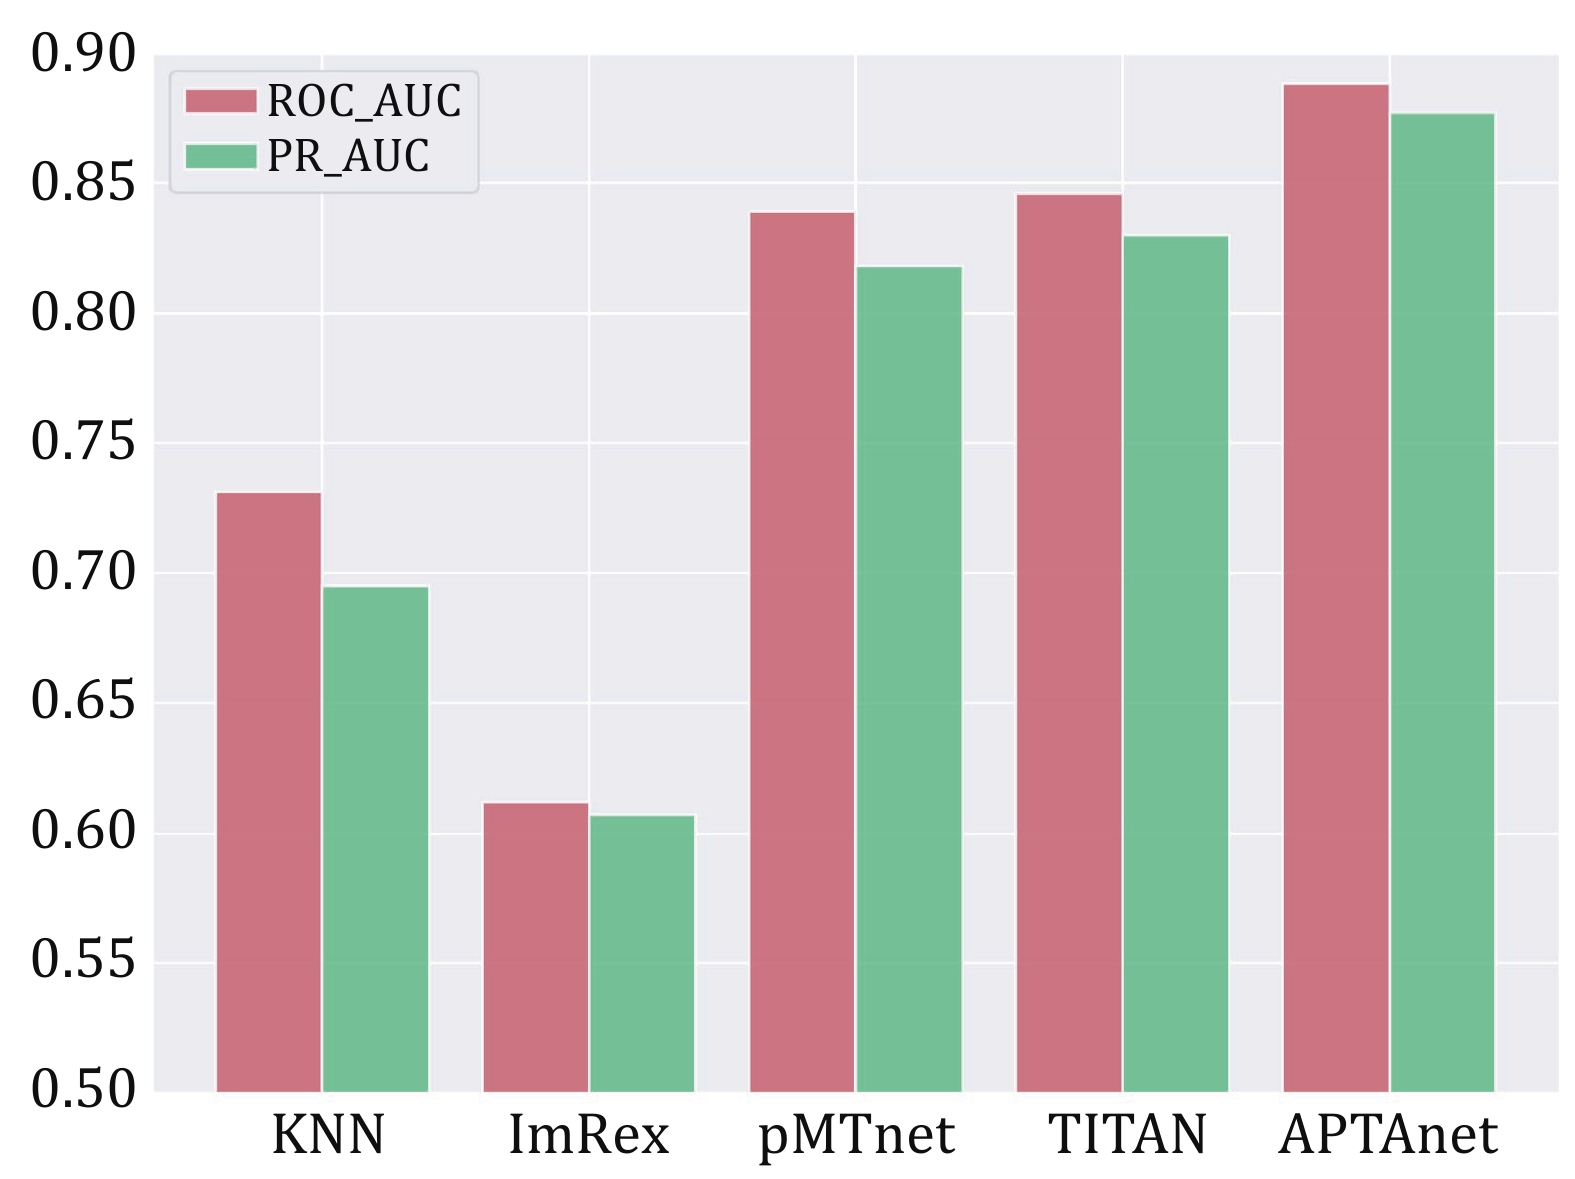
Figure 6. Performance comparison of multiple tools in the SP test set. The bars display the values of ROC-AUC (red) and PR-AUC (green) in different models
-
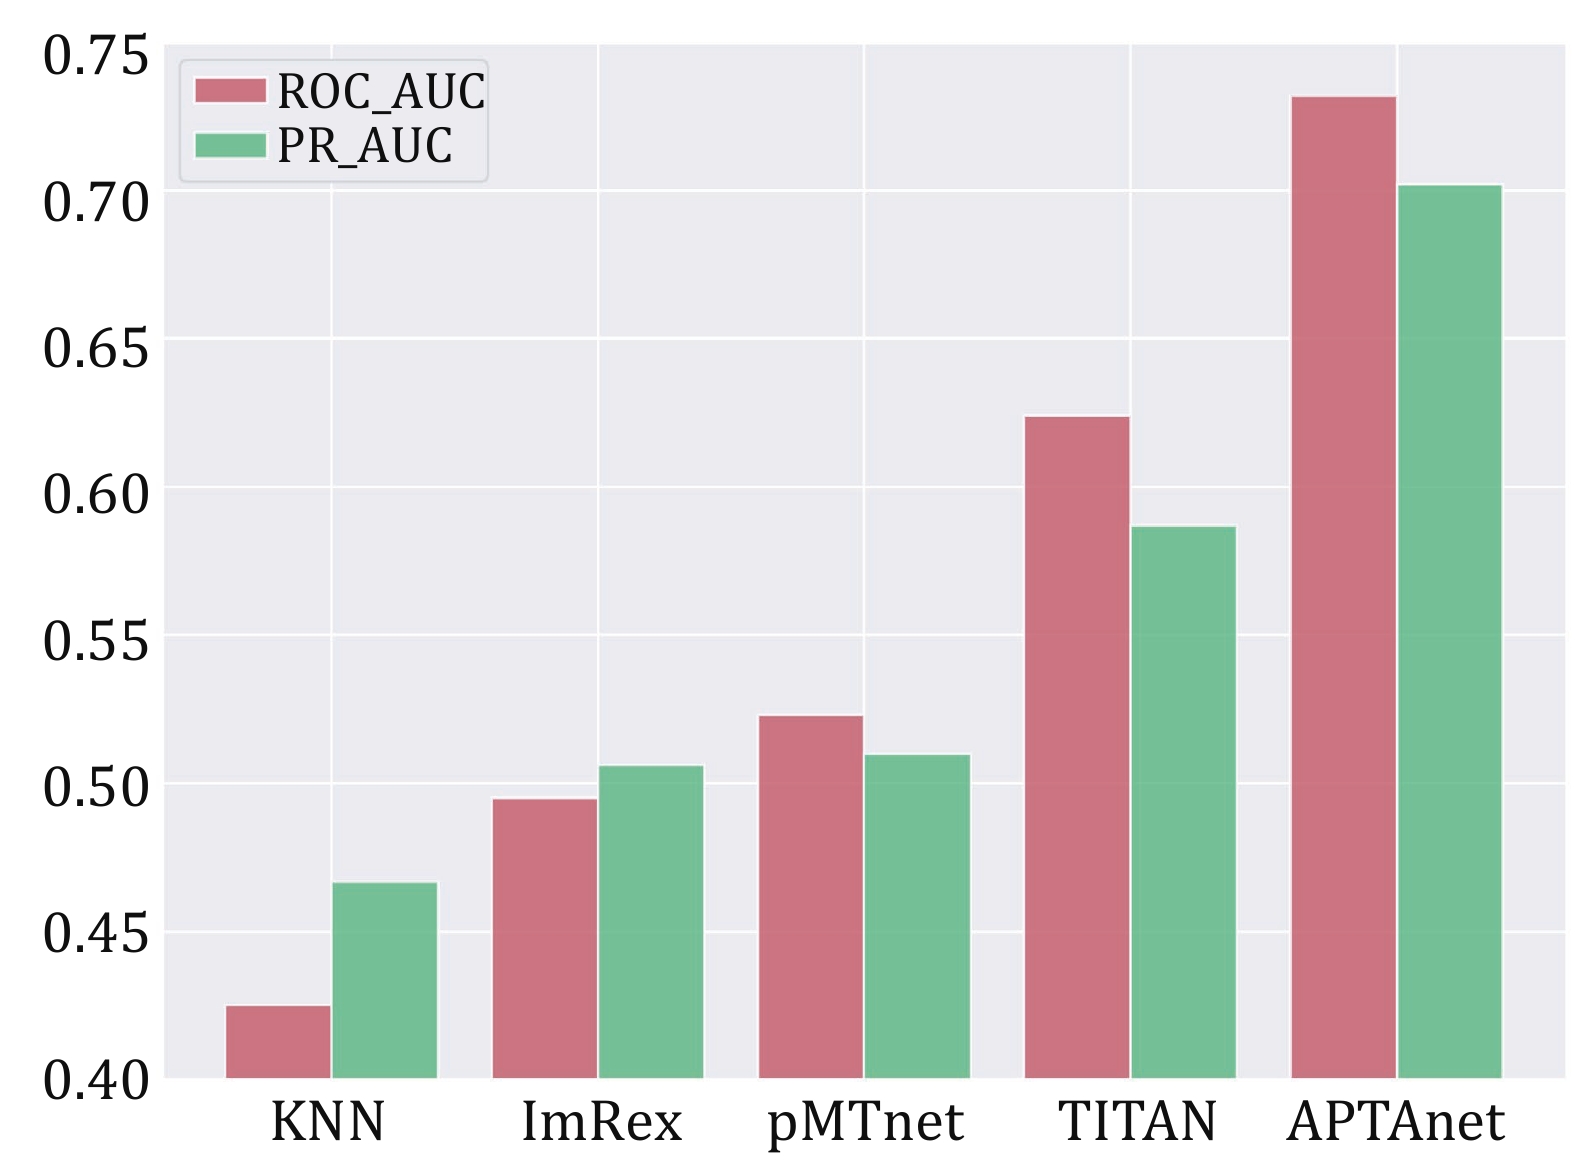
Figure 7. Performance comparison of multiple tools in the UP test set. The bars display the values of ROC-AUC (red) and PR-AUC (green) in different models
-
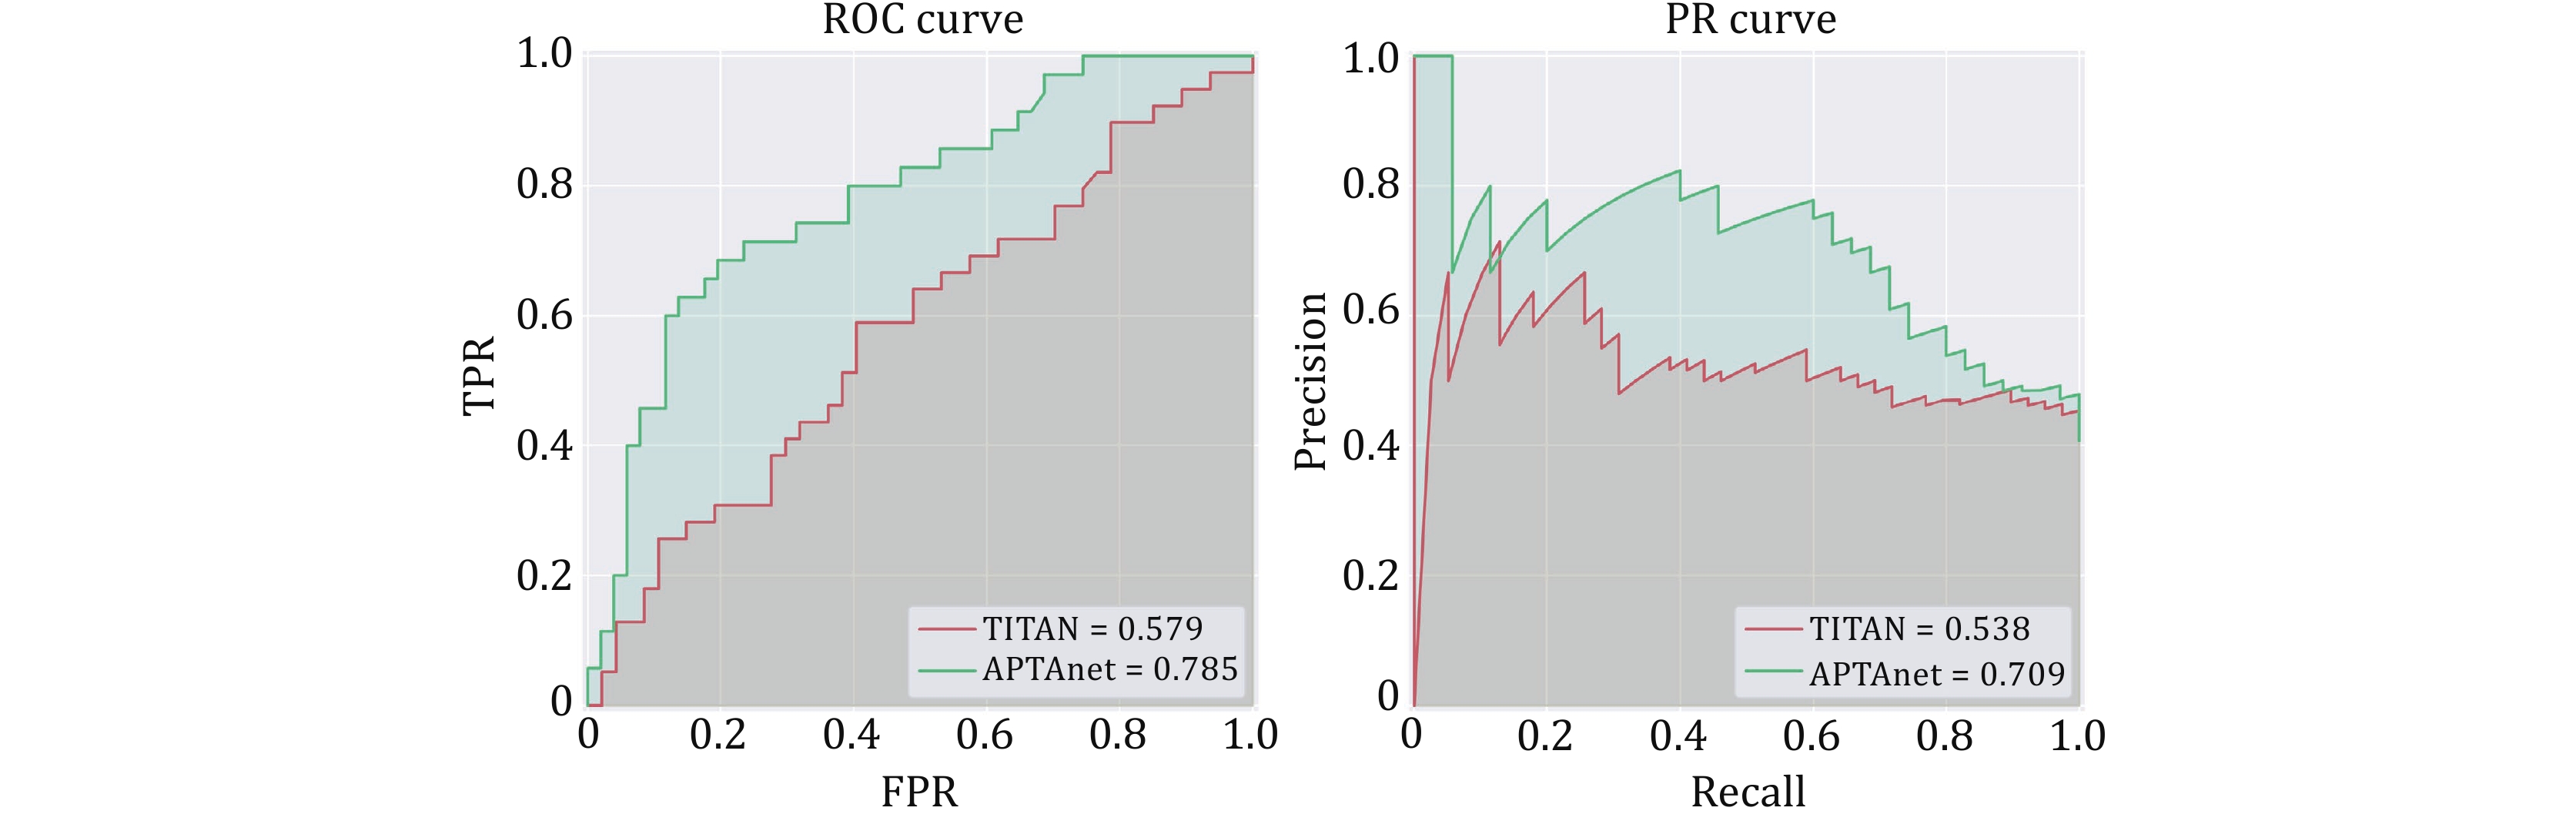
Figure 8. Performance comparison between APTAnet and TITAN in real cancer data. The green line represents APTAnet, and the red line represents TITAN
-
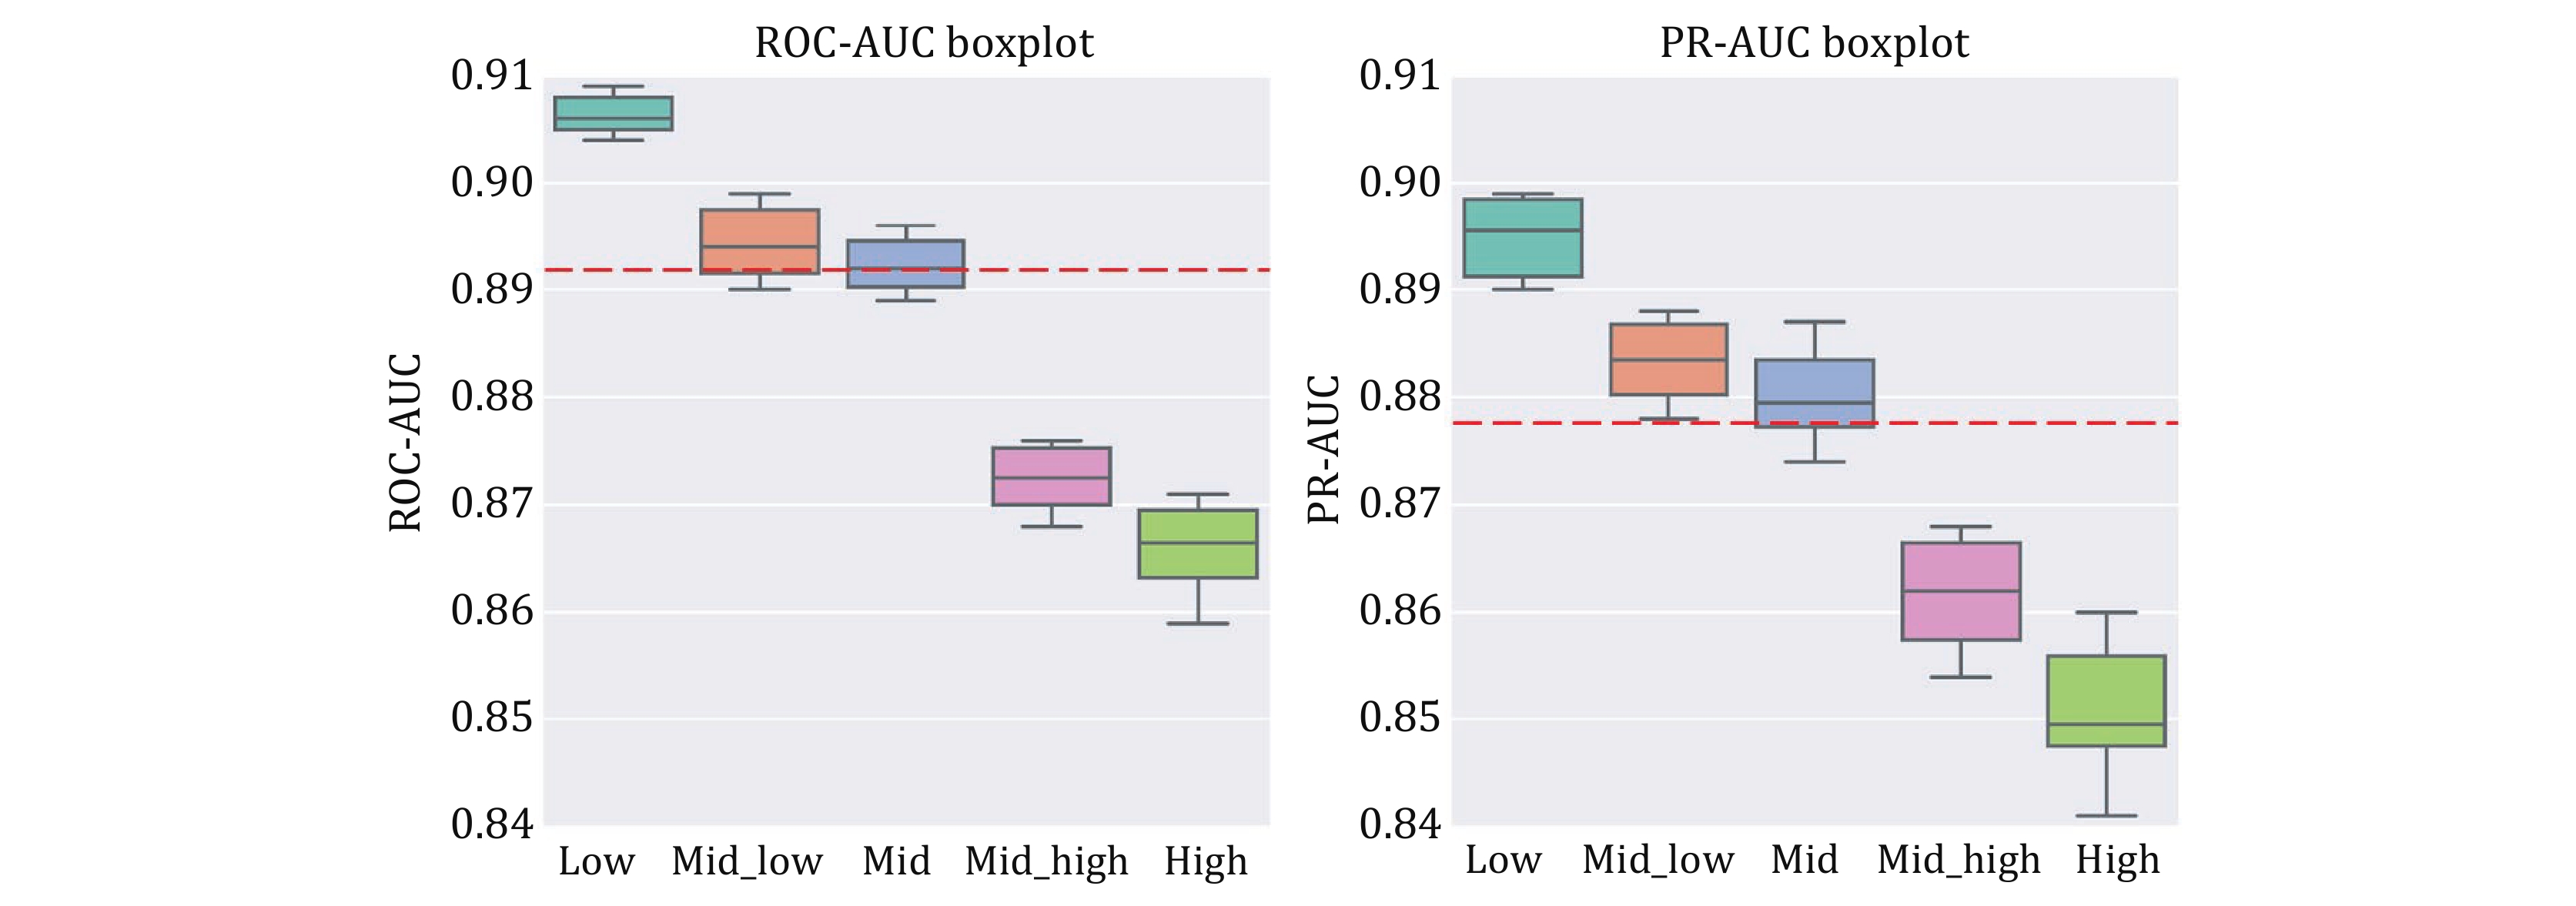
Figure 9. Box plots of ten-fold cross-validation ROC-AUC (left) and PR-AUC (right) for different similarity distances. The red dashed line represents the mean of the overall results
-
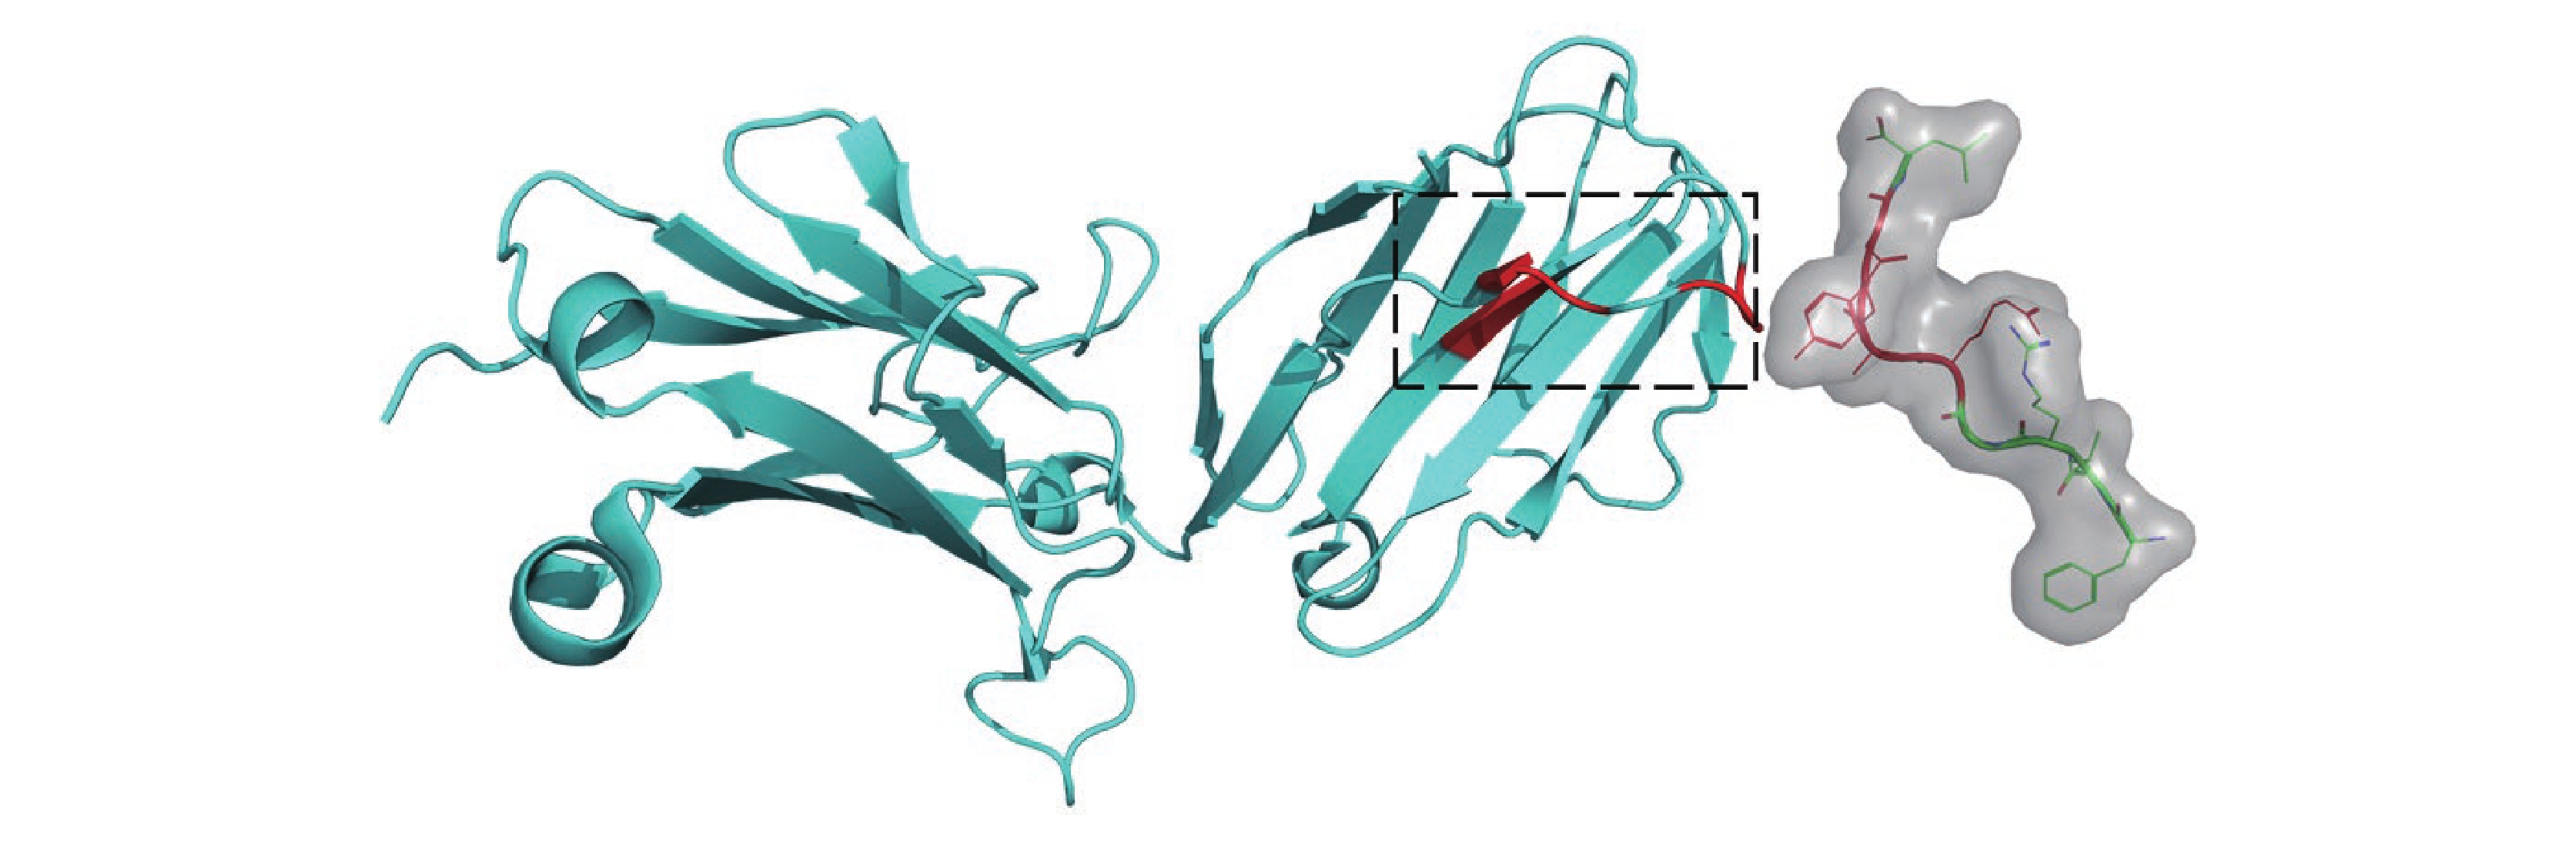
Figure 10. Structure of LC13 TCR in complex with HLAB8-EBV peptide complex (1MI5). The left side in cyan represents TCR β, while the right side in green represents the peptide. The red-highlighted regions indicate the key interaction sites confirmed based on the three-dimensional structure of the PTI. The black-boxed area on the TCR marks the position of CDR3 β, a region known for its high variability and widely recognized for its interaction with peptides
-
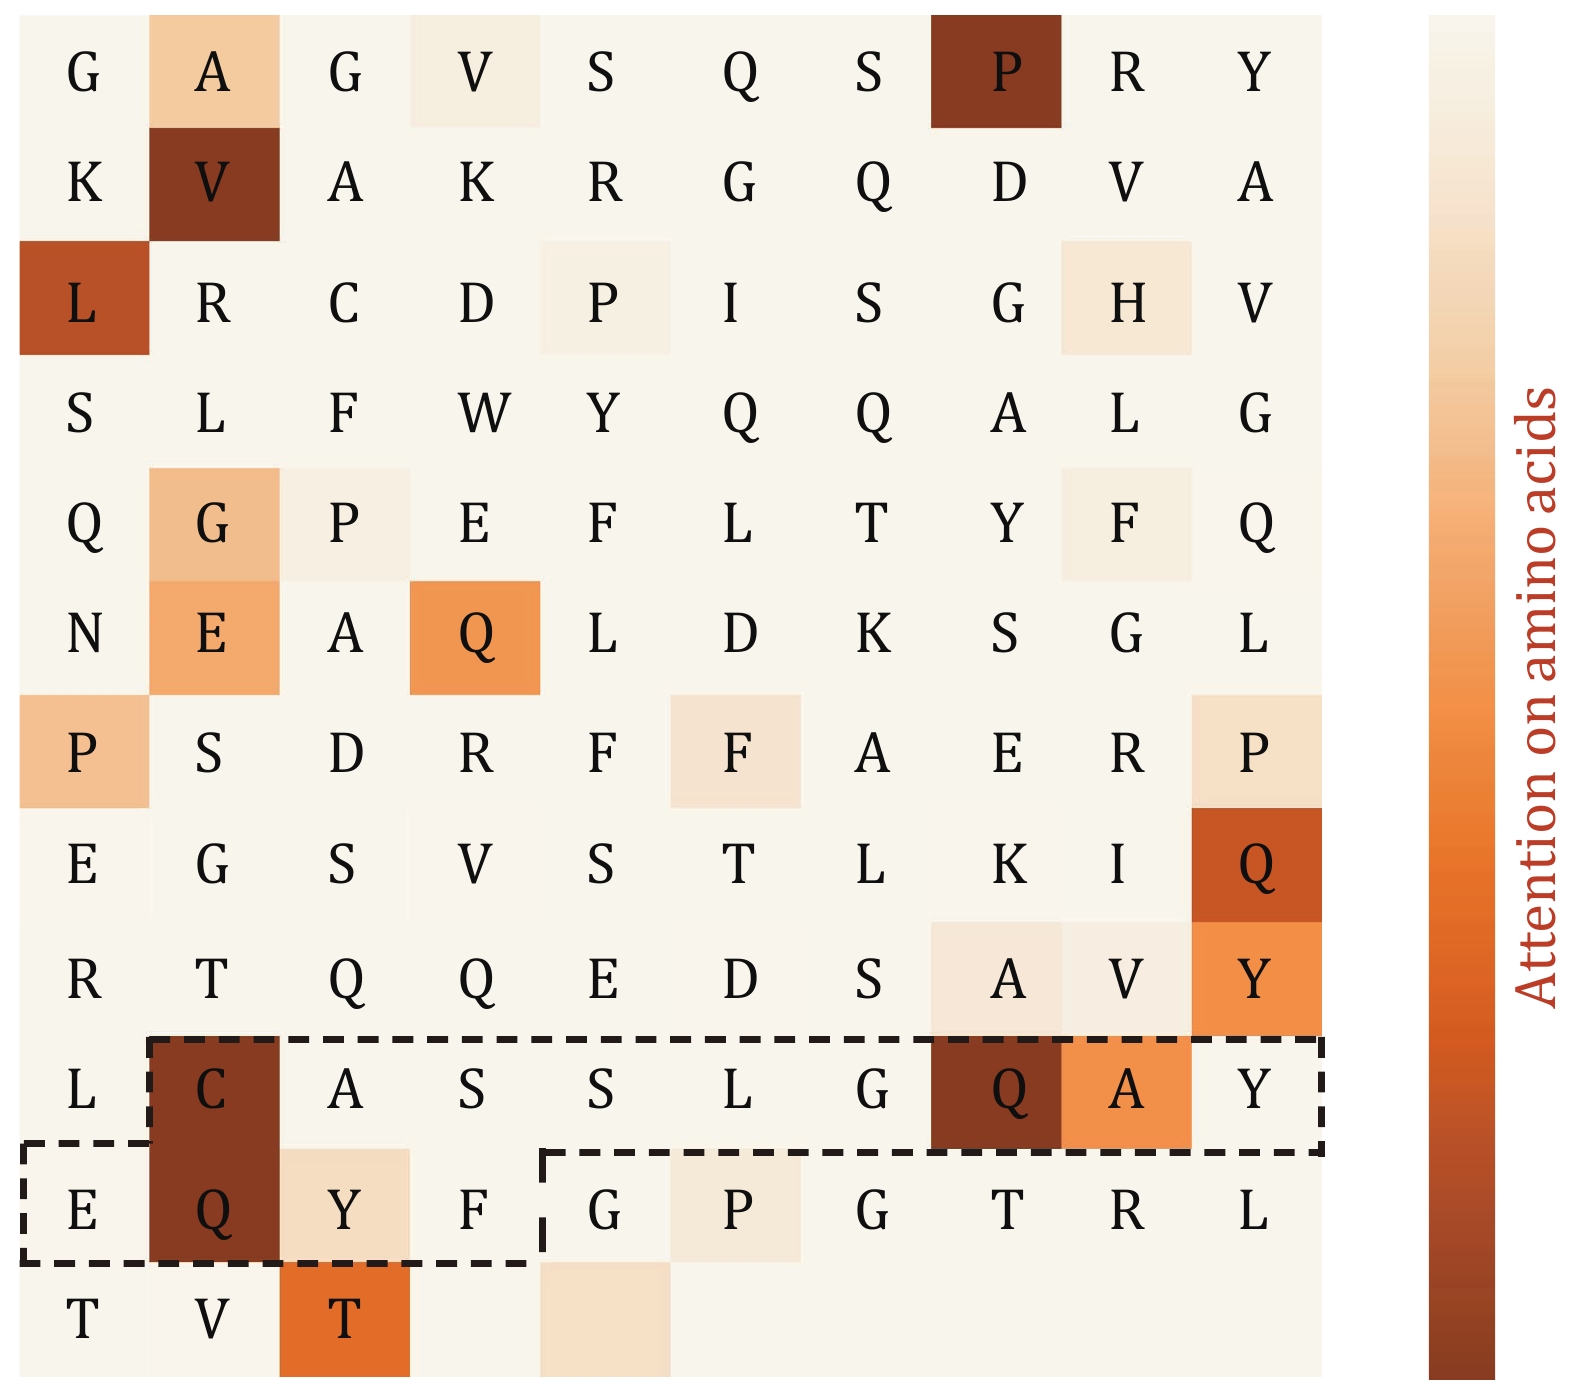
Figure 11. Amino acid-level attention mechanism analysis. The amino acid sequence is horizontally arranged in the matrix, and the symbols in the middle of the matrix represent the corresponding amino acid abbreviations (blank areas indicate the subsequent PAD region of the sequence). The black-boxed region on the TCR corresponds to the CDR3 area. The colors filled in the heatmap represent the strength of attention, with darker colors indicating stronger attention to specific amino acids
-
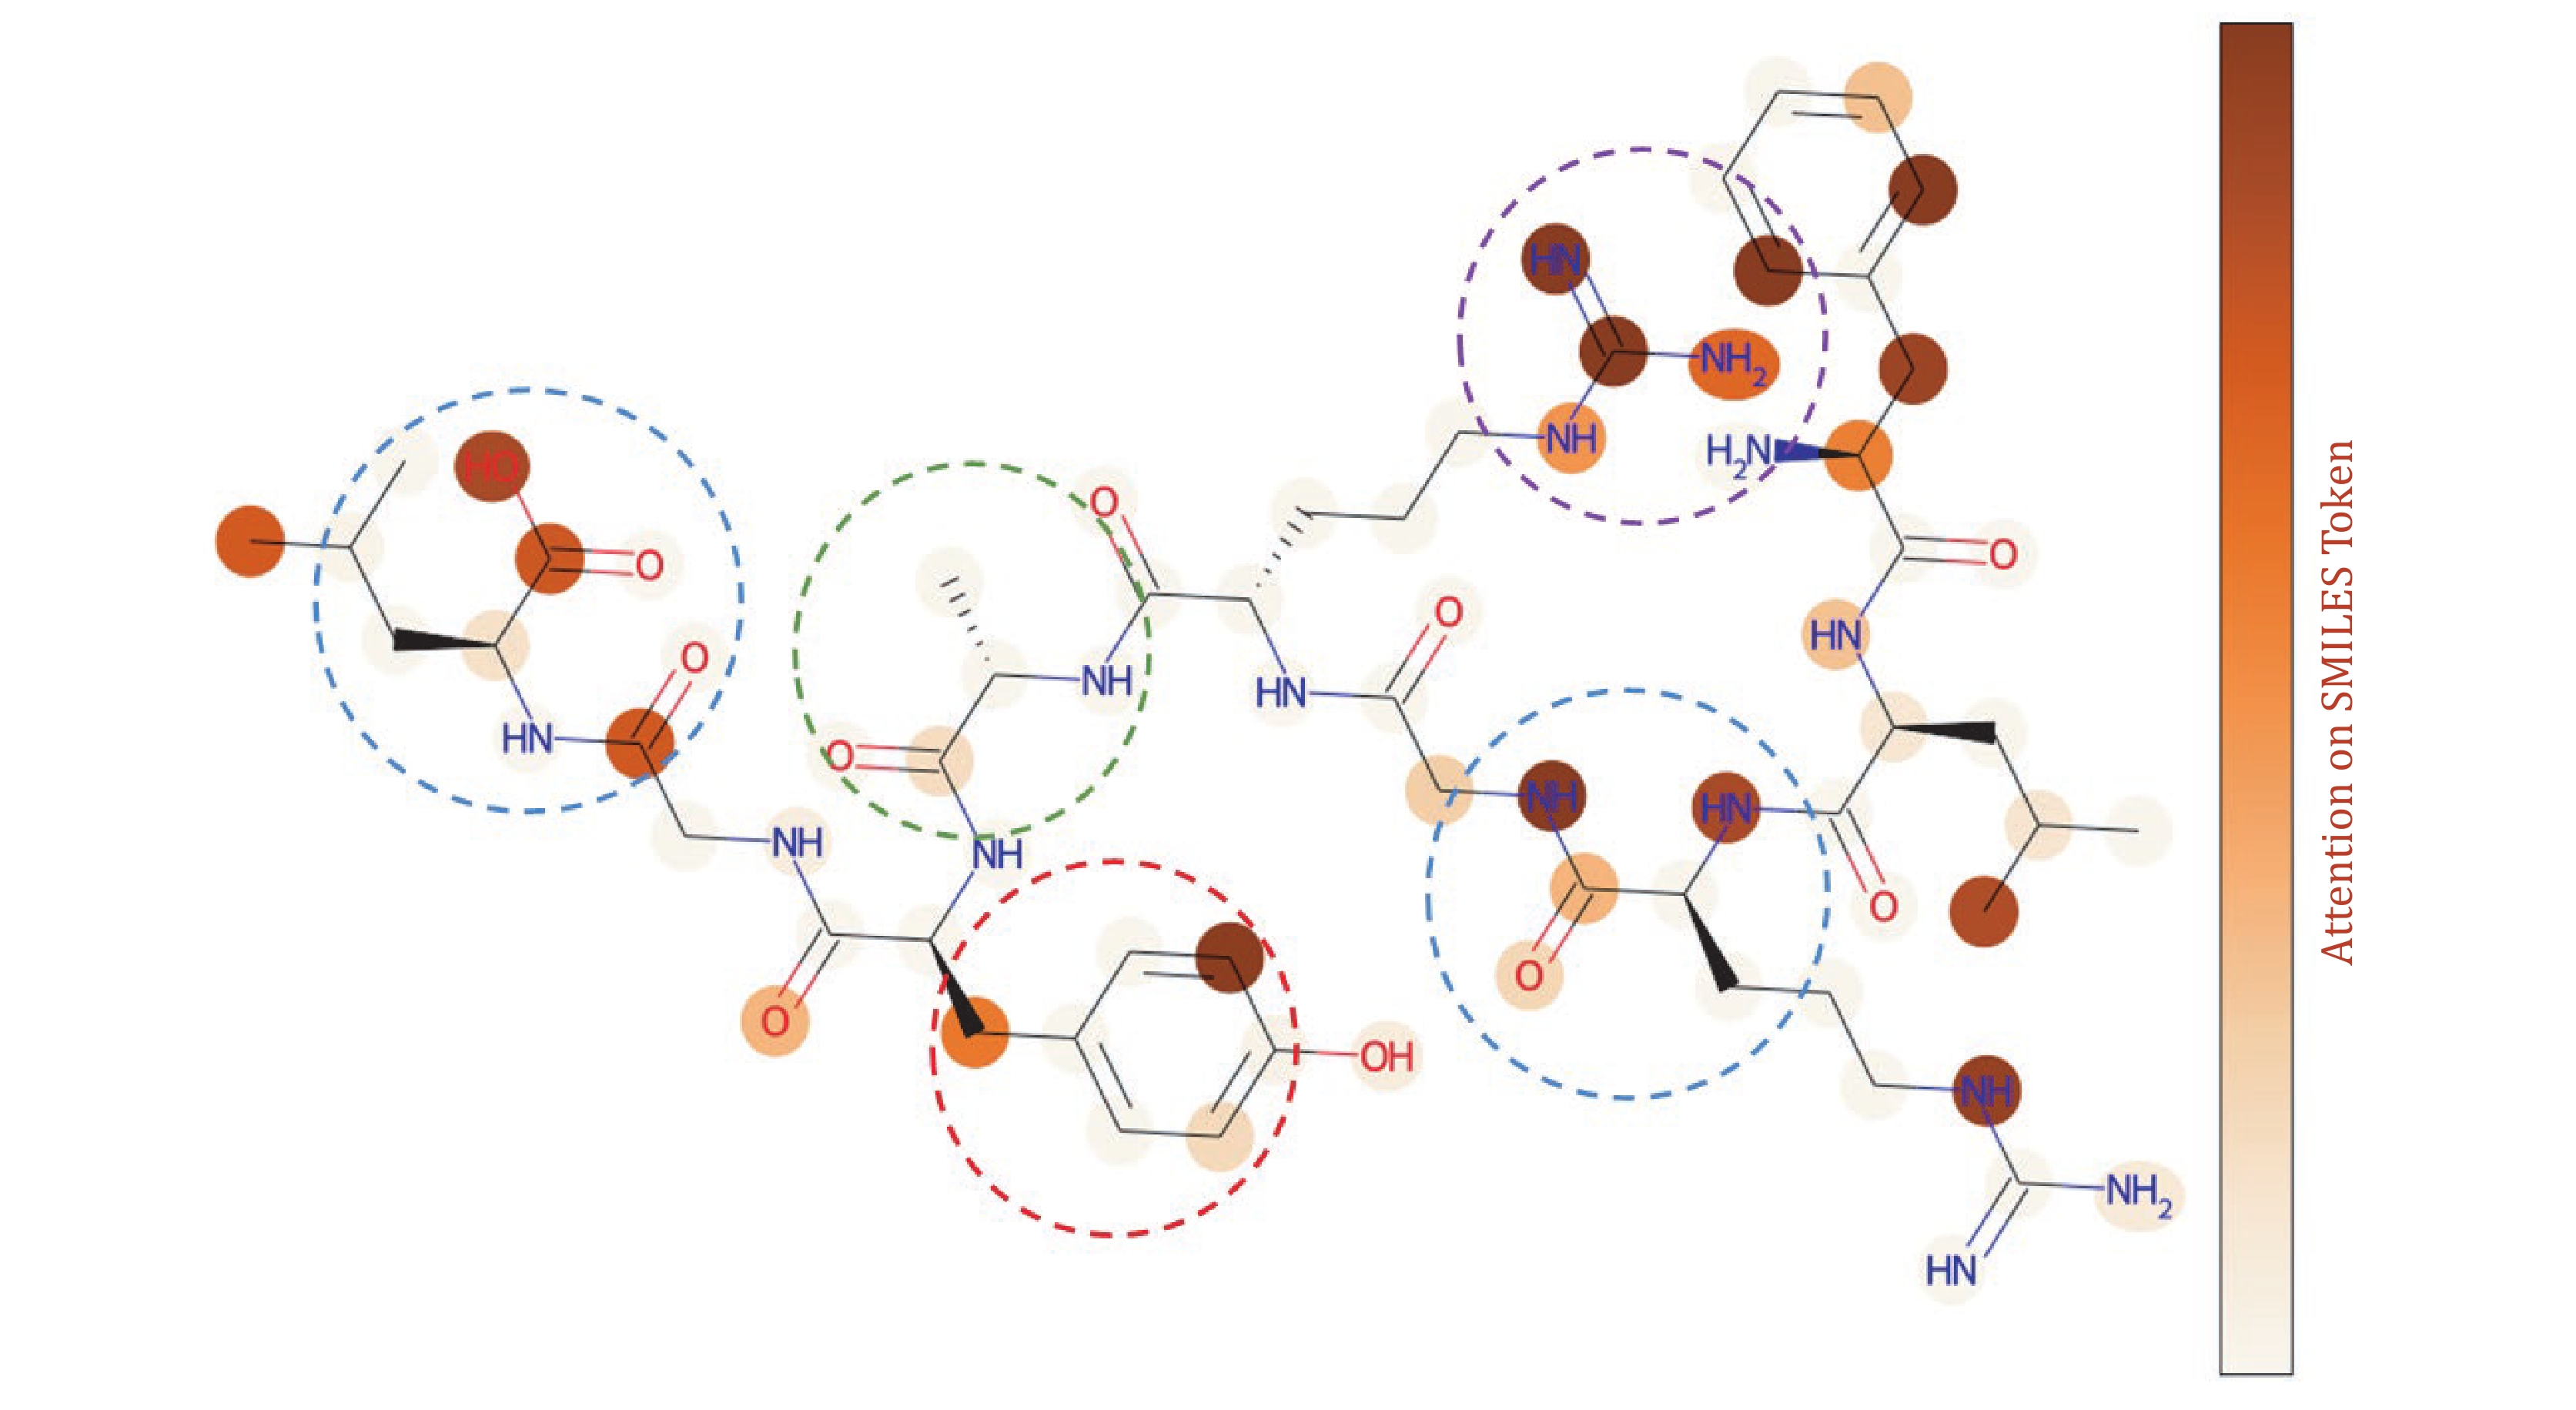
Figure 12. Atom-level attention mechanism analysis. The peptide sequence “FLRGRAYGL” is represented as a corresponding molecular structure diagram, where each node in the molecular graph represents a corresponding atom, the connecting lines represent the chemical bonds between atoms, and the shading of each atom indicates the level of attention that the model places on it in relation to the TCR. The blue boxes represent oxygen-containing functional groups, the red box represents polar amino acids, the purple box represents charged amino acids, and the green box represents nonpolar amino acids
Figure
12 ,Table
4 个