-
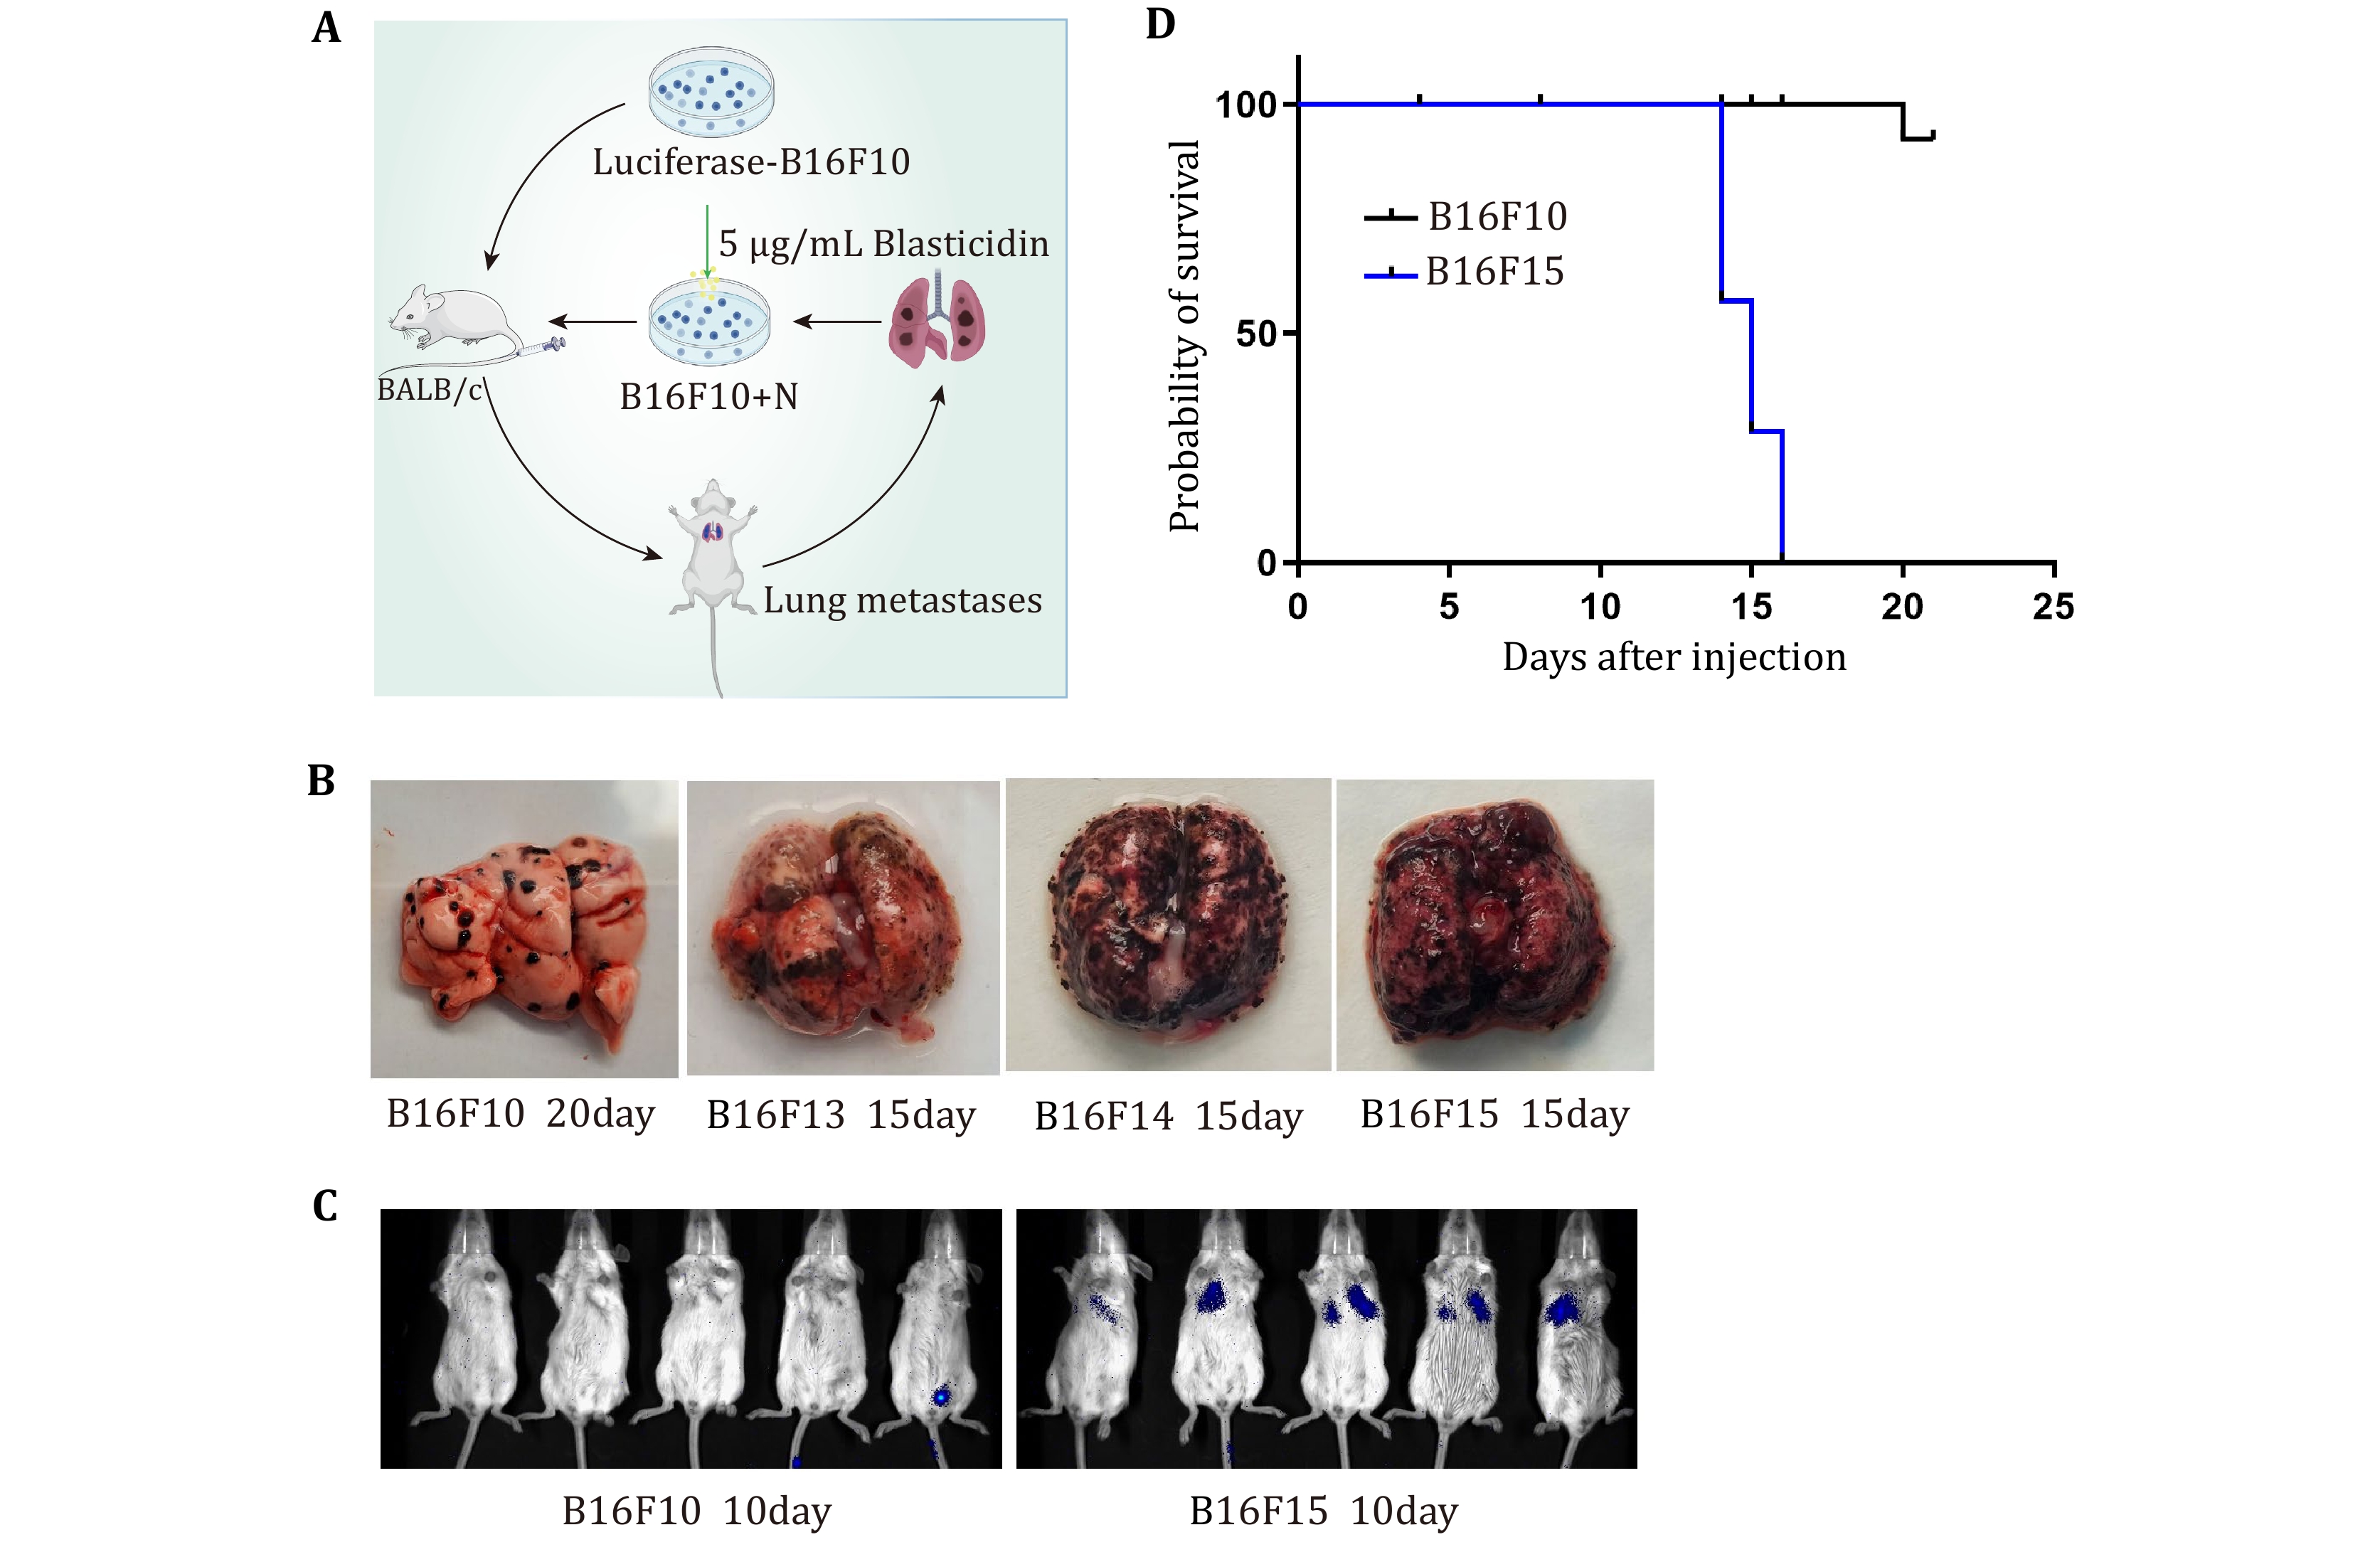
Figure 1. Screening of highly metastatic melanoma cells. A Scheme of highly metastatic tumor cell screening. B Representative images of lung metastasis in different rounds of in vivo screening. C Representative images of live animal imaging to assess lung metastasis after tail vein injection of B16F10 and B16F15 cells in BALB/c mice. D Survival analysis of BALB/c mice after tail vein injection of B16F10 and B16F15 cells
-
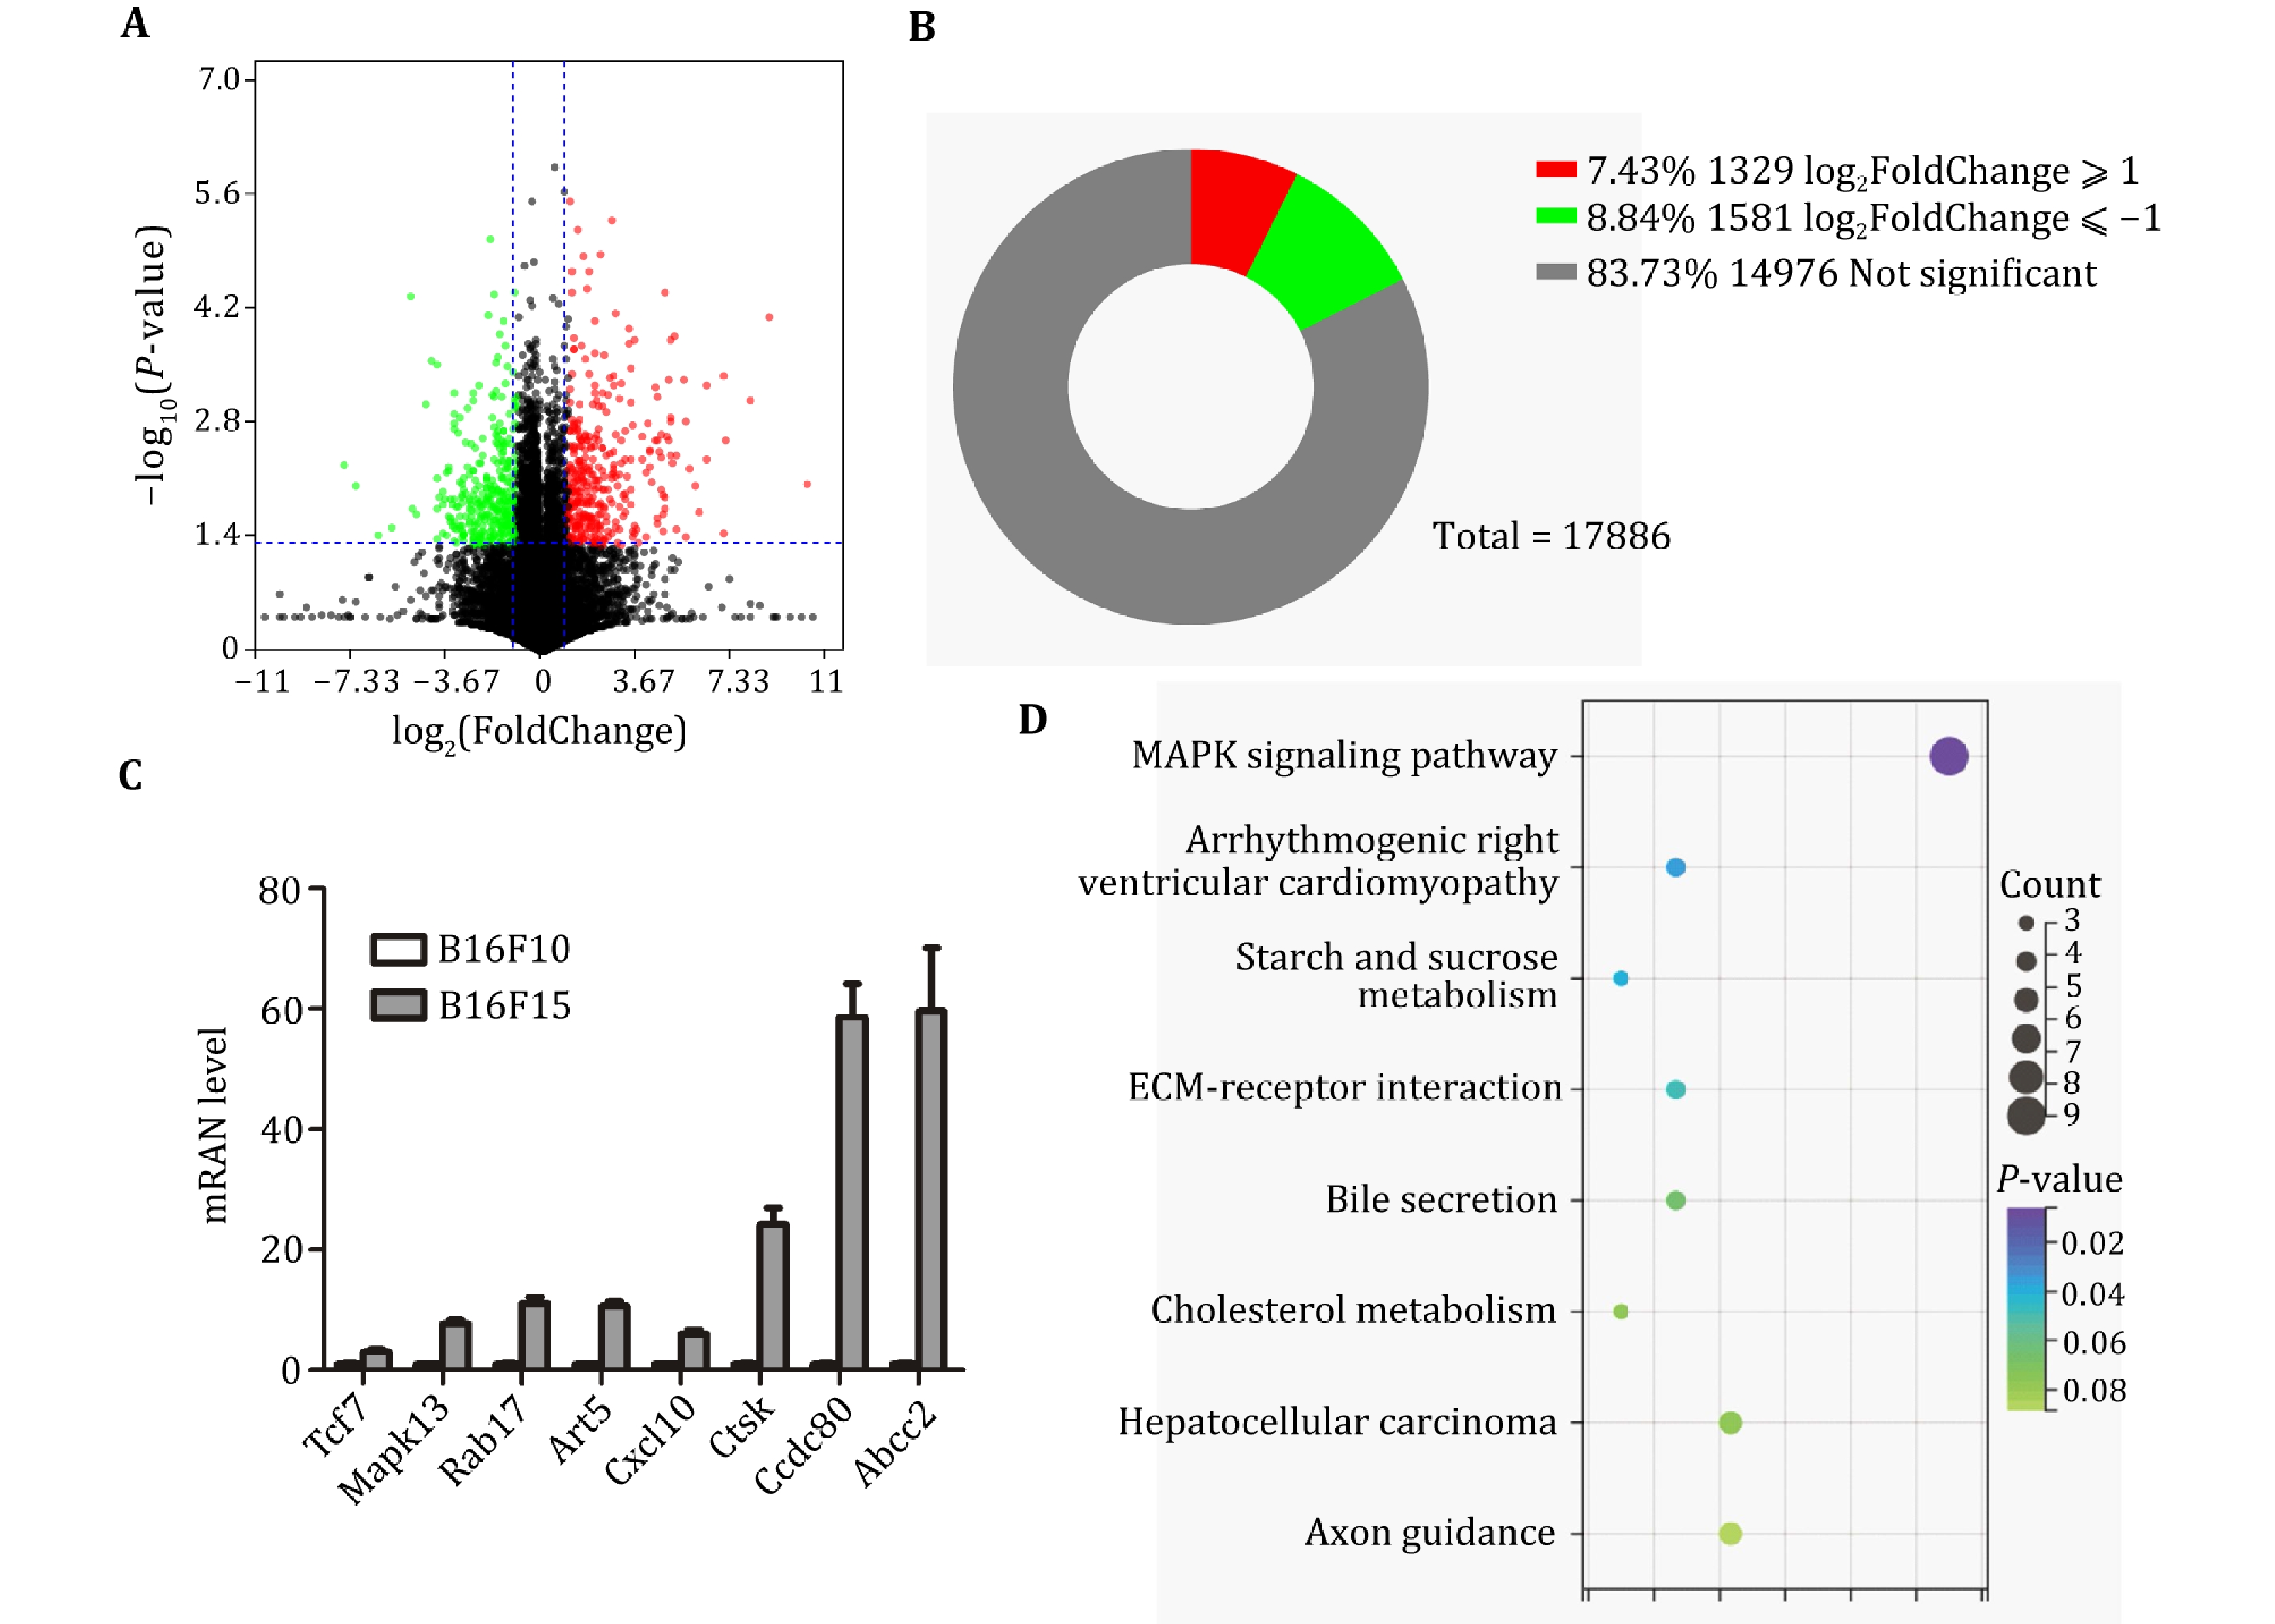
Figure 2. Identification of DEGs between B16F10 and B16F15 cells. A Volcano plot analysis of DEGs between B16F10 and B16F15. B Statistical analysis of the number of DEGs. C qRT-PCR analysis of expression levels of indicated genes in B16F10 and B16F15 cells. D The enrichment analysis of DEGs between B16F10 and B16F15 cells
Figure
2 ,Table
0 个