-
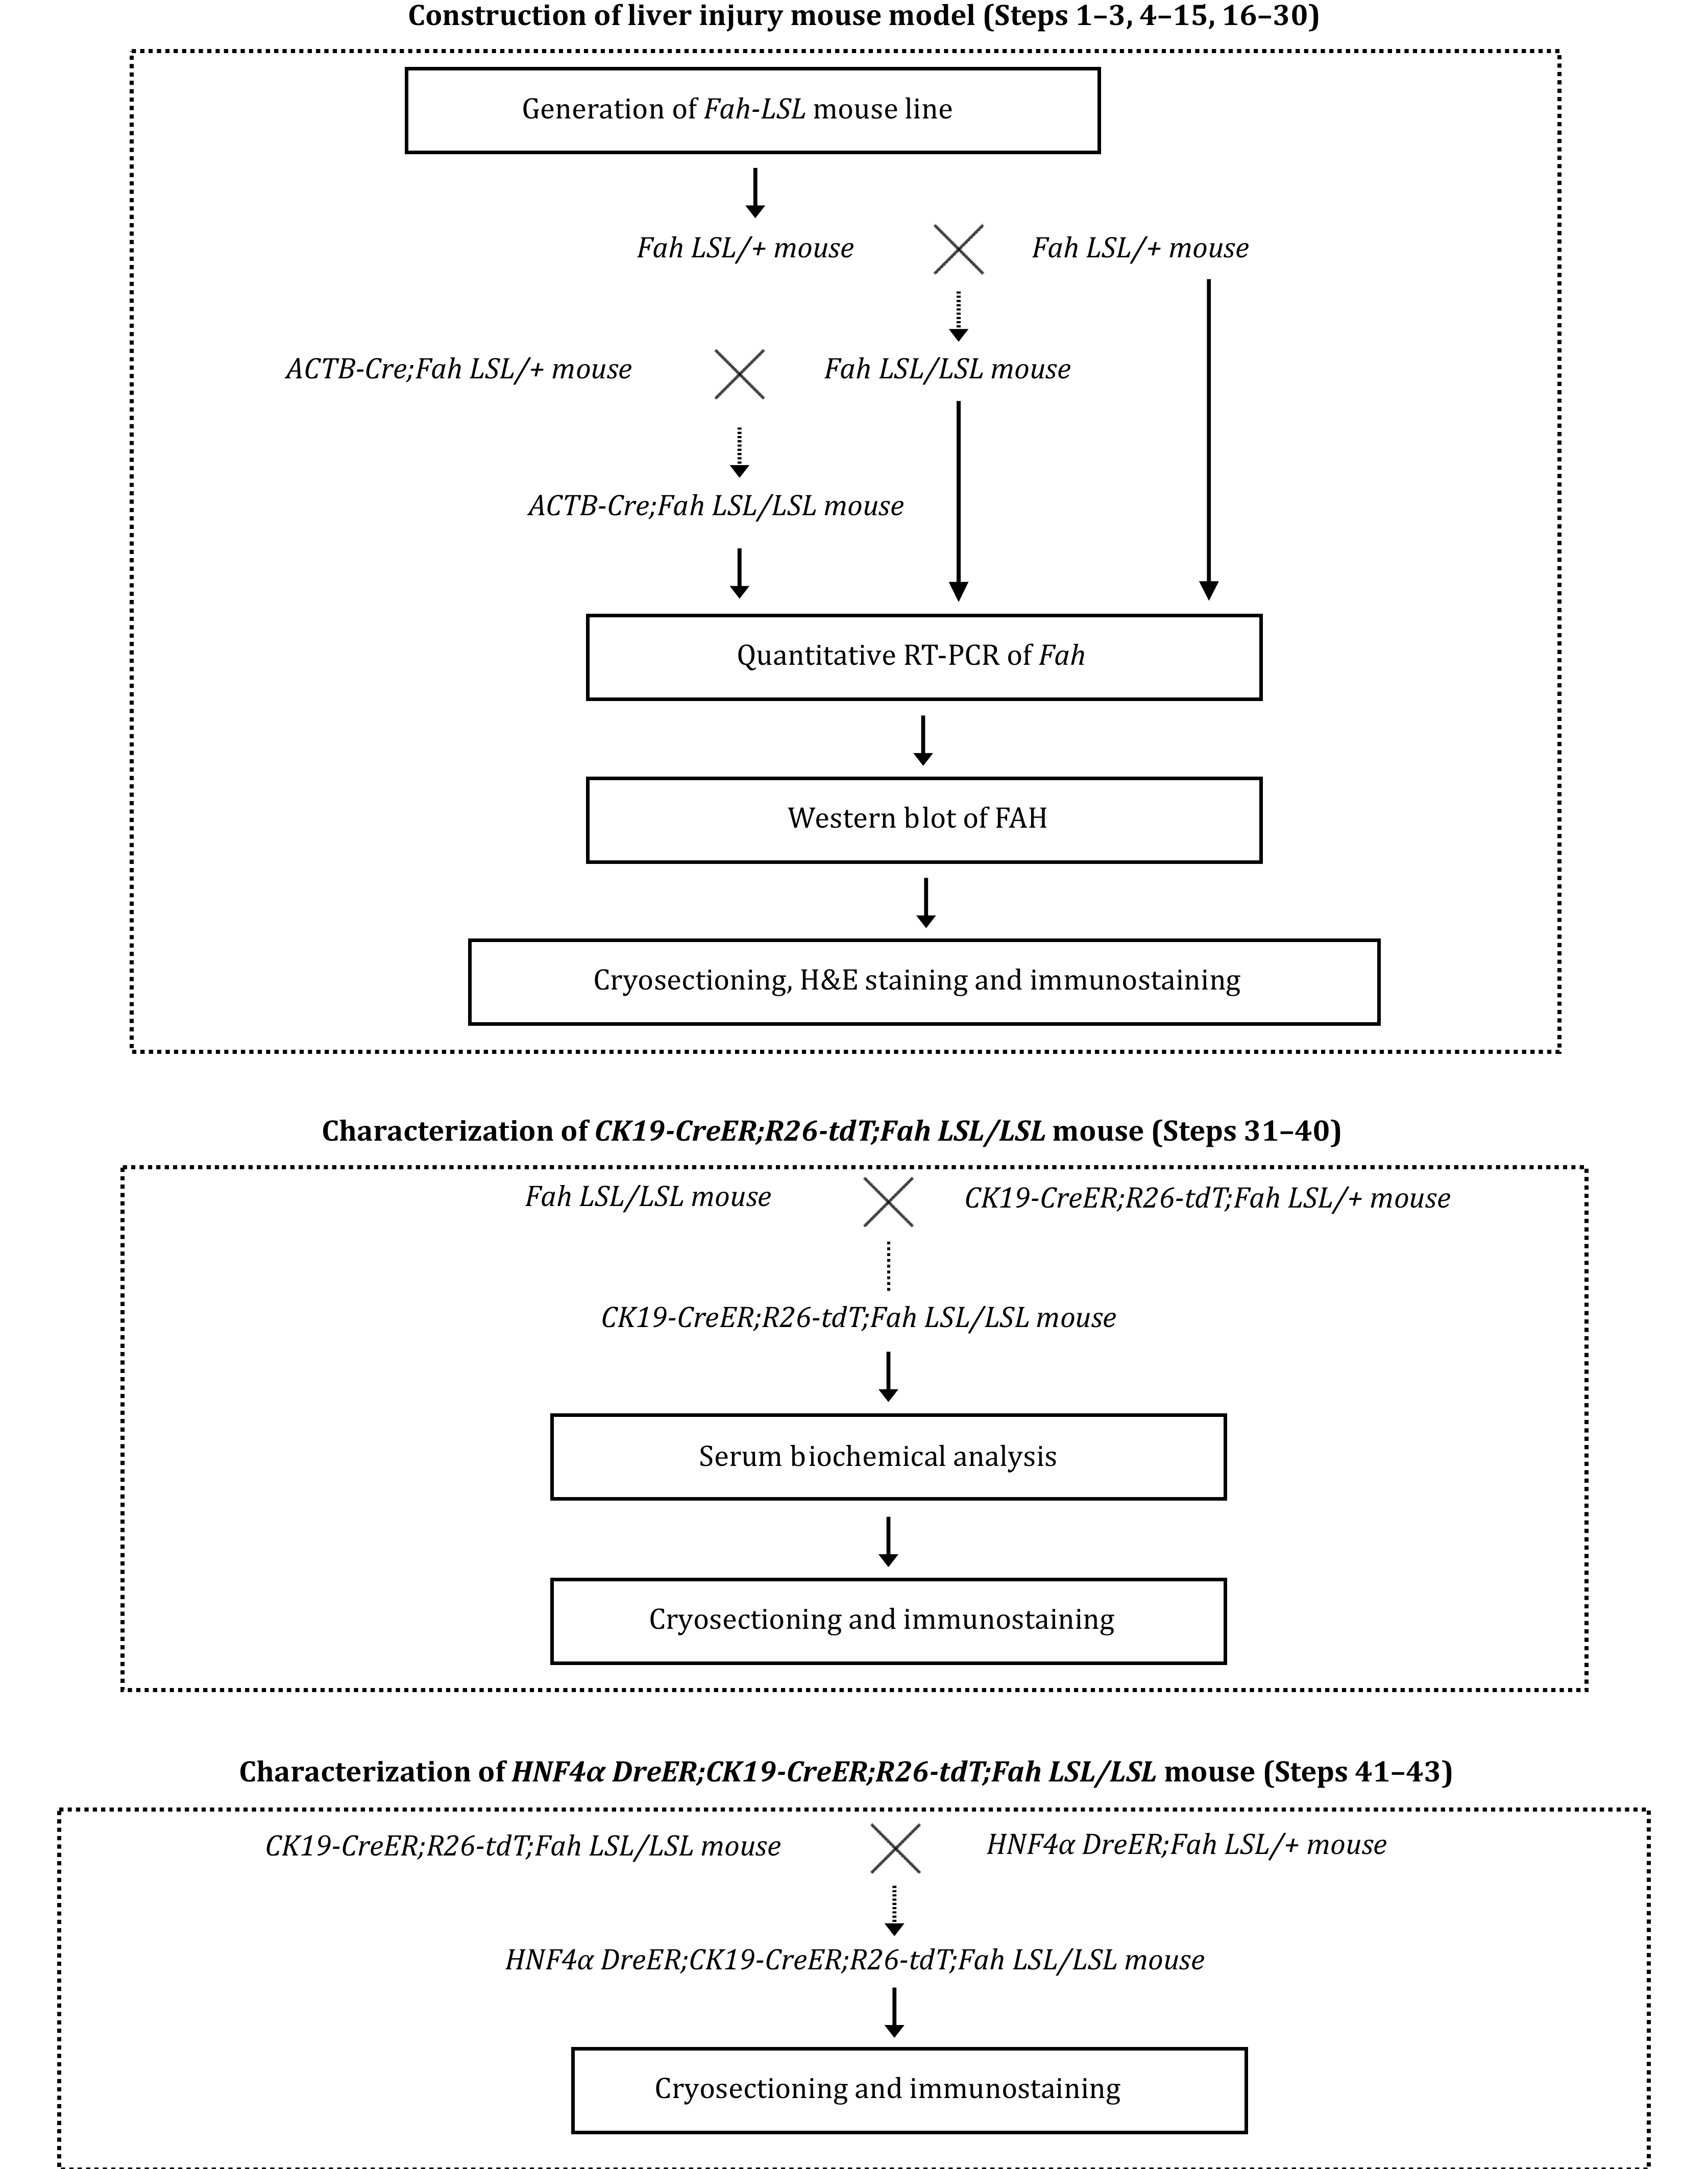
Figure 1. Strategy of crossing mice for the purpose of experiment. First, Fah-LSL homozygous mice was constructed. Fah-LSL/LSL mice and Fah-LSL/LSL;ACTB-Cre mice were generated through mating. By examing the Fah expression and phenotypes of the mice, the liver injury mouce model was validated. Next, to trace BECs in the liver injury model, CK19-CreER;Fah-LSL/LSL;R26-tdT mice were generated, and their tdT was induced and Fah was restored in BECs after tamoxifen-induced Cre-loxp recombination. Lastly, a Cre-loxp and Dre-rox based dual genetic lineage tracing approach to idelibly label CK19+ HNF4α+ TLPCs was developed to further characterize BEC-derived TLPCs.
-
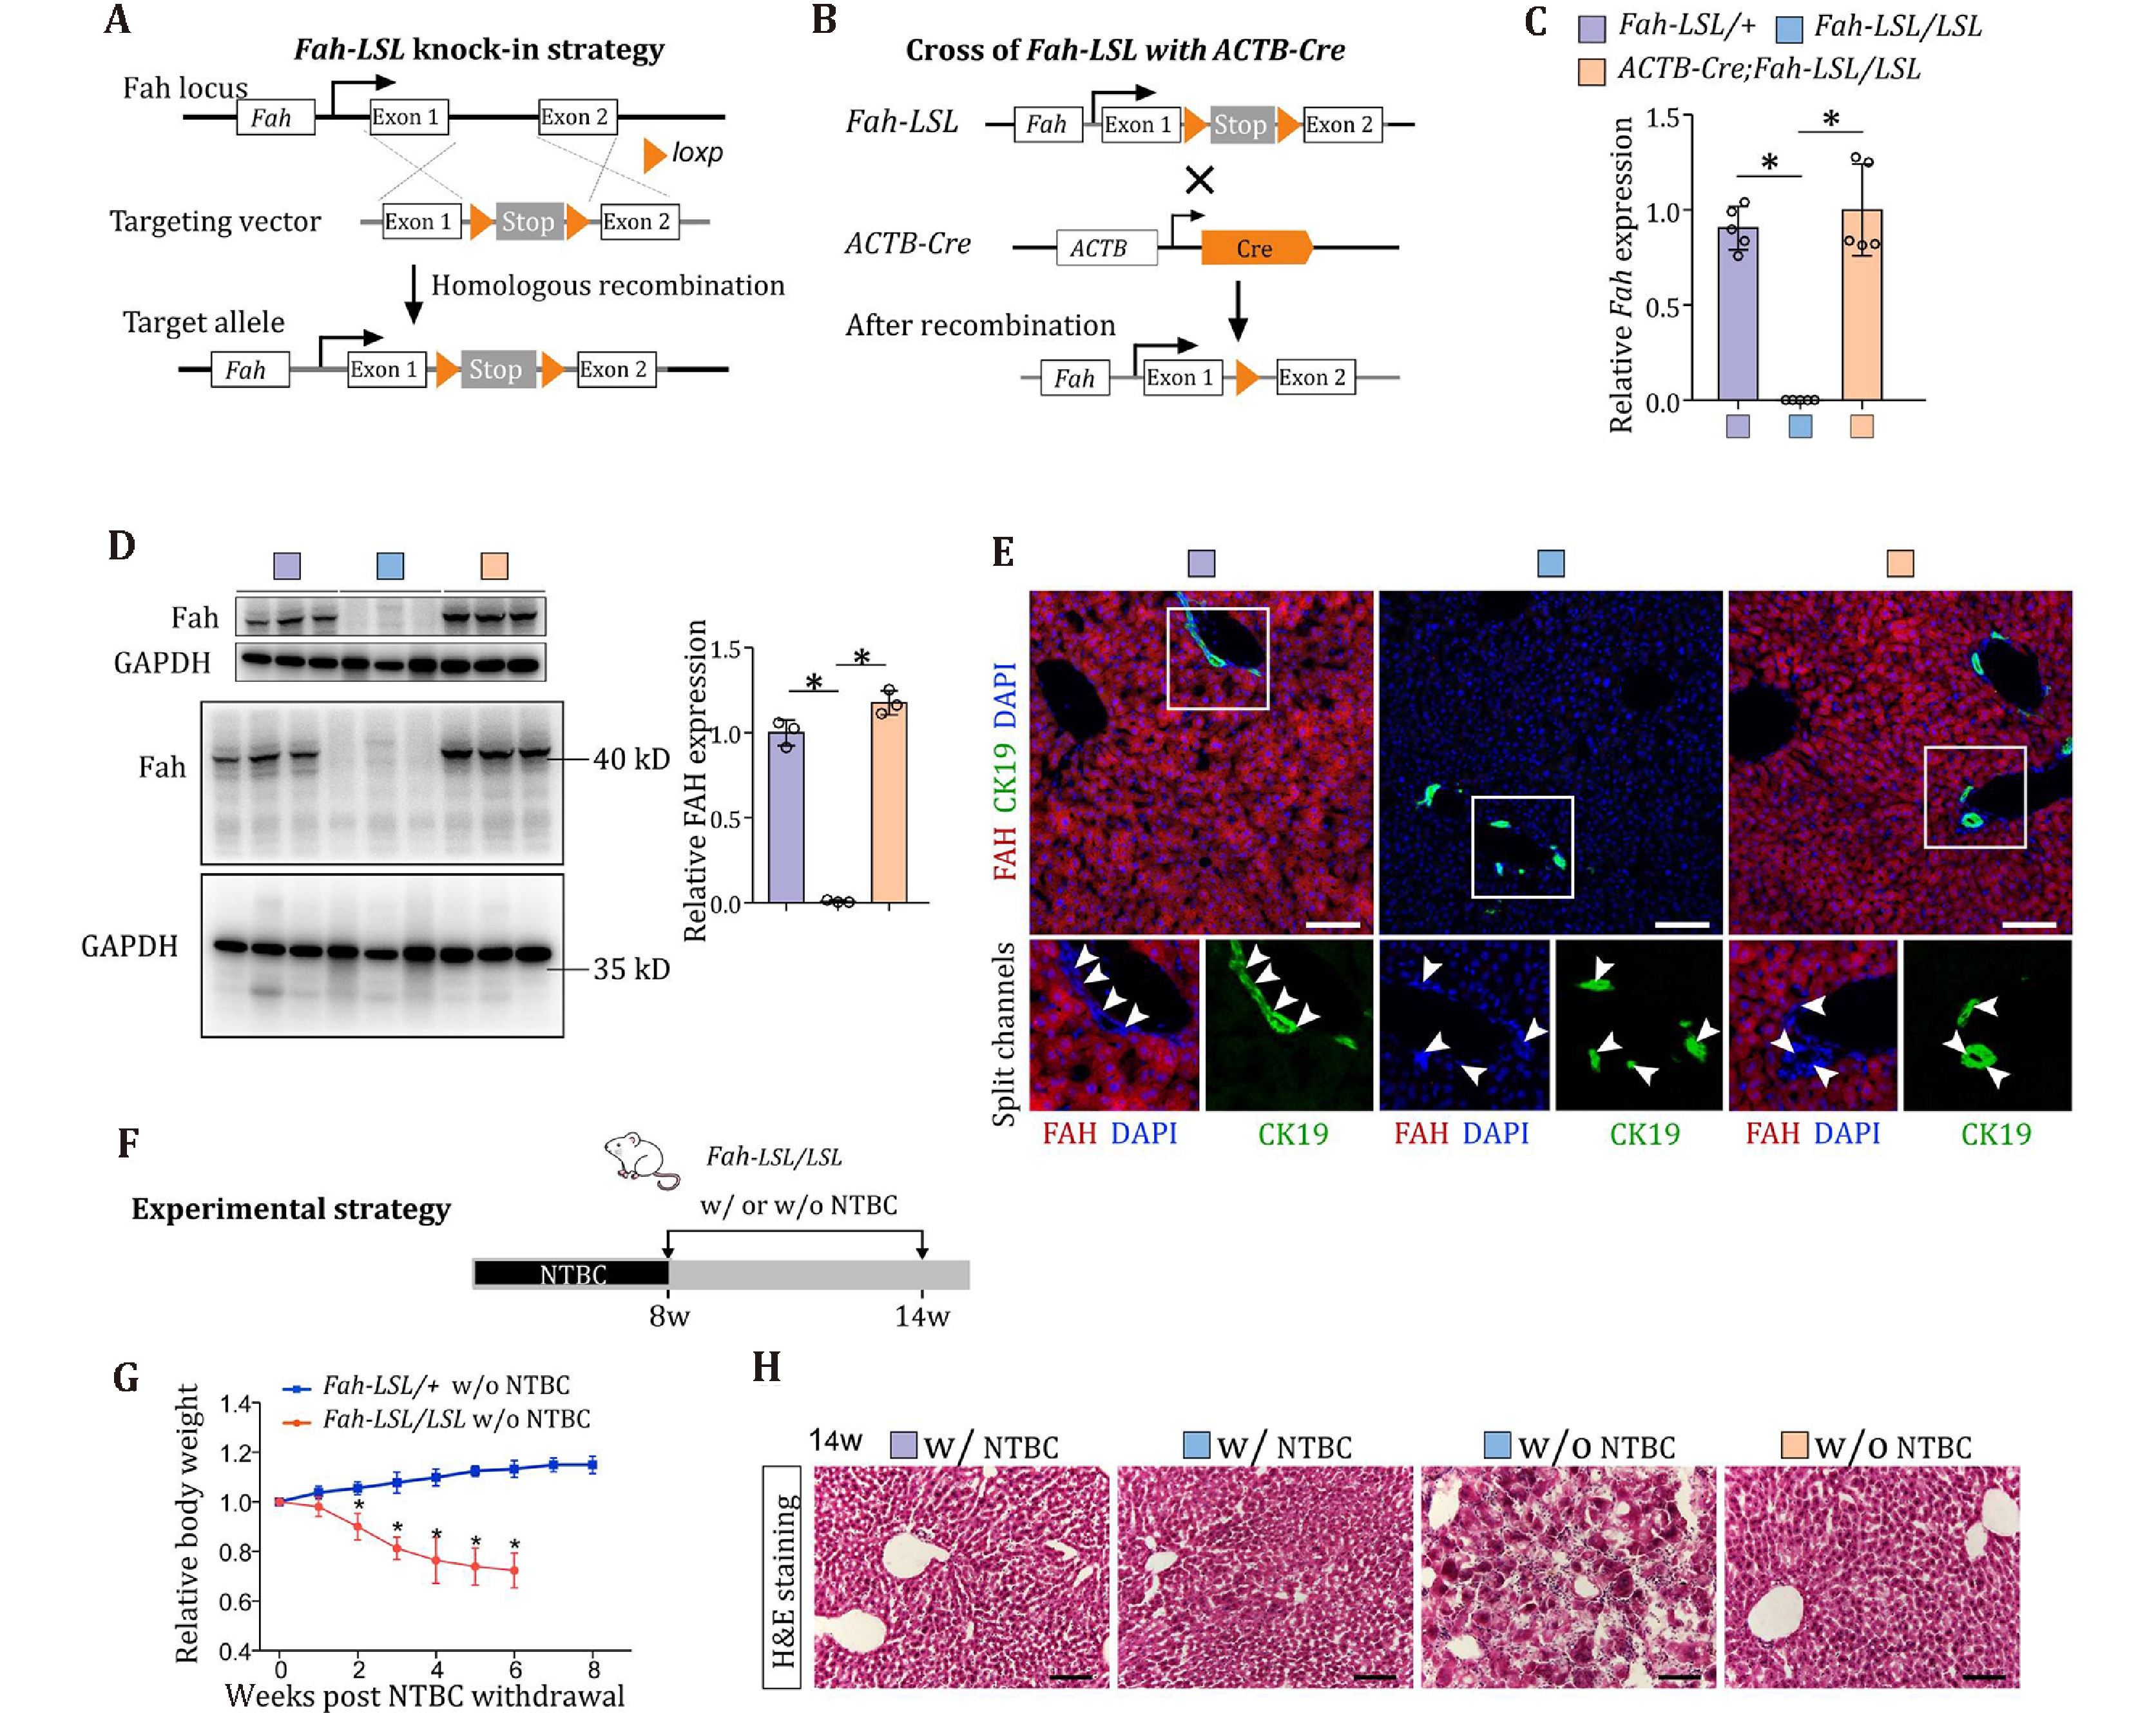
Figure 2. Generation and characterization of Fah-LSL mice. A Schematic diagram showing the strategy for generation of Fah-LSL knock-in allele by homologous recombination. B Schematic diagram showing re-expression of Fah after LSL removal by crossing of Fah-LSL mice with ACTB-Cre mice. C Relative mRNA expression levels of Fah in the livers of adult Fah-LSL/+, Fah-LSL/LSL and Fah-LSL/LSL;ACTB-Cre mice treated with NTBC. Data are the mean ± SD; n = 5 mice; *P < 0.0001, *P < 0.0001. D Western blotting for FAH in the livers of adult Fah-LSL/+, Fah-LSL/LSL and Fah-LSL/LSL;ACTB Cre mice treated with NTBC. Quantification of the relative protein levels of FAH was shown on the right. Data are the mean ± SD; n = 3 mice; *P < 0.0001, *P < 0.0001. Statistical analysis in Panels C and D was performed by ANOVA followed by Bonferroni test for multiple comparisons and adjustments were made for multiple comparisons. E Immunostaining for FAH and CK19 on the liver sections from adult Fah-LSL/+, Fah-LSL/LSL and Fah-LSL/LSL;ACTB-Cre mice treated with NTBC. Arrowheads, CK19+ FAH- BECs. Scale bar,100 µm. F Schematic showing the experimental strategy for NTBC withdrawal (w/o NTBC) and tissue analysis at indicated time points. G Weekly body weight measurements for Fah-LSL/+ and Fah-LSL/LSL mice after NTBC withdrawal (w/o NTBC). The data are normalized to the body weights at week 0. Data represent mean ± SD; n = 5 mice; week2: *P < 0.0004; week3–week6: *P < 0.0001. Statistical analysis was performed by multiple t-test. Each row was analyzed individually without assuming a consistent SD. H Hematoxylin and eosin (H&E) staining of liver sections. Scale bar, 100 µm
-
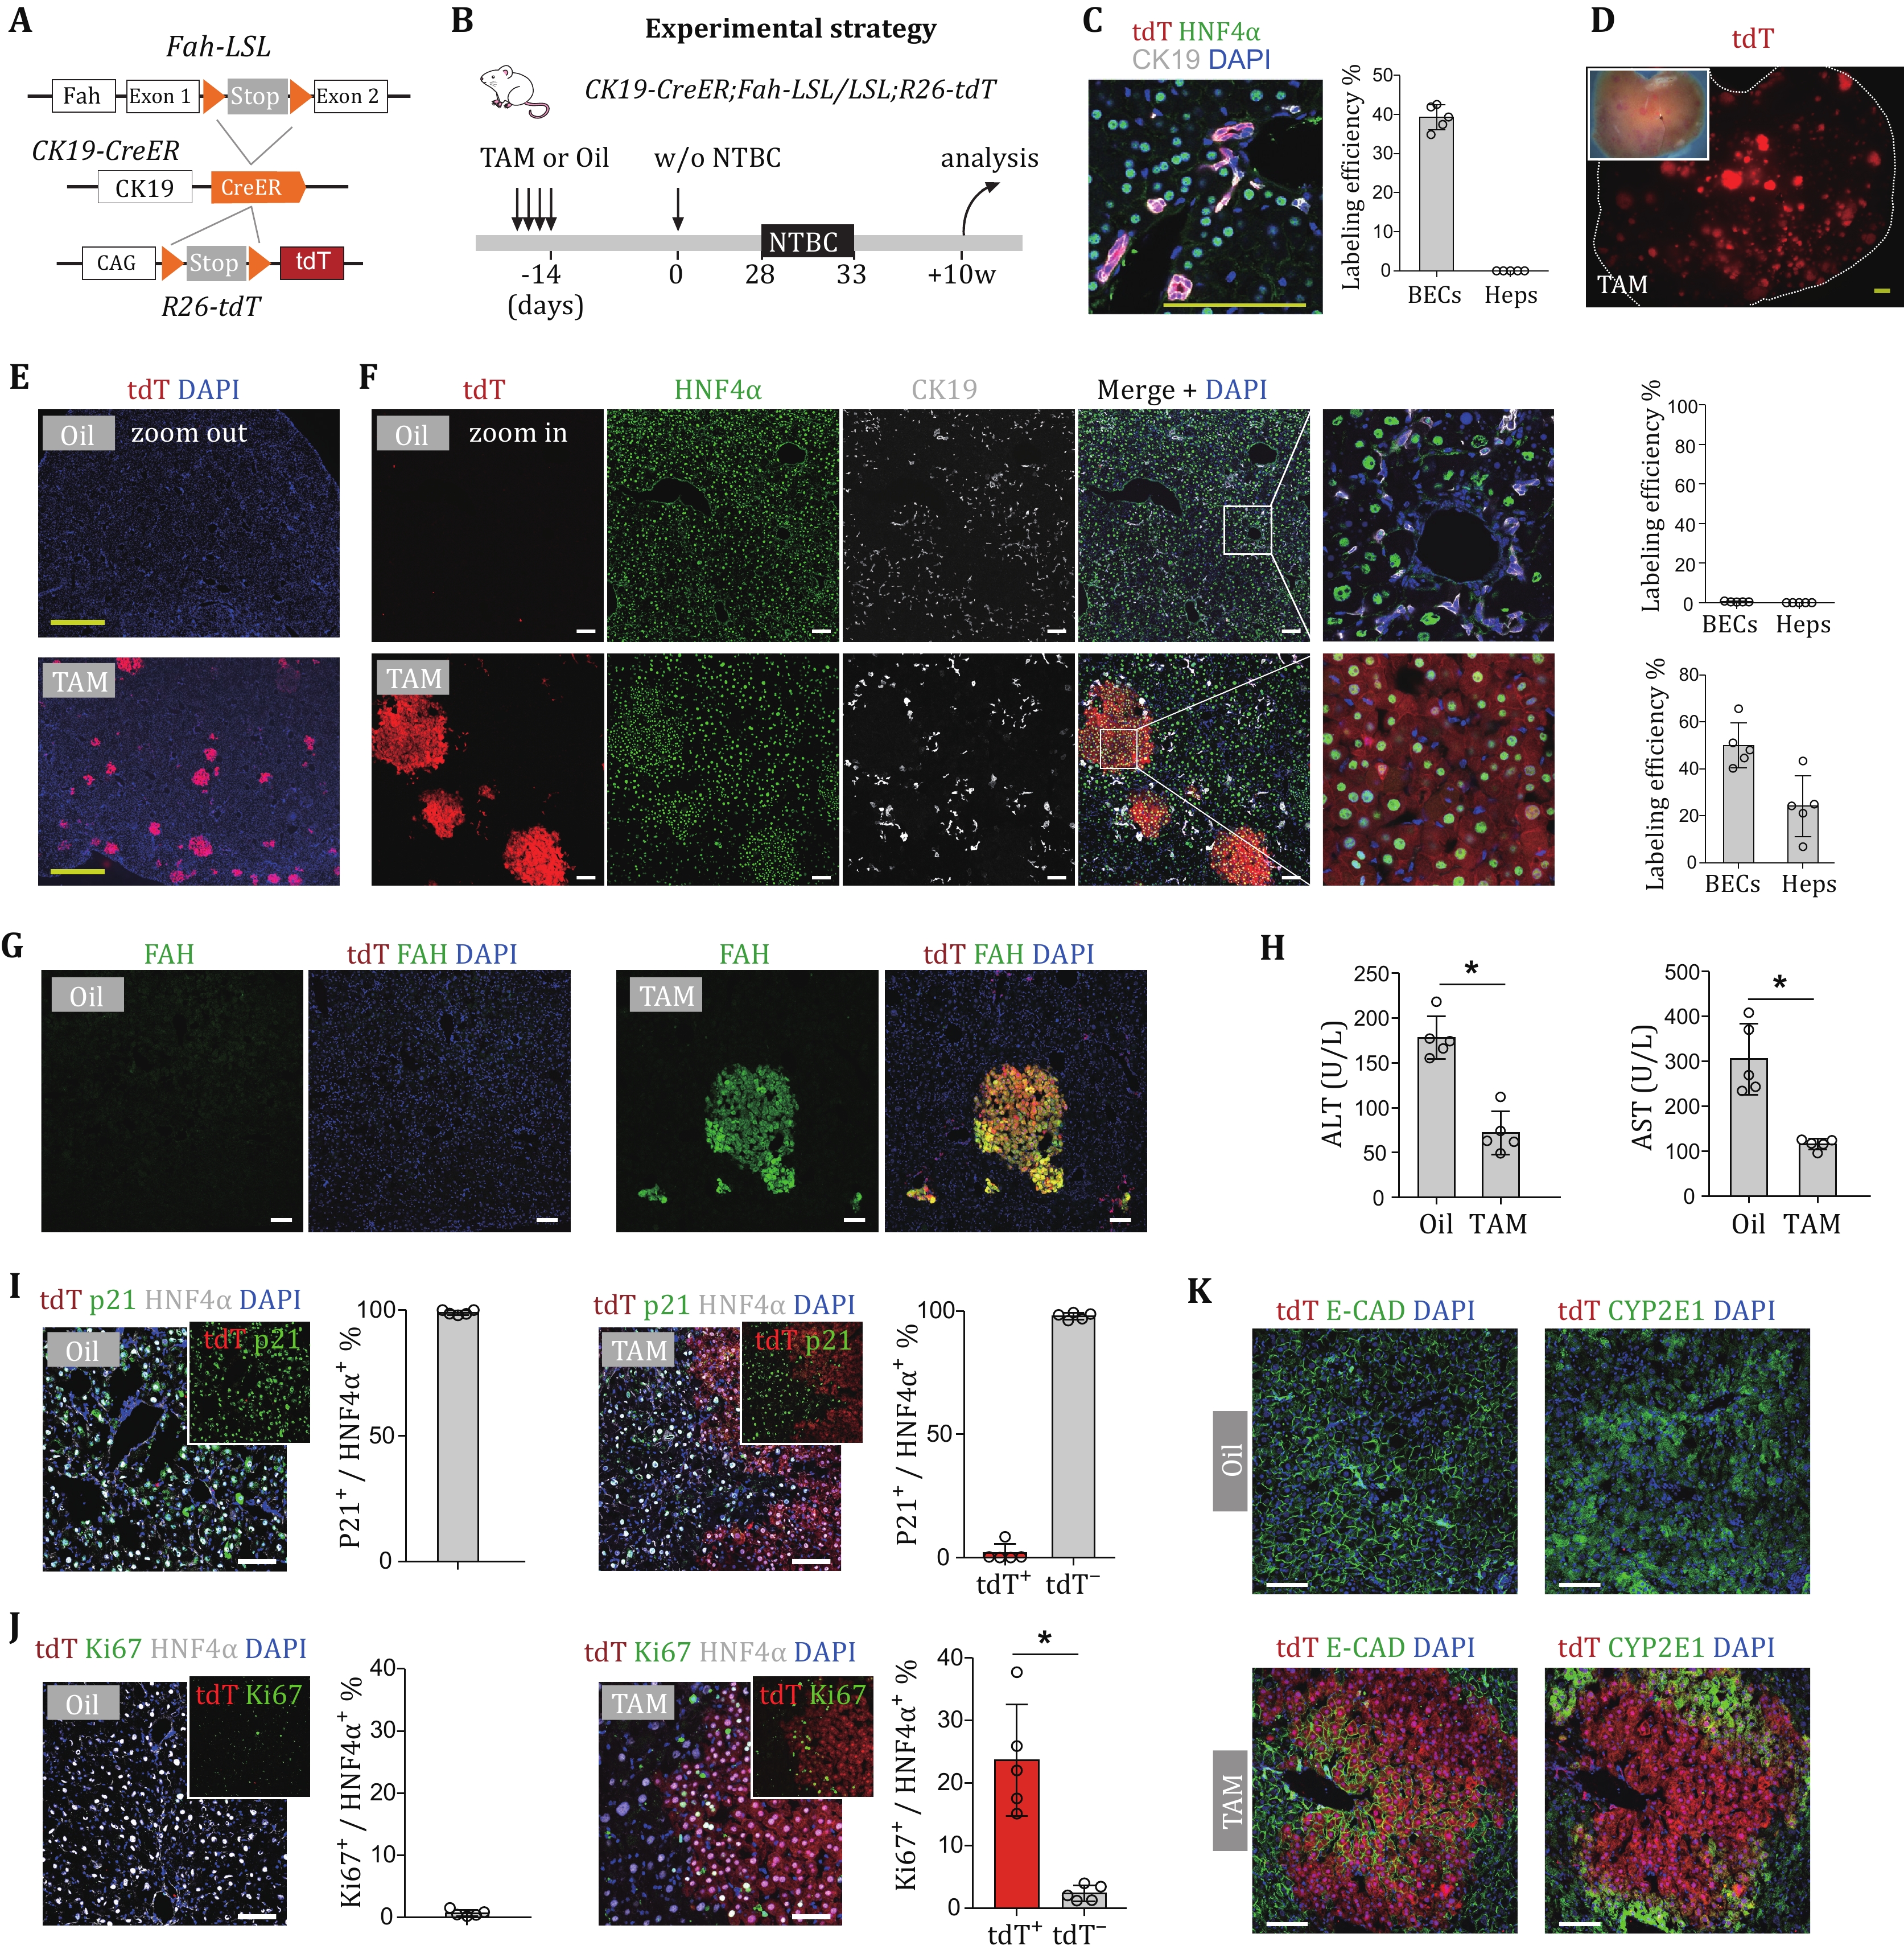
Figure 3. BEC-derived hepatocytes contribute to liver regeneration. A Schematic diagram showing the experimental design for recovery of Fah gene in BECs and lineage tracing. B Schematic diagram showing the experimental strategy of lineage tracing in CK19-CreER;Fah-LSL/LSL;R26-tdTmice. C Immunostaining for tdT, CK19, and HNF4α on liver sections collected at day 0. Scale bar, 1 mm. Right panel shows quantification of cell labeling efficiency. Data represent mean ± SD; n = 5 mice. D Whole-mount fluorescence liver images. Scale bars, 1 mm. E Immunostaining for tdT on liver sections from mice treated with TAM or oil. Scale bars, 1 mm. F Immunostaining for tdT, HNF4α, and CK19 on the liver sections from mice treated with TAM or oil. Quantification of percentage of tdT+ BECs and tdT+ Heps is shown in the adjacent graph. Data represent mean ± SD; n = 5 mice. Scale bars, 100 µm. G Immunostaining for tdT and FAH on the liver sections from mice treated with TAM or oil. Scale bars, 100 µm. H Serum ALT and AST of mice treated with TAM or oil. Data are the mean ± SD; n = 5 mice. *P < 0.0001; *P < 0.0001. I, J Immunostaining for tdT, HNF4α and p21 (I) or Ki67 (J) on liver sections. Inserts show green and red fluorescence channels. Quantification of Ki67 or p21 staining in tdT+ and tdT– hepatocytes is shown in the adjacent graph. Data represent mean ± SD; n = 5 mice. *P < 0.0001; Statistical analysis in Panels H and J was performed by two-tailed unpaired Student’s t-test. K Immunostaining for tdT with E-CAD or CYP2E1 on the liver sections from mice treated with TAM or Oil. Scale bars, 100 µm
-
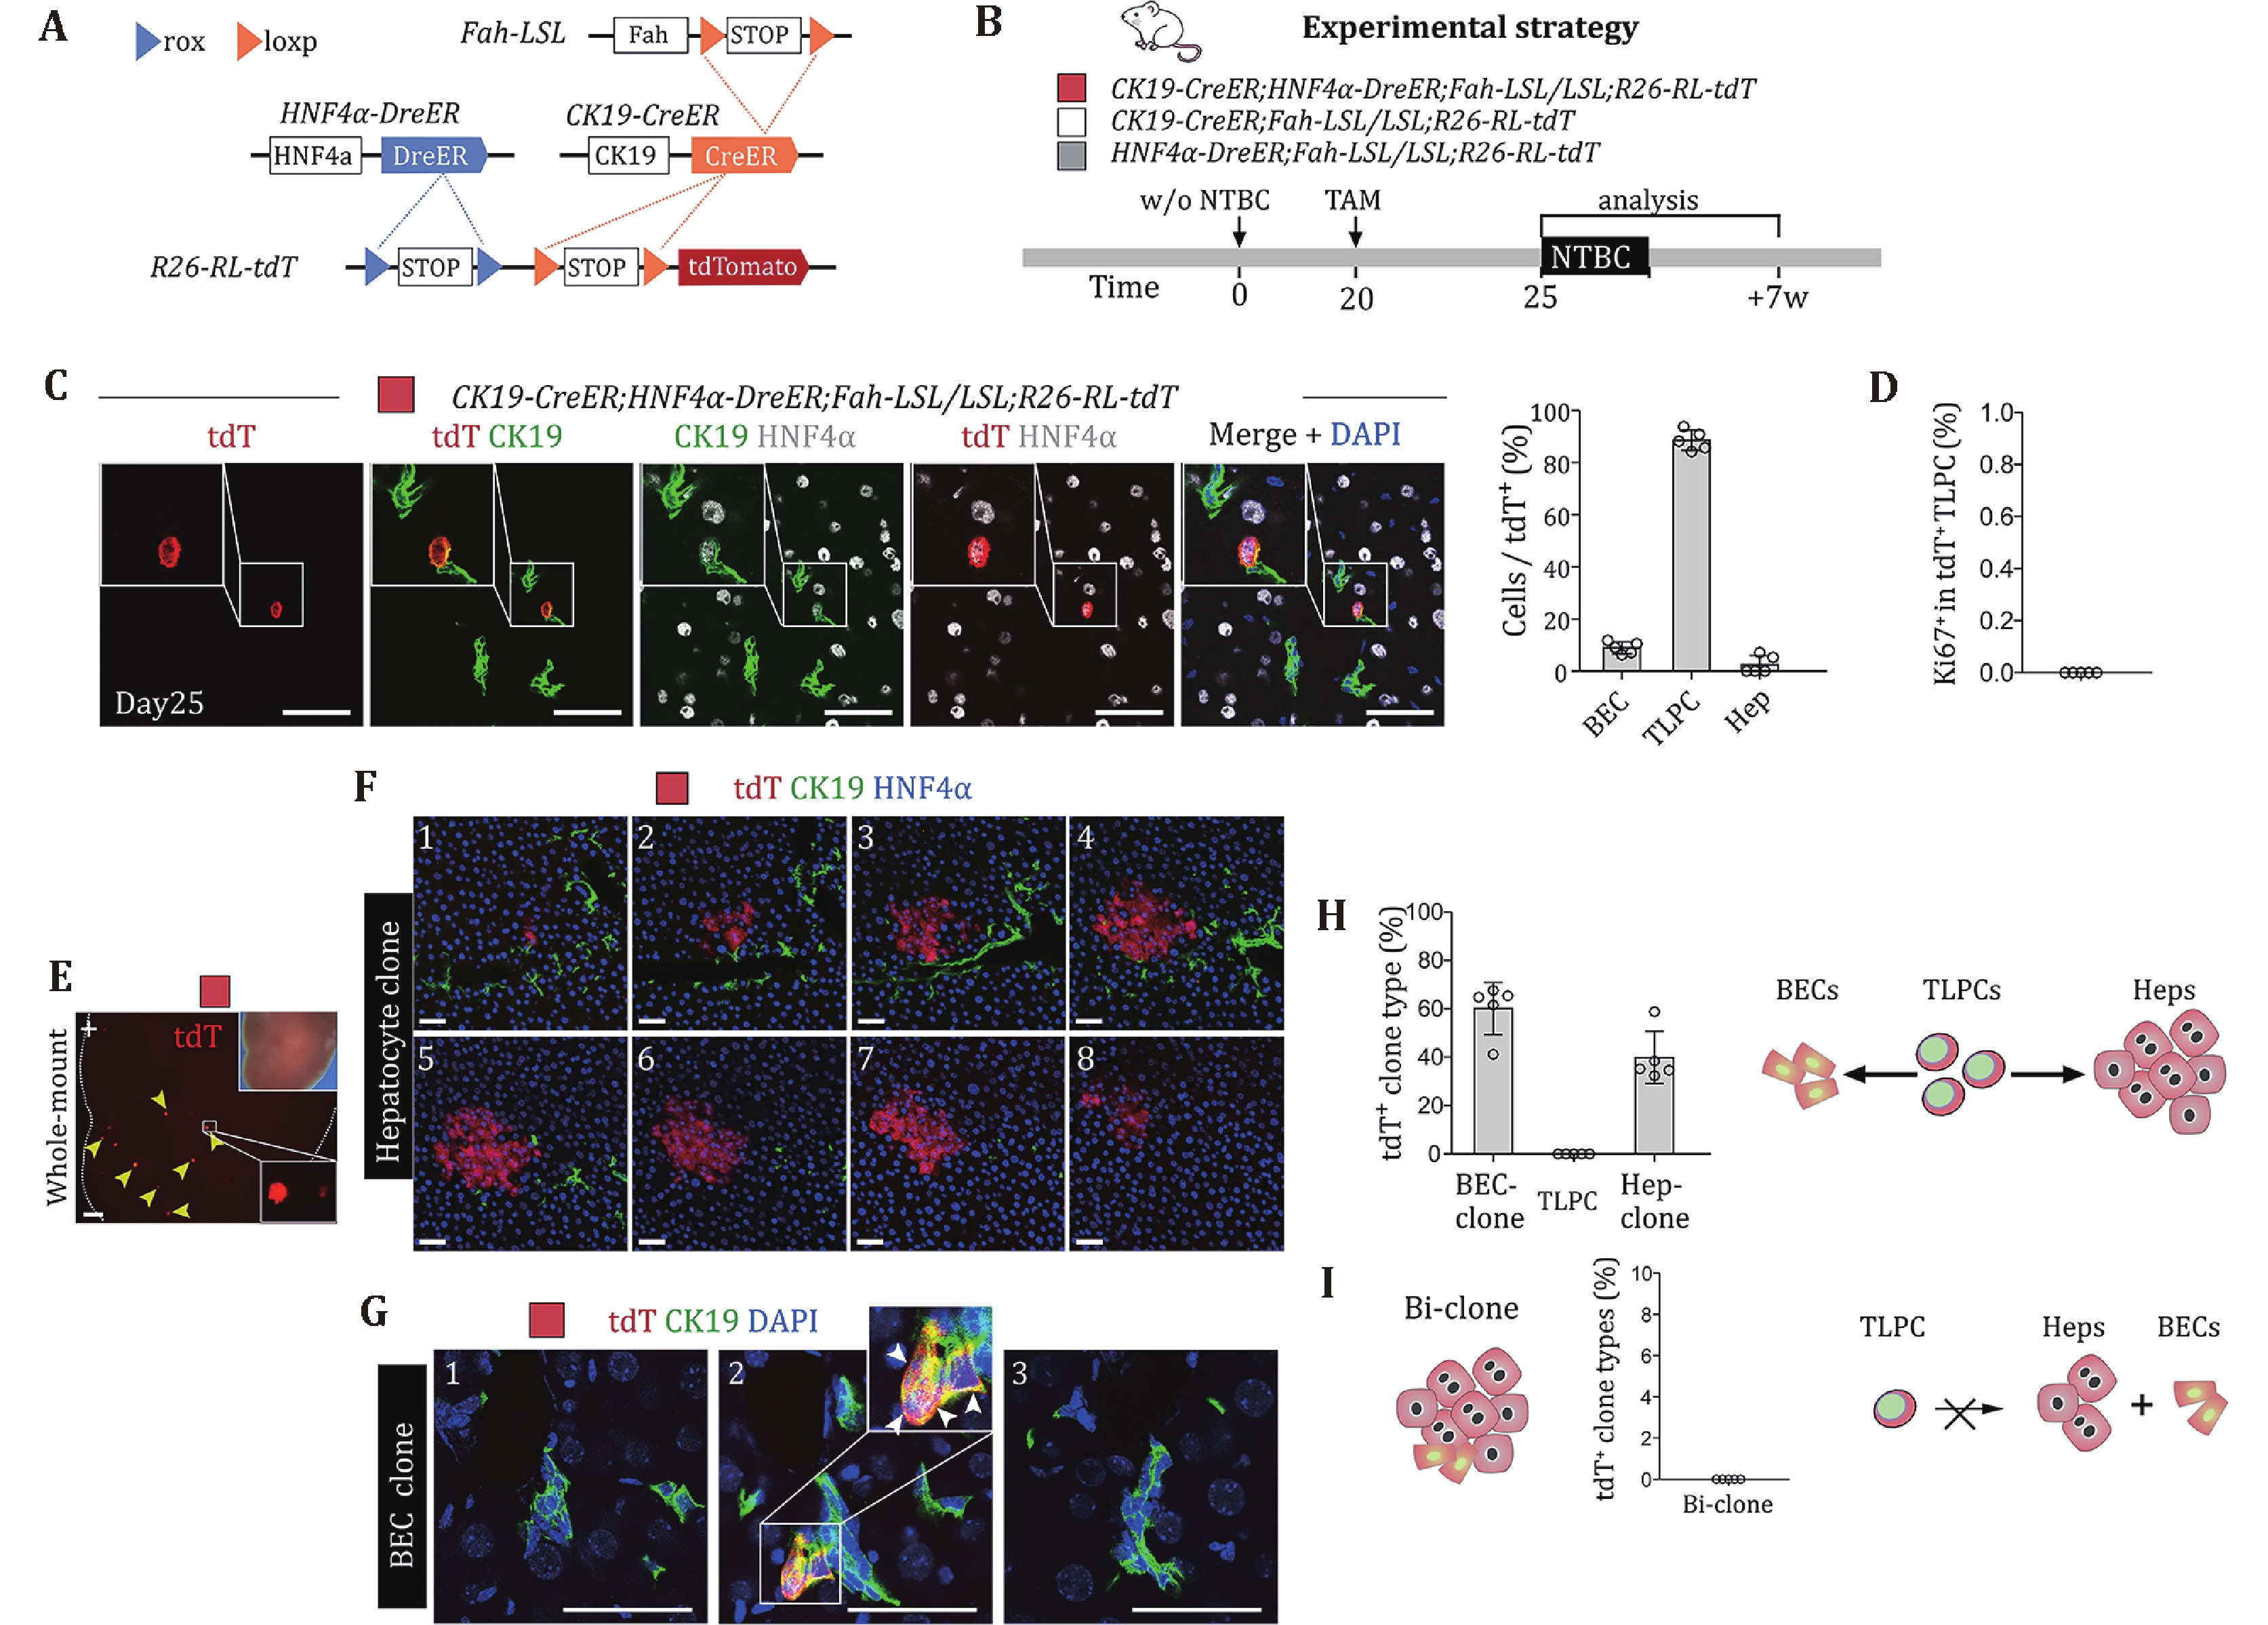
Figure 4. Biopotent TLPCs generate hepatocytes or adopt BEC fate during liver repair. A Schematic showing the strategy for TLPC lineage tracing. B Schematic showing experimental strategy. C Immunostaining for tdT, HNF4α and CK19 on liver sections collected at day 25 from CK19-CreER;HNF4α-DreER;Fah-LSL/LSL;R26-RL-tdT mice. Scale bars, 50 µm. Right panel shows the percentage of BECs, TLPCs and hepatocytes in tdT+ cells. Data represent mean ± SD; n = 5 mice; total 289 tdT+ cells were counted (BECs: 25; TLPCs: 258; hepatocyte: 6). D Percentage of Ki67+ cells in tdT+ TLPCs. Data represent mean ± SD; n = 5 mice. E Whole-mount tdT fluorescent liver images from indicated mice at 7 weeks after the first NTBC removal. Bright field images are shown as inserts. Arrows indicate tdT+ clones. Scale bars, 1 mm. F Immunostaining for tdT, HNF4α and CK19 on serial sections (20 µm) of livers collected at week 7 from CK19-CreER;HNF4α-DreER;Fah-LSL/LSL;R26-RL-tdT mice. Scale bars, 50 µm. G Immunostaining of tdT, and CK19 on serial liver sections (20 µm) collected at week 7 from CK19-CreER;HNF4α-DreER;Fah-LSL/LSL;R26-RL-tdT mice. Scale bars, 50 µm. White arrows indicate tdT+ BECs. H Percentage of tdT+ clones containing BECs, TLPCs and hepatocytes. Schematic on the right panel showing that TLPCs could give rise to hepatocytes and revert back to BECs. Data represent mean ± SD; n = 5 mice; total 480 tdT+ clones were counted. I Percentage of hybrid clone that consists of BECs and hepatocytes. Schematic showing that TLPCs could not give rise to hepatocytes and BEC simultaneously. Data represent mean ± SD; n = 5 mice
Figure
4 ,Table
4 个