-
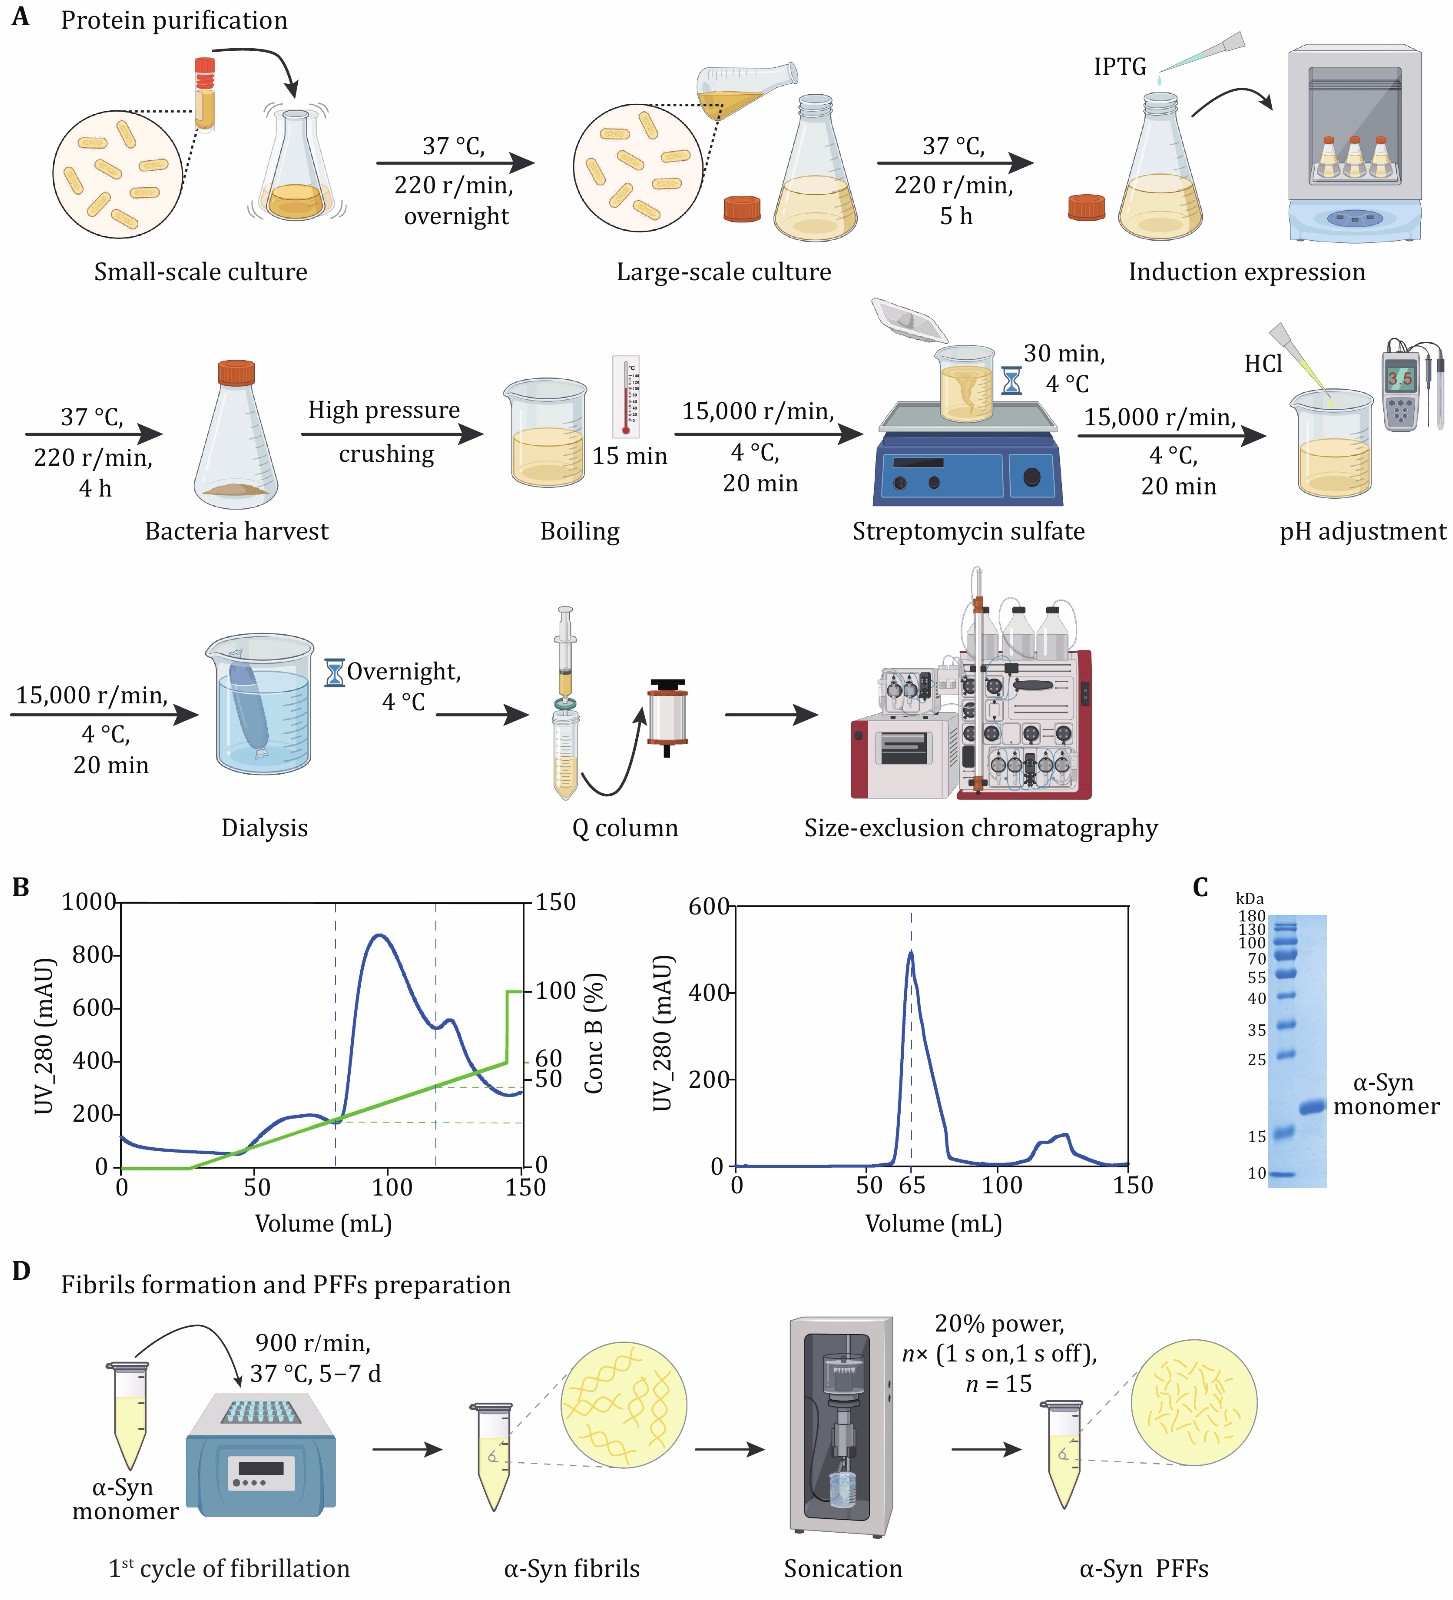
Figure 1. Expression and purification of α-syn. A The schematic diagram of α-syn expression and purification. Anion exchange chromatography and size exclusion chromatography are applied to protein purification. B The anion-exchange (left) and size exclusion (right) chromatographic purification of α-syn. α-Syn is collected when the concentration of Buffer B (green) is 20%–40% during ion exchange chromatography. C The result of SDS-PAGE after purification. The marker of protein (kDa) is labeled on the left of gel. D The schematic diagram of α-syn fibril and PFFs preparation
-
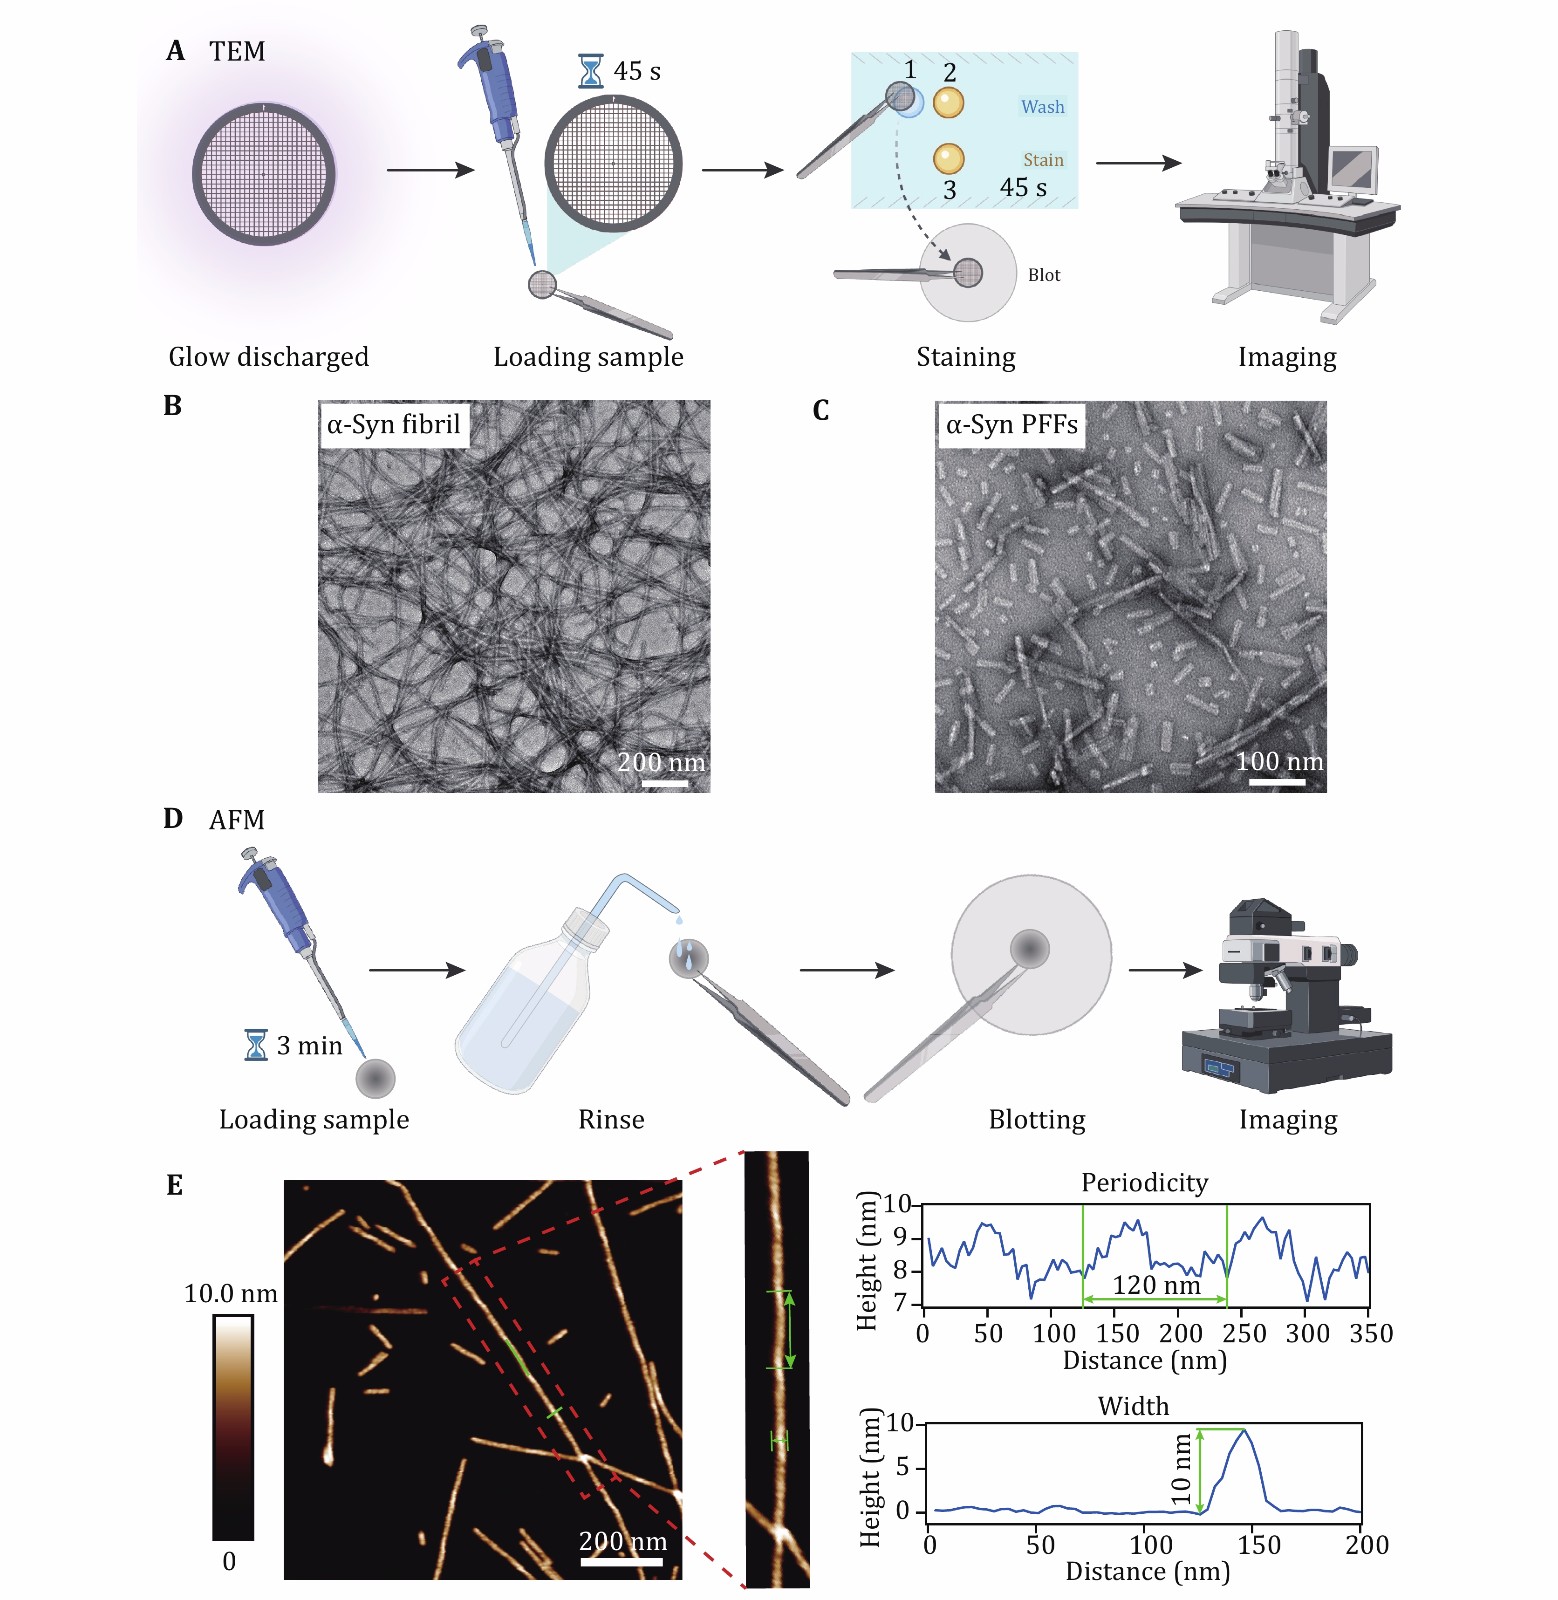
Figure 2. Characterization of α-syn fibril and PFFs by TEM and AFM. A Sample preparation for TEM imaging. B, C Negative-staining TEM images of α-syn fibrils (B) and α-syn PFFs (C), scale bar, 200 nm. D Sample preparation for AFM imaging. E Characterization of the helical parameters of the α-syn fibril by AFM. 2D AFM image is shown, scale bar, 200 nm. Analyses of the cross section and along the fibril are indicated with blue lines and highlighted with green lines
-
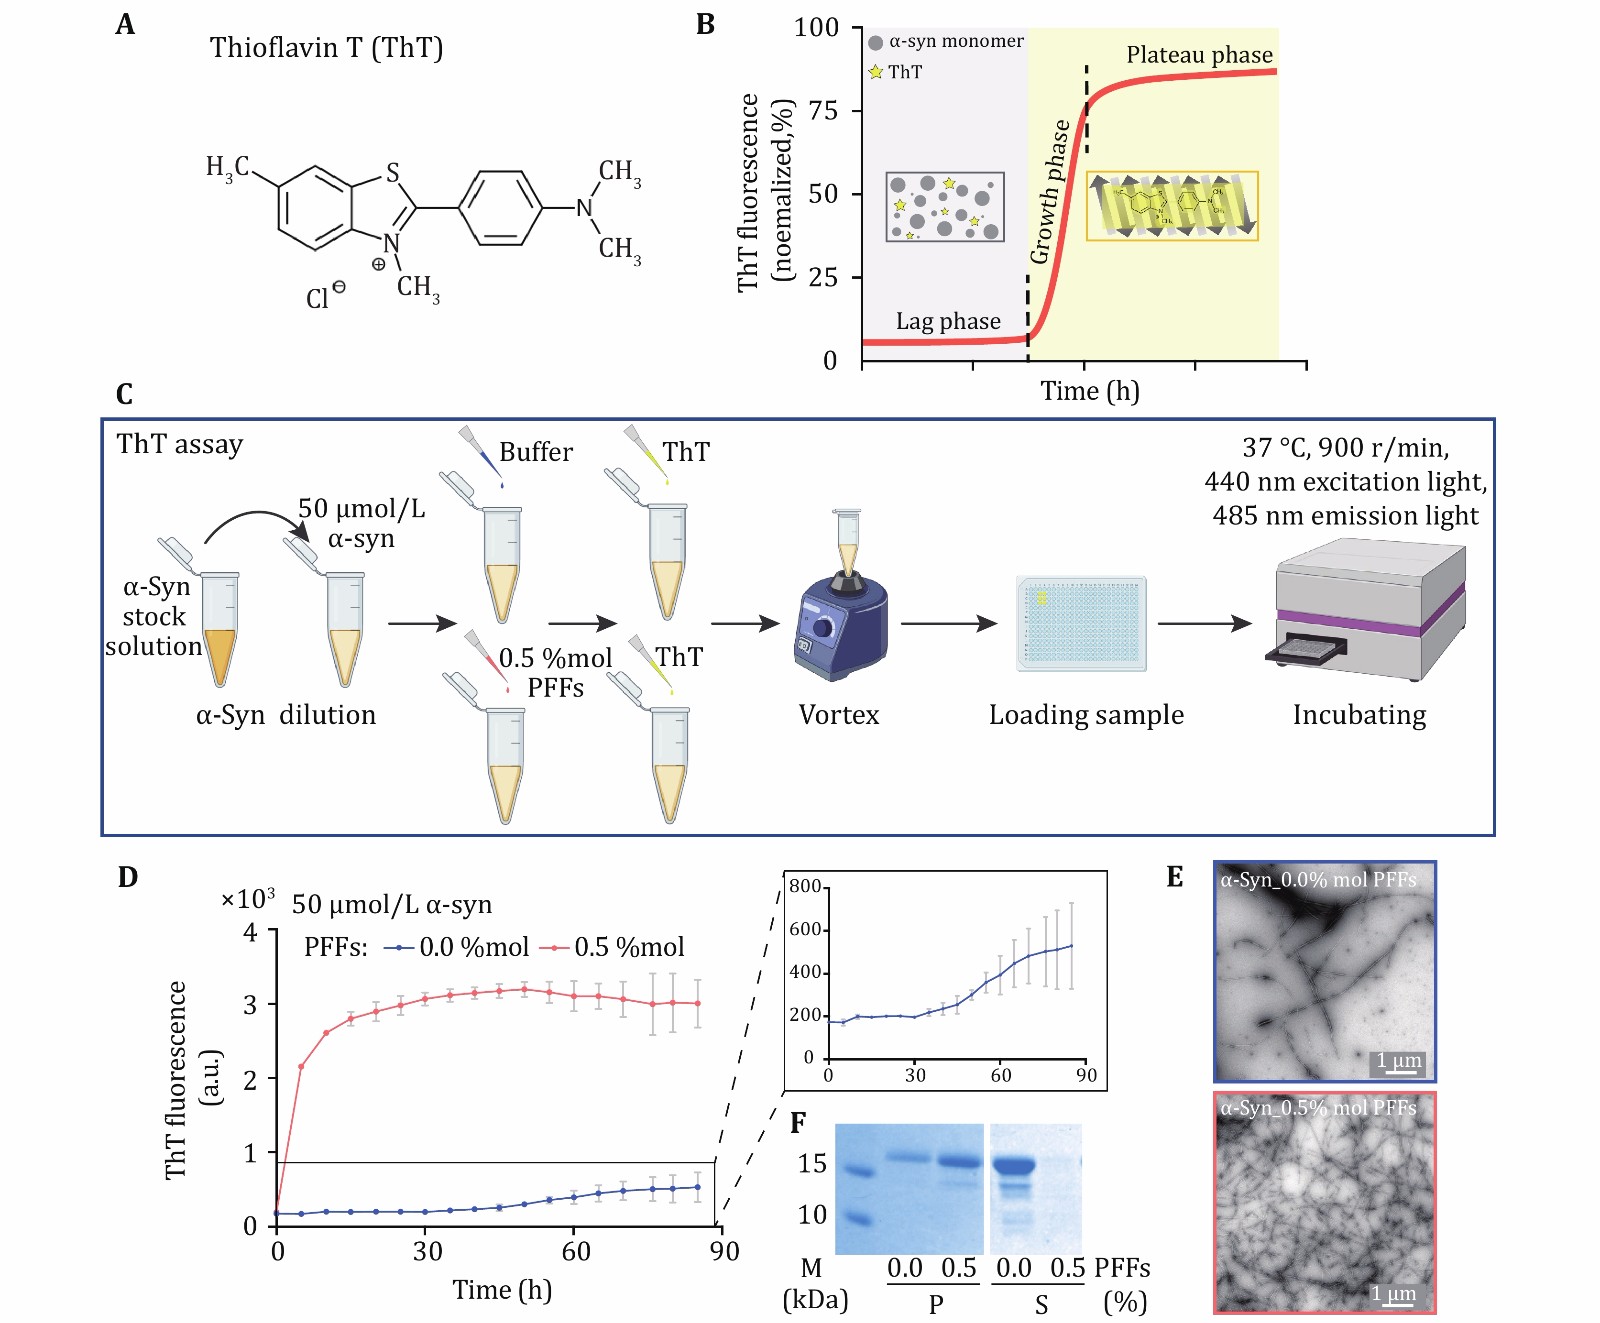
Figure 3. ThT kinetics assay of α-syn fibrillation. A The structural formula of ThT molecule. ThT binds to the β-sheet structure of amyloid fibril which results in florescence emission at 485 nm. B As amyloid protein aggregates into fibrils, the fluorescence signals increase as well. The aggregation process can be divided into three phases including the lag phase, the growth phase and the plateau phase. In the initial lag phase, amyloid protein samples may self-assemble into different amyloid oligomers without forming fibrils. Then, monomers aggregate into fibrils quickly during the growth phase. Fibril formation is completed during the plateau phase. C The schematic diagram of ThT assay. α-Syn PFFs act as the seed to trigger the protein aggregation. D ThT kinetics assay for α-syn monomer seeded (red) or not seeded (blue) by the PFFs. Notice that, in the presence of PFFs as seeds, α-syn monomer directly enters the growth phase for fibrillation. The concentration of PFFs is indicated. The aggregation curve of α-syn monomer is magnified. Data shown are mean ± SD, n = 3 individual independent samples. E The samples collected at the end of the ThT assay were imaged by TEM, scale bar: 1 µm. F The pellet (P) fraction (left) and supernatant (S) fraction (right) of ThT samples after centrifugation are loaded on SDS-PAGE gel, respectively
-
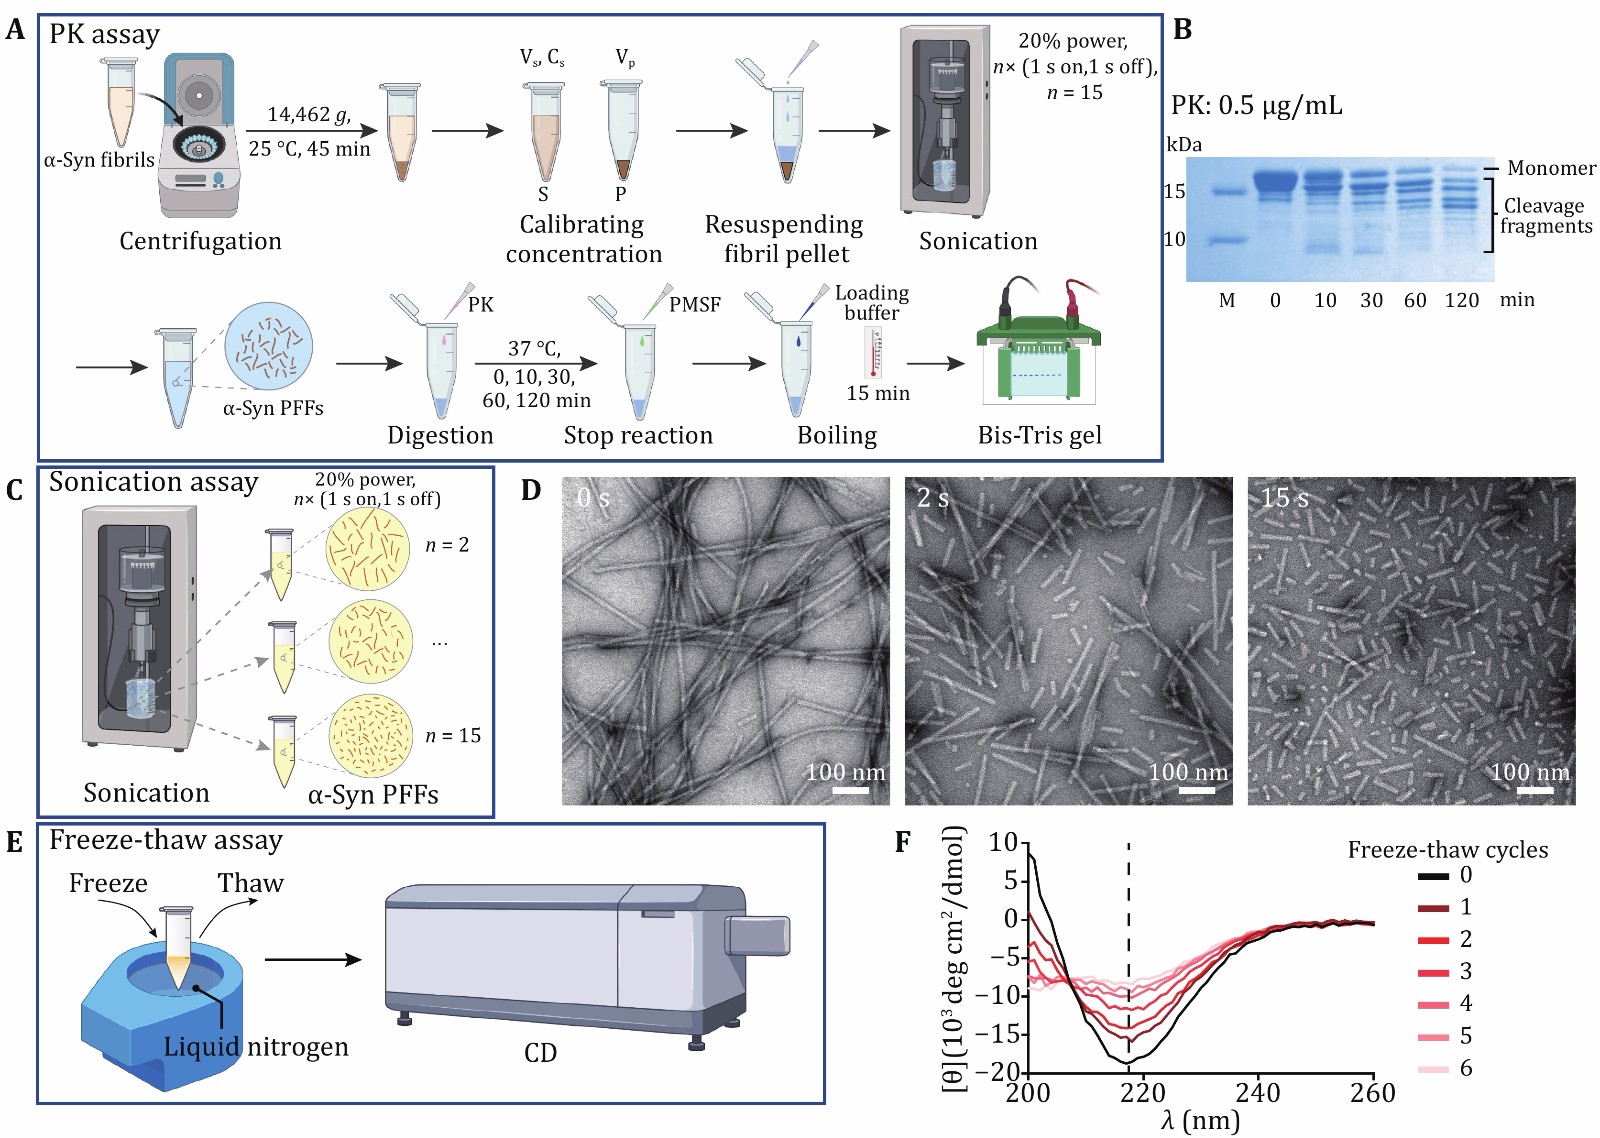
Figure 4. Characterization chemical and physical stability of α-syn PFFs. A The schematic diagram of PK digestion assay. S, supernatant; P, pellet; Vs, volume of supernatant; Cs, concentration of supernatant; Vp, volume of pellet. B Proteolytic digestion of α-syn PFFs at several time points, including 0, 10, 30, 60 and 120 min. C The schematic diagram of sonication assay. D Representative TEM images of α-syn PFFs by sonicated for n× (1 s on, 1 s off), n = 0, 2, 15, scale bar: 100 nm. E, F The schematic diagram (E) and CD spectra (F) of the freeze-thaw assay. The CD signal at 218 nm which represents the β-sheet content is measured and compared between different cycles. The number of freeze-thaw cycles is marked on the right side of the graph. Note, the fibril tested by CD is one α-syn mutant fibril strain
Figure
4 ,Table
1 个