-
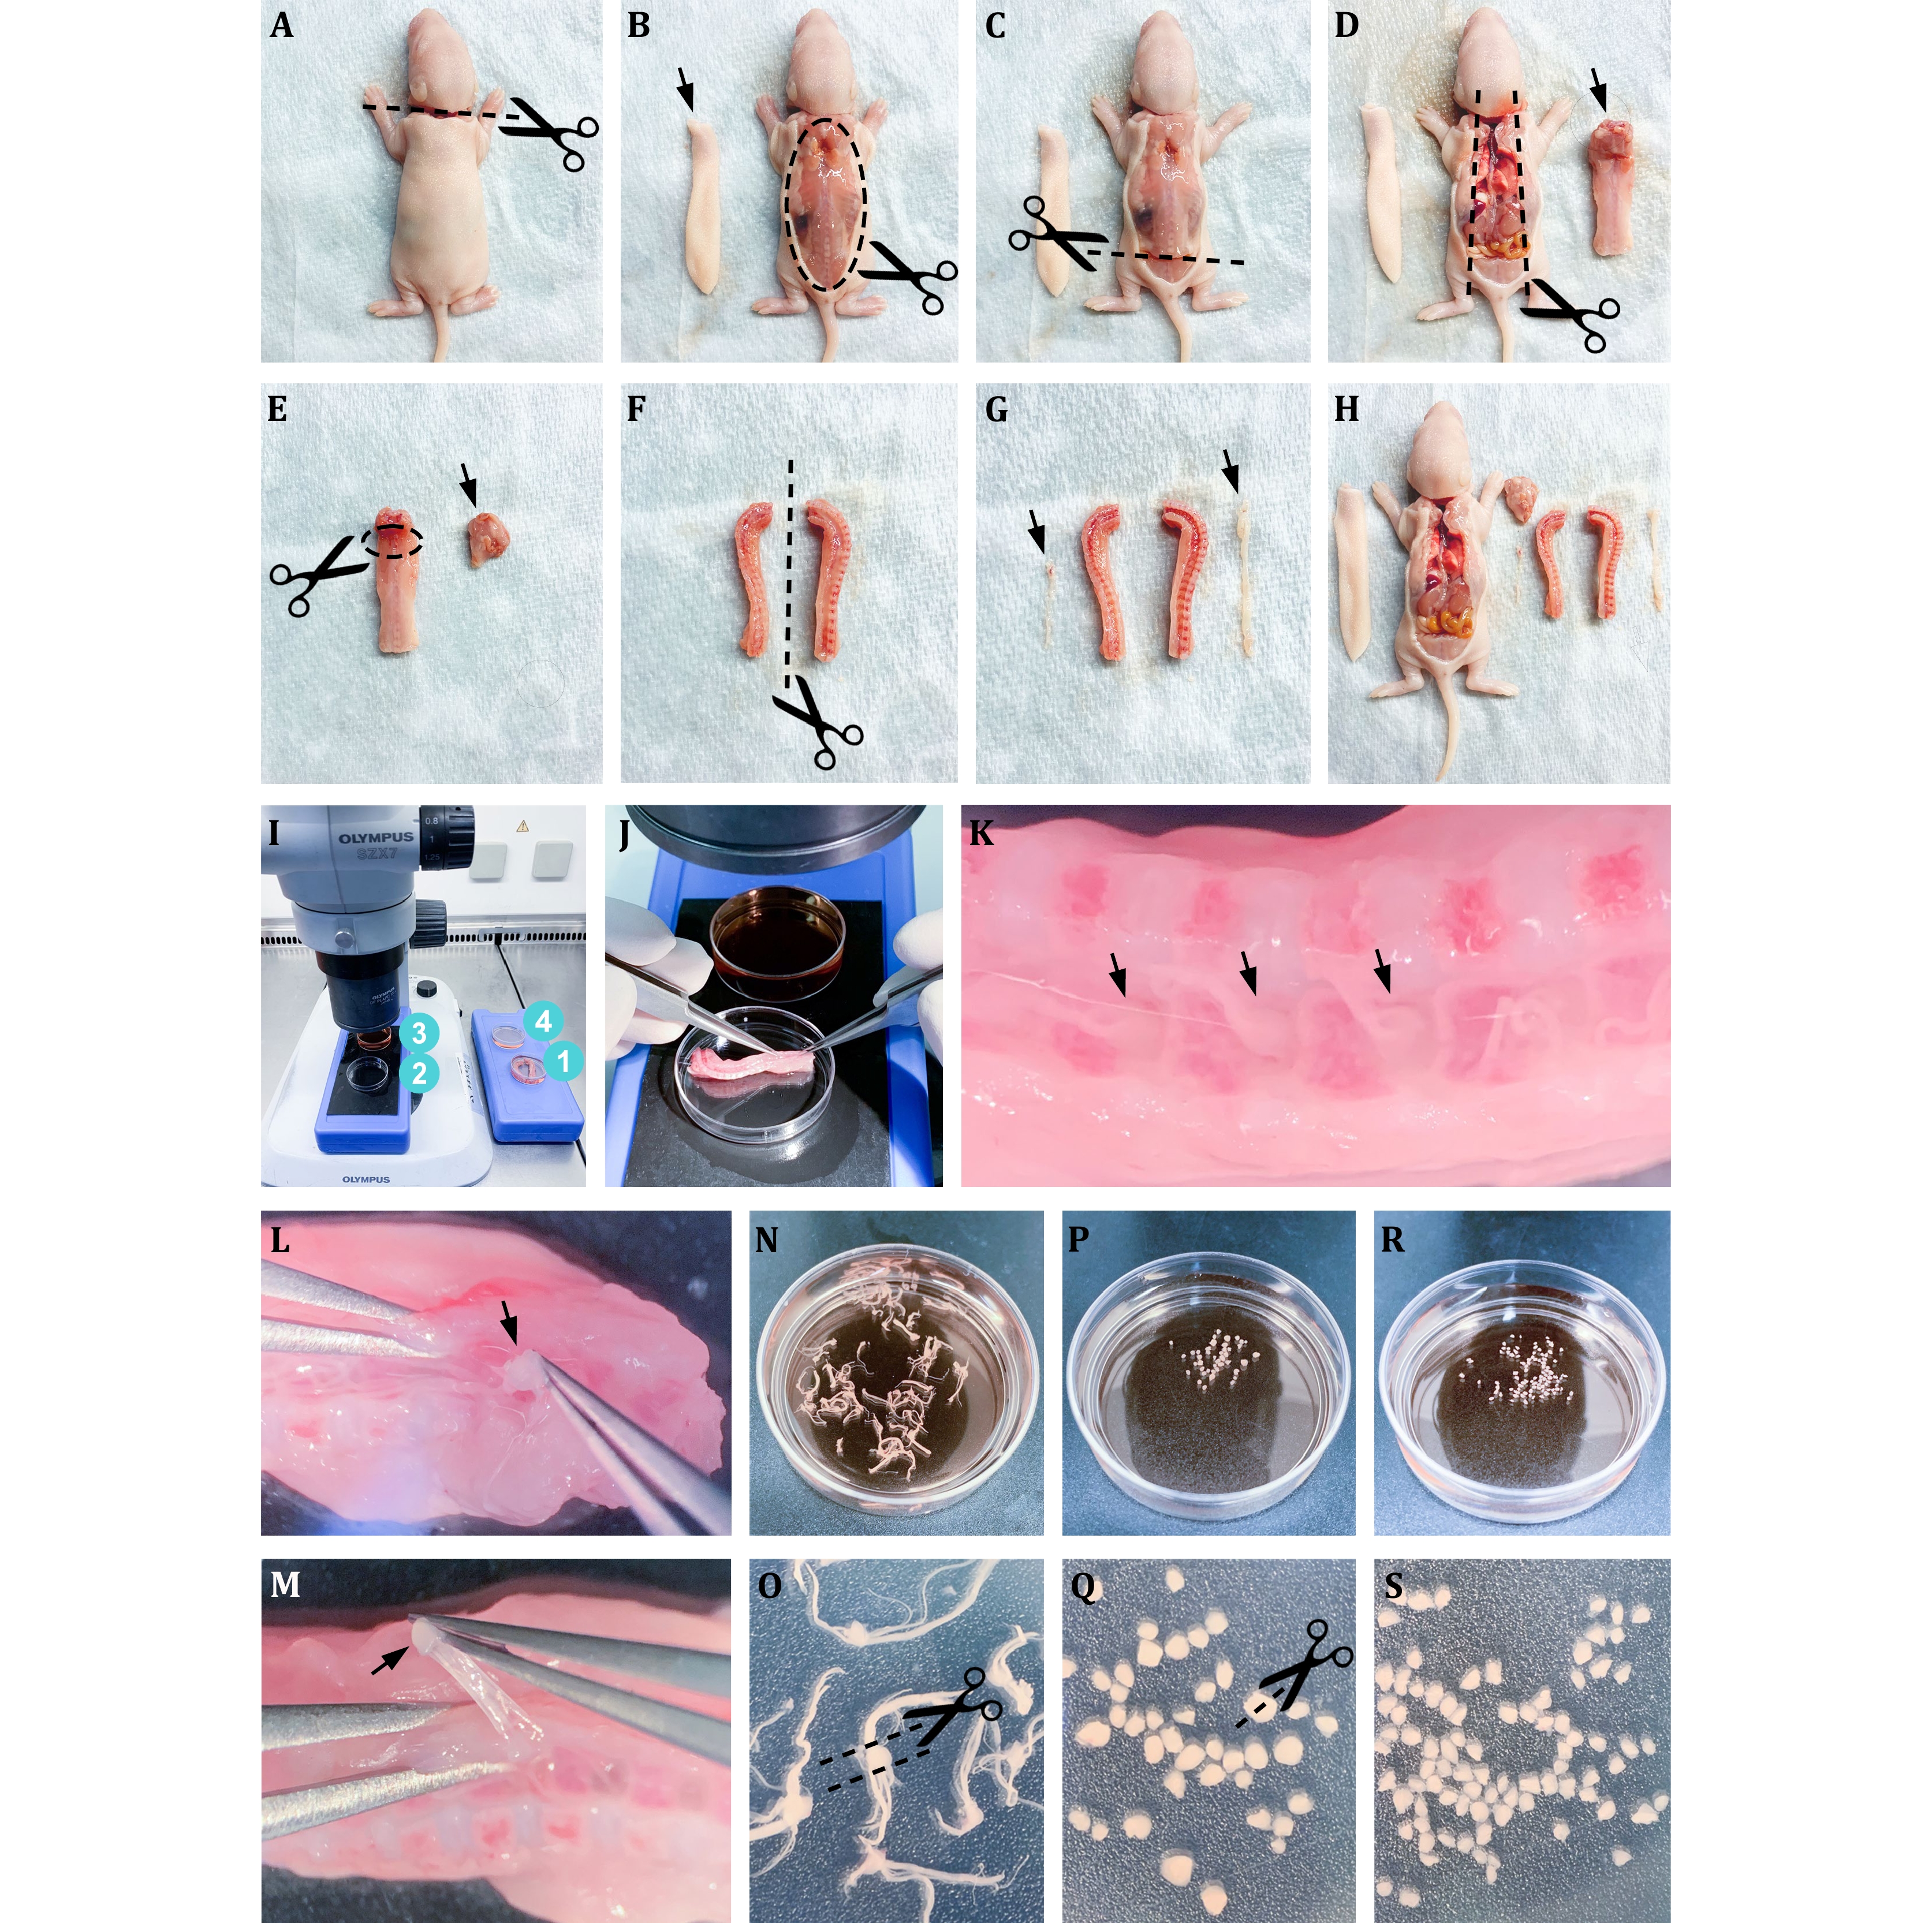
Figure 1. Images show each step of isolating DRG neurons from postnatal 5-day Sprague-Dawley rats. See more details in Step 2
-
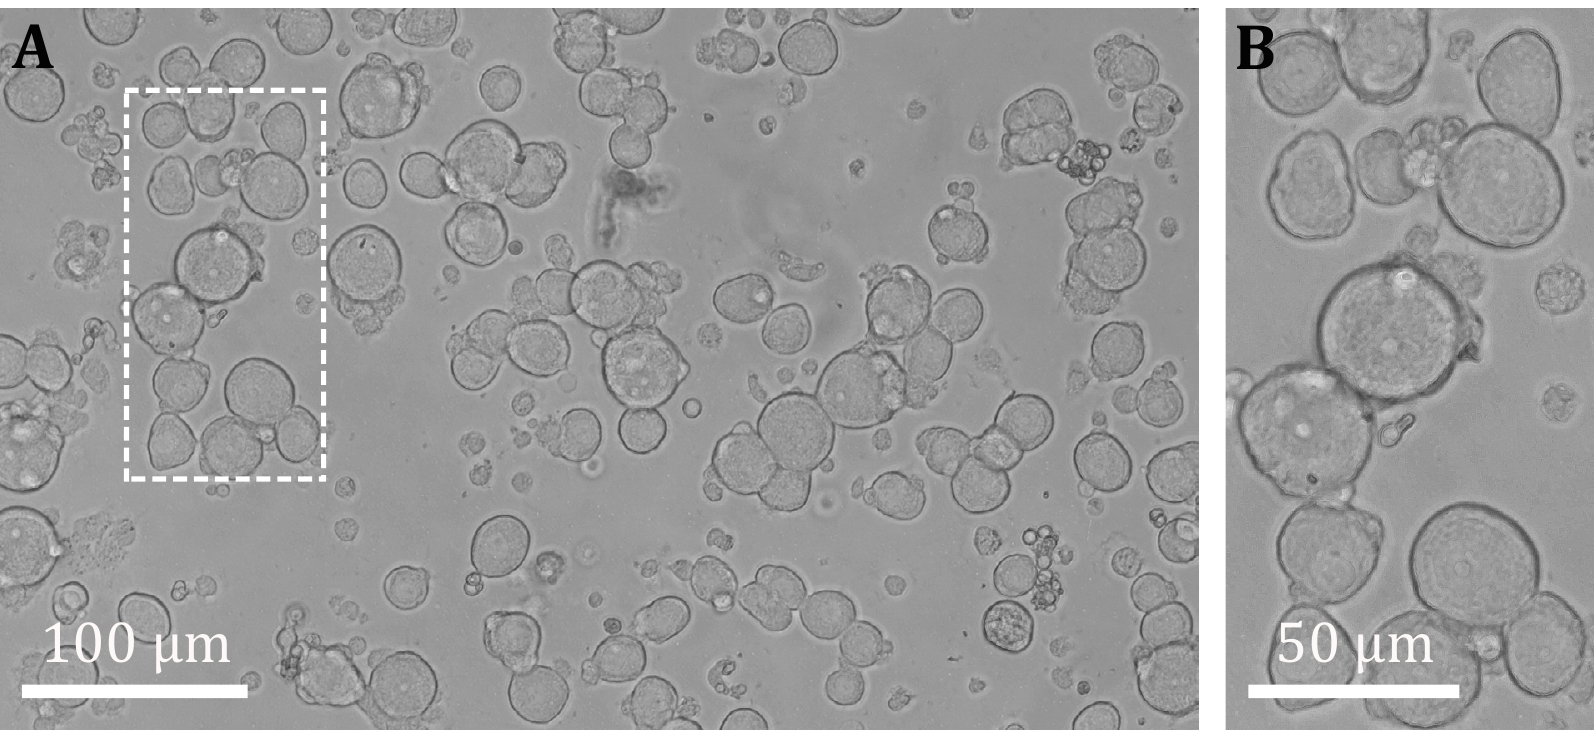
Figure 2. Images show acutely isolated DRG neurons (after ~2 h culture). A Acutely isolated DRG neurons. B An enlarged image from Panel A
-
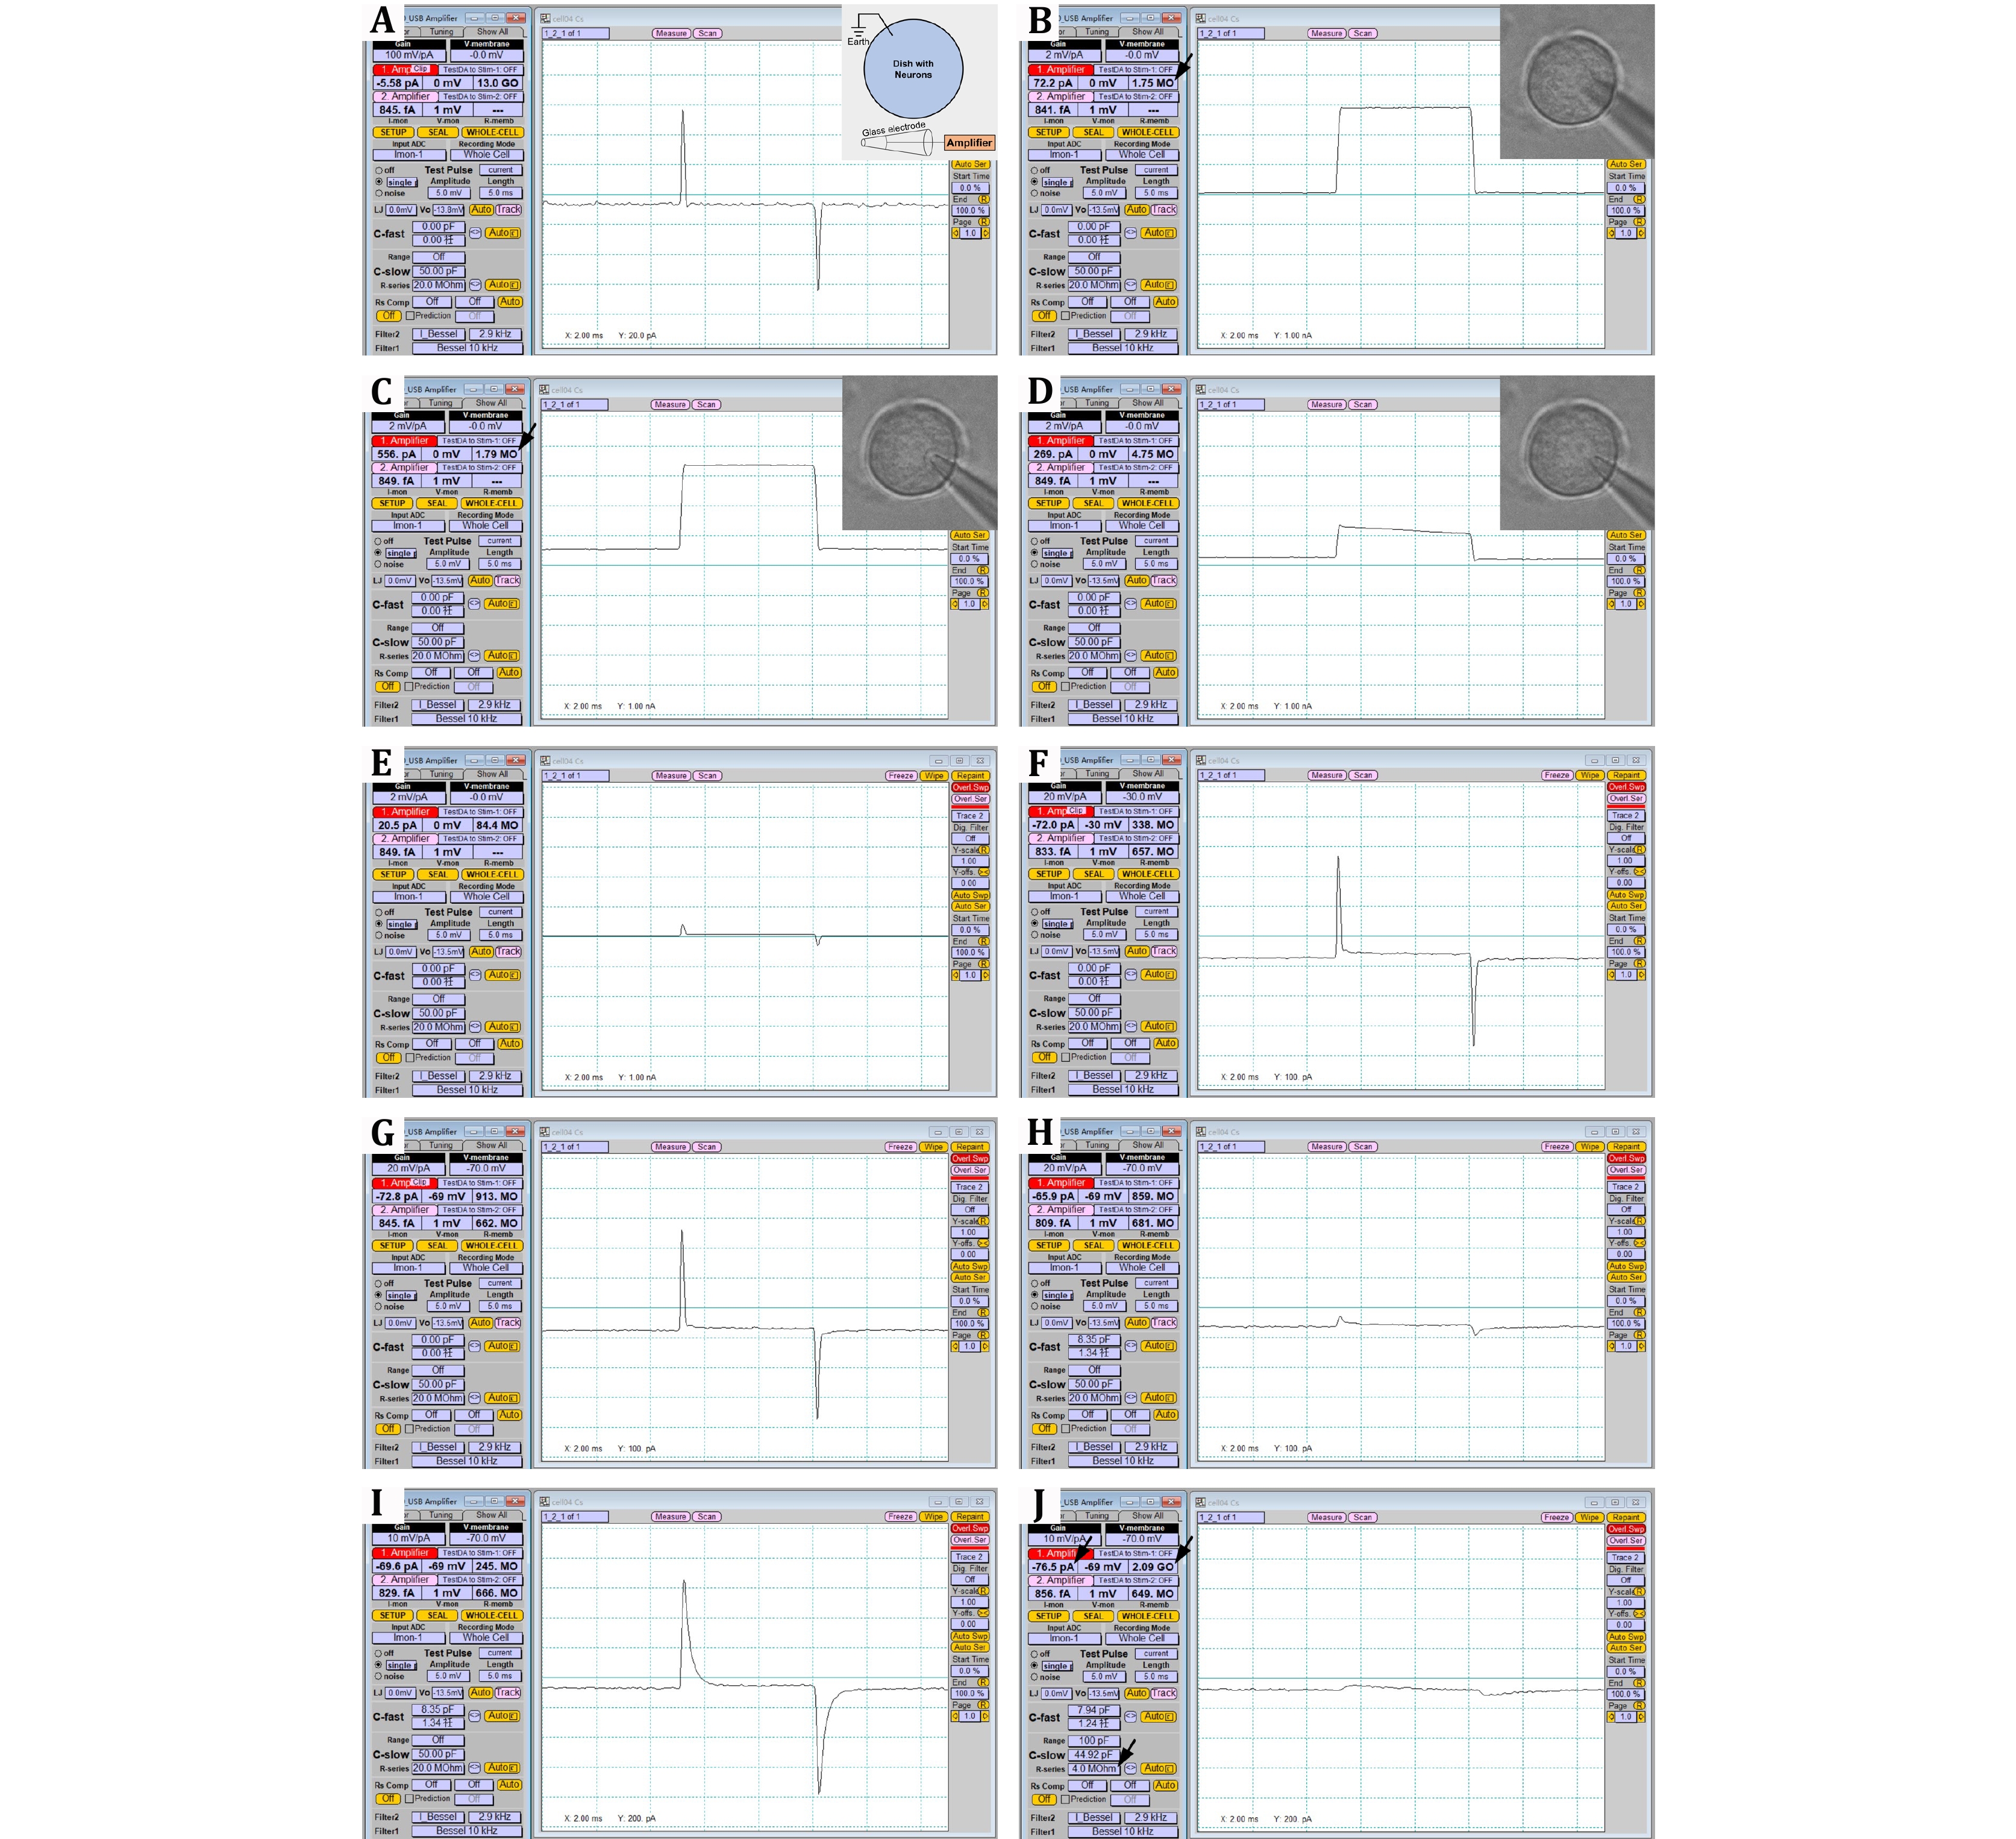
Figure 3. Images show the PatchMaster software windows of each step of the whole-cell patch-clamp recording mode. The insert in Panel A is a schematic diagram of the patch-clamp setup. The inserts in Panels B–D are photographs showing the relative position of a patch-clamp electrode and the DRG neuron. See more details in Step 5
-
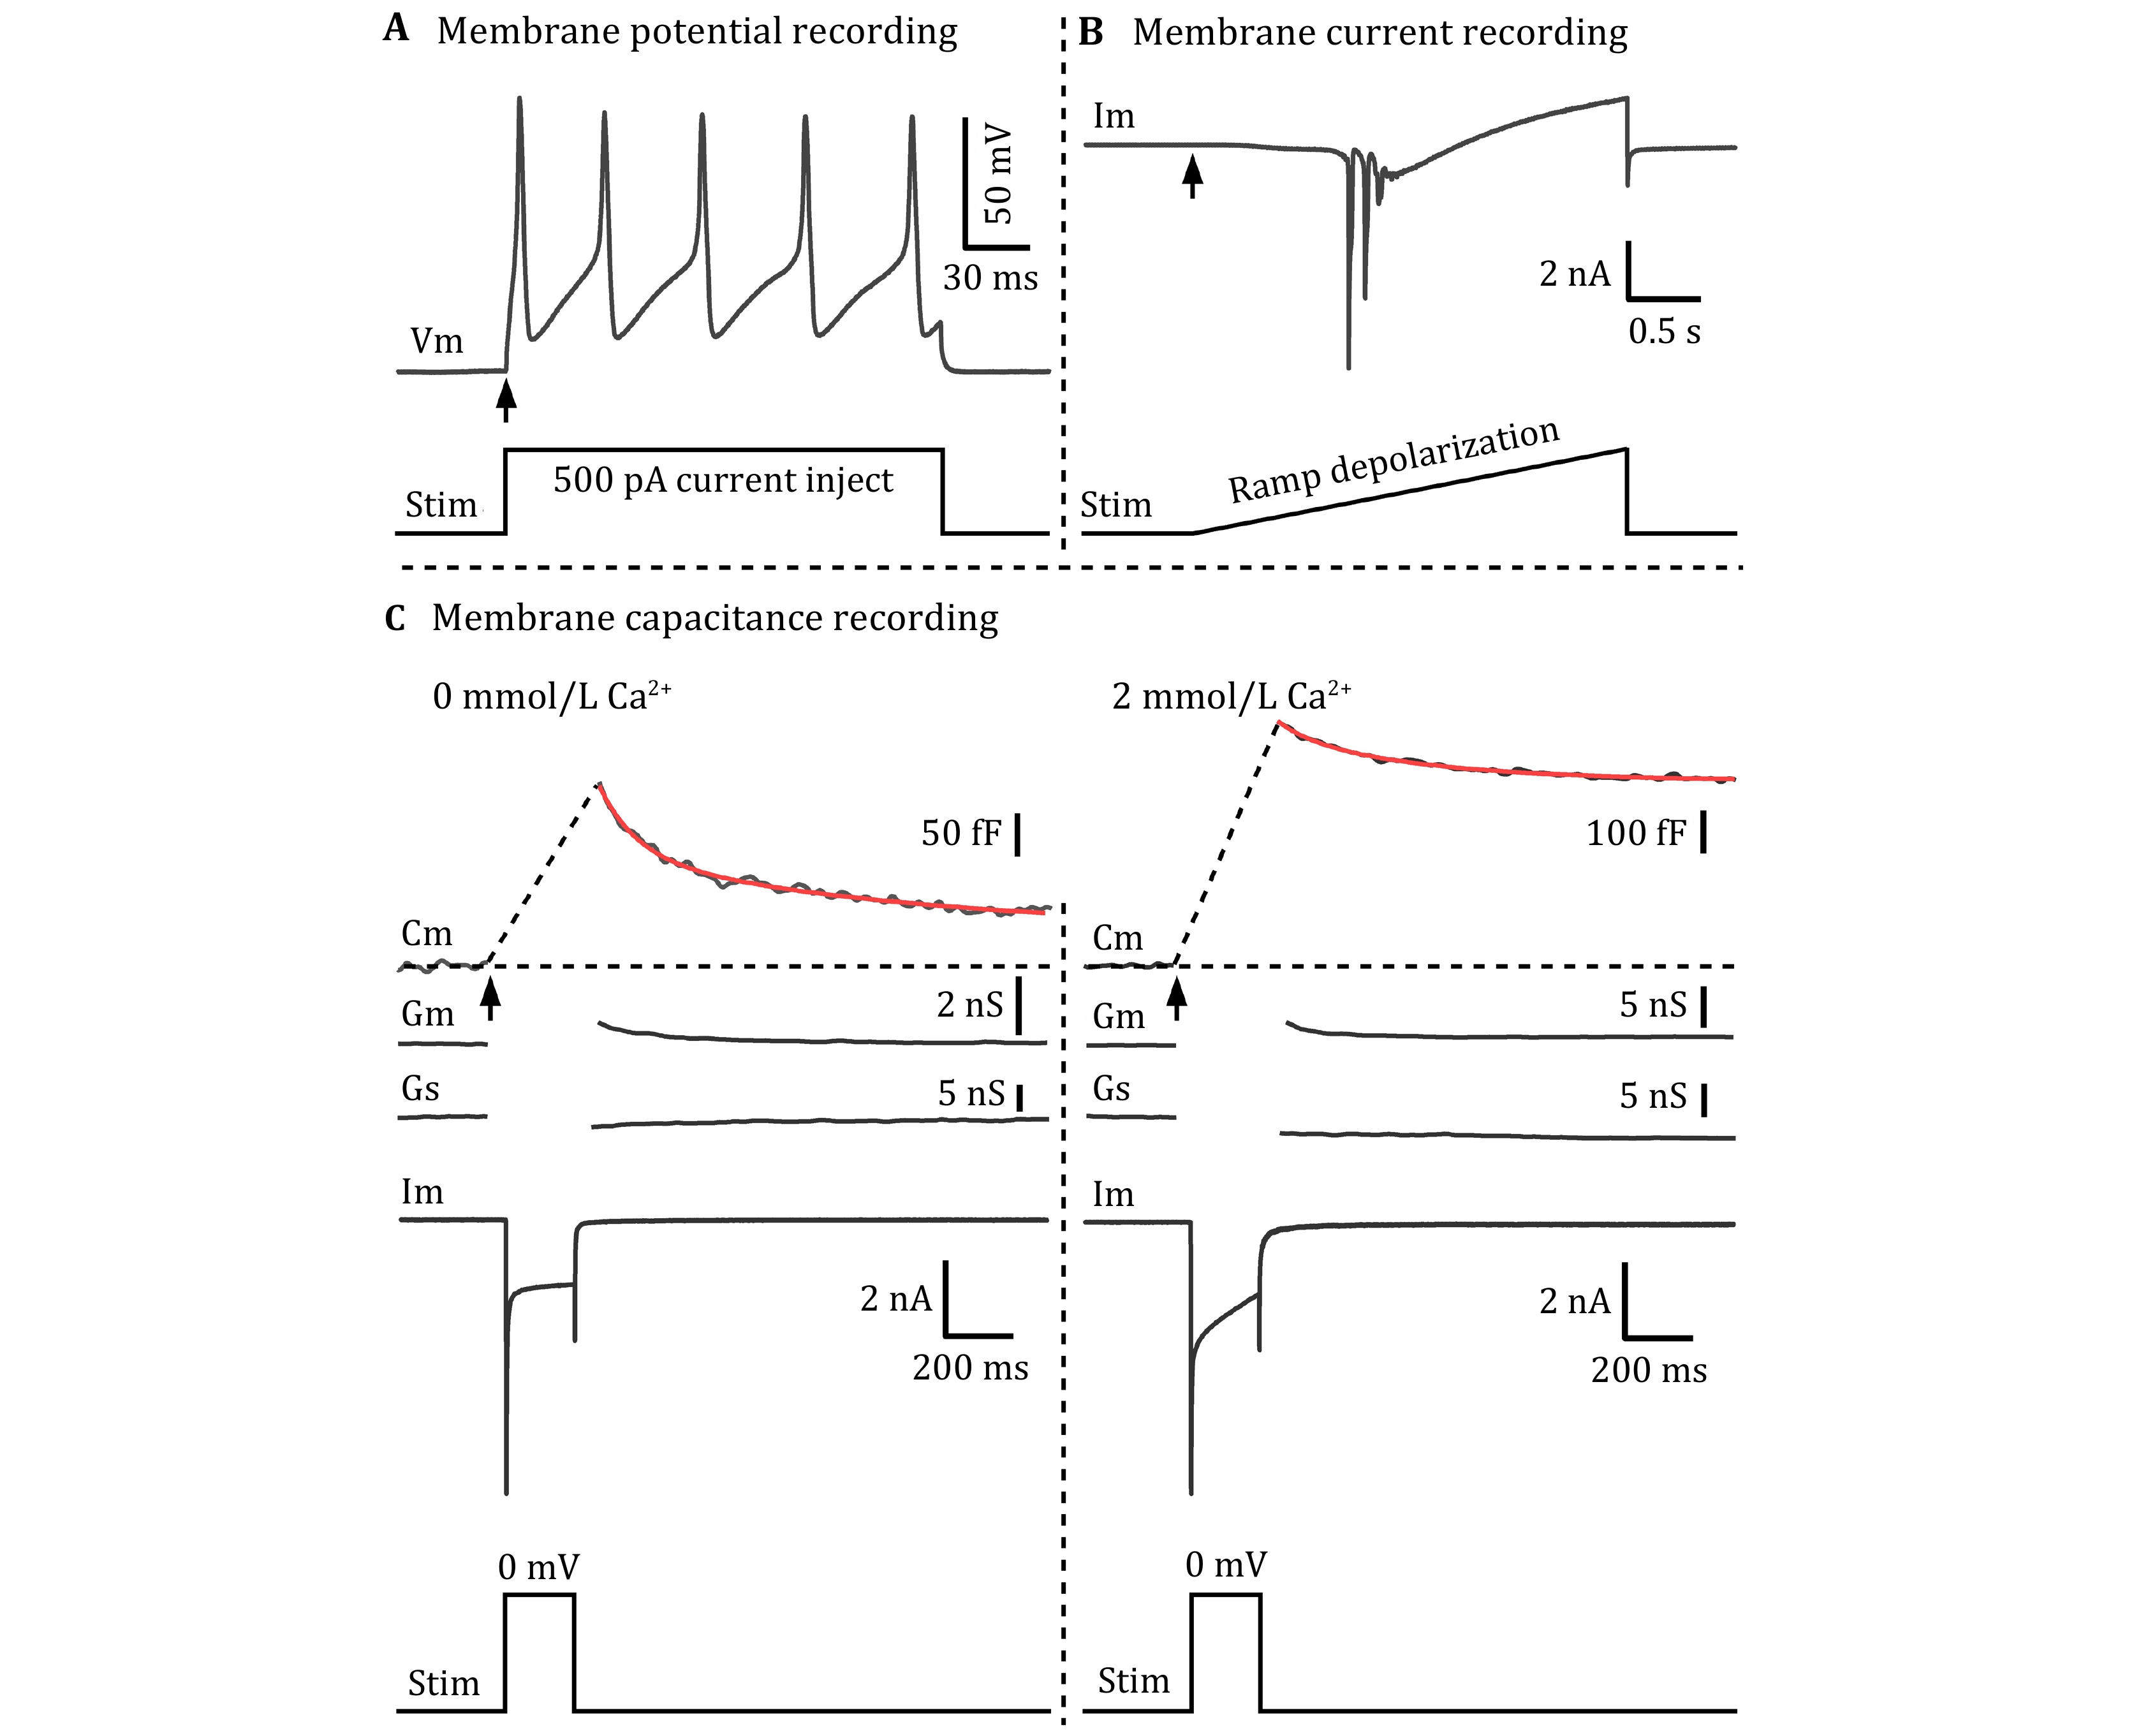
Figure 4. The action potentials, currents, and membrane capacitance signals from acutely isolated DRG neurons. A Membrane potential (Vm) signals (Upper), evoked by 500 pA current injection (Lower protocol, stim). B Membrane current (Im) signals (Upper), evoked by ramp depolarization (Lower protocol, stim). C Membrane capacitance (Cm, Upper) signals, evoked by 200 ms depolarization from –70 mV to 0 mV (Lower protocol, stim), from Ca2+-free solution (Left) and 2 mmol/L Ca2+-containing solution (Right), respectively. The Gm and Gs reflect the quality of capacitance recording, and Im is the current signal (Middle)
Figure
4 ,Table
0 个