-
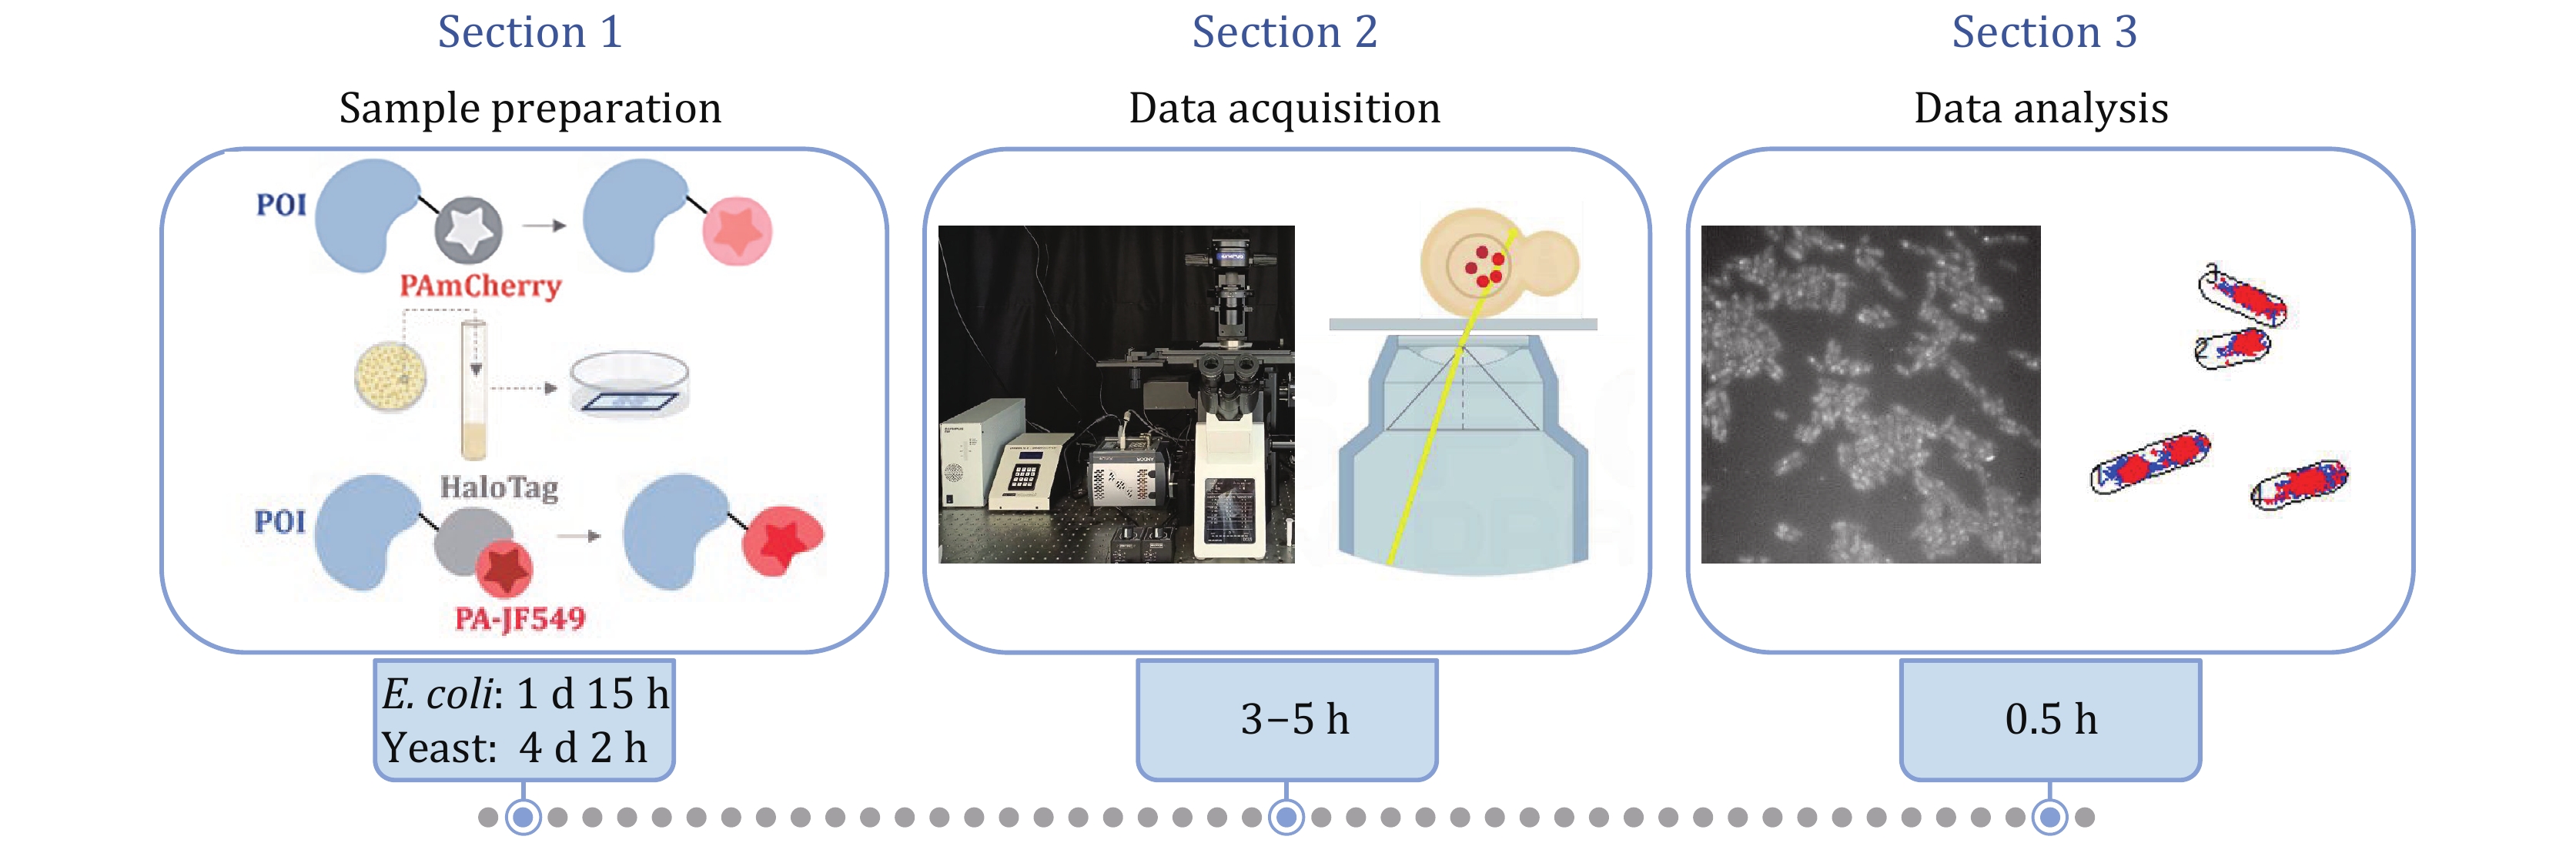
Figure 1. General schematic of the protocol
-
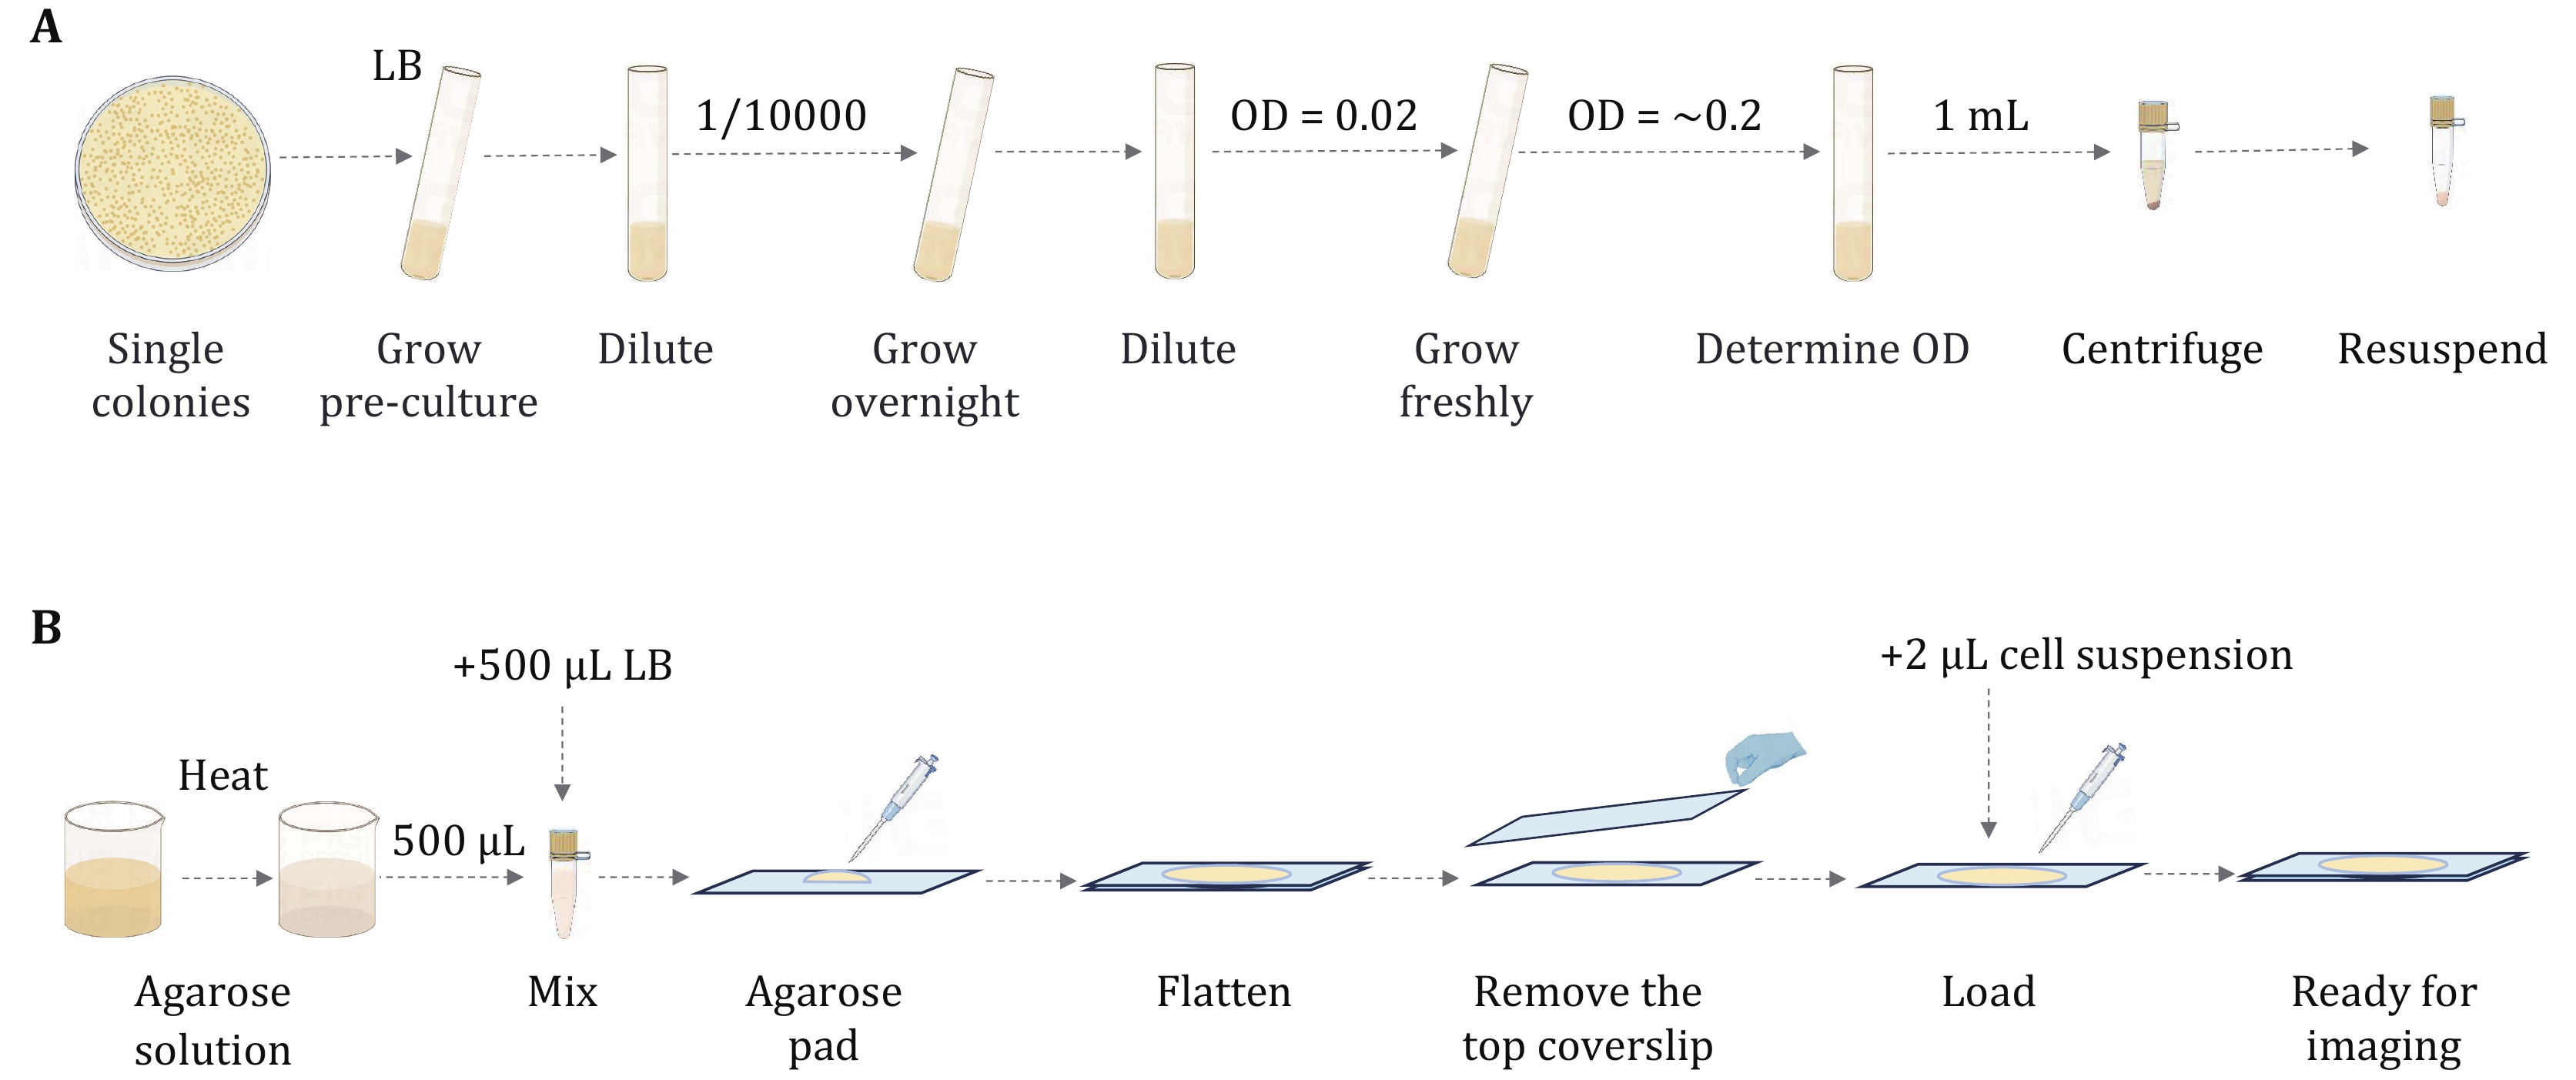
Figure 2. Illustration of steps for culturing E. coli for single-molecule imaging. A After cultivating E. coli to the early exponential growth stage, centrifuge and resuspend the cells. B Preparation of the microscope slides by agarose pad
-
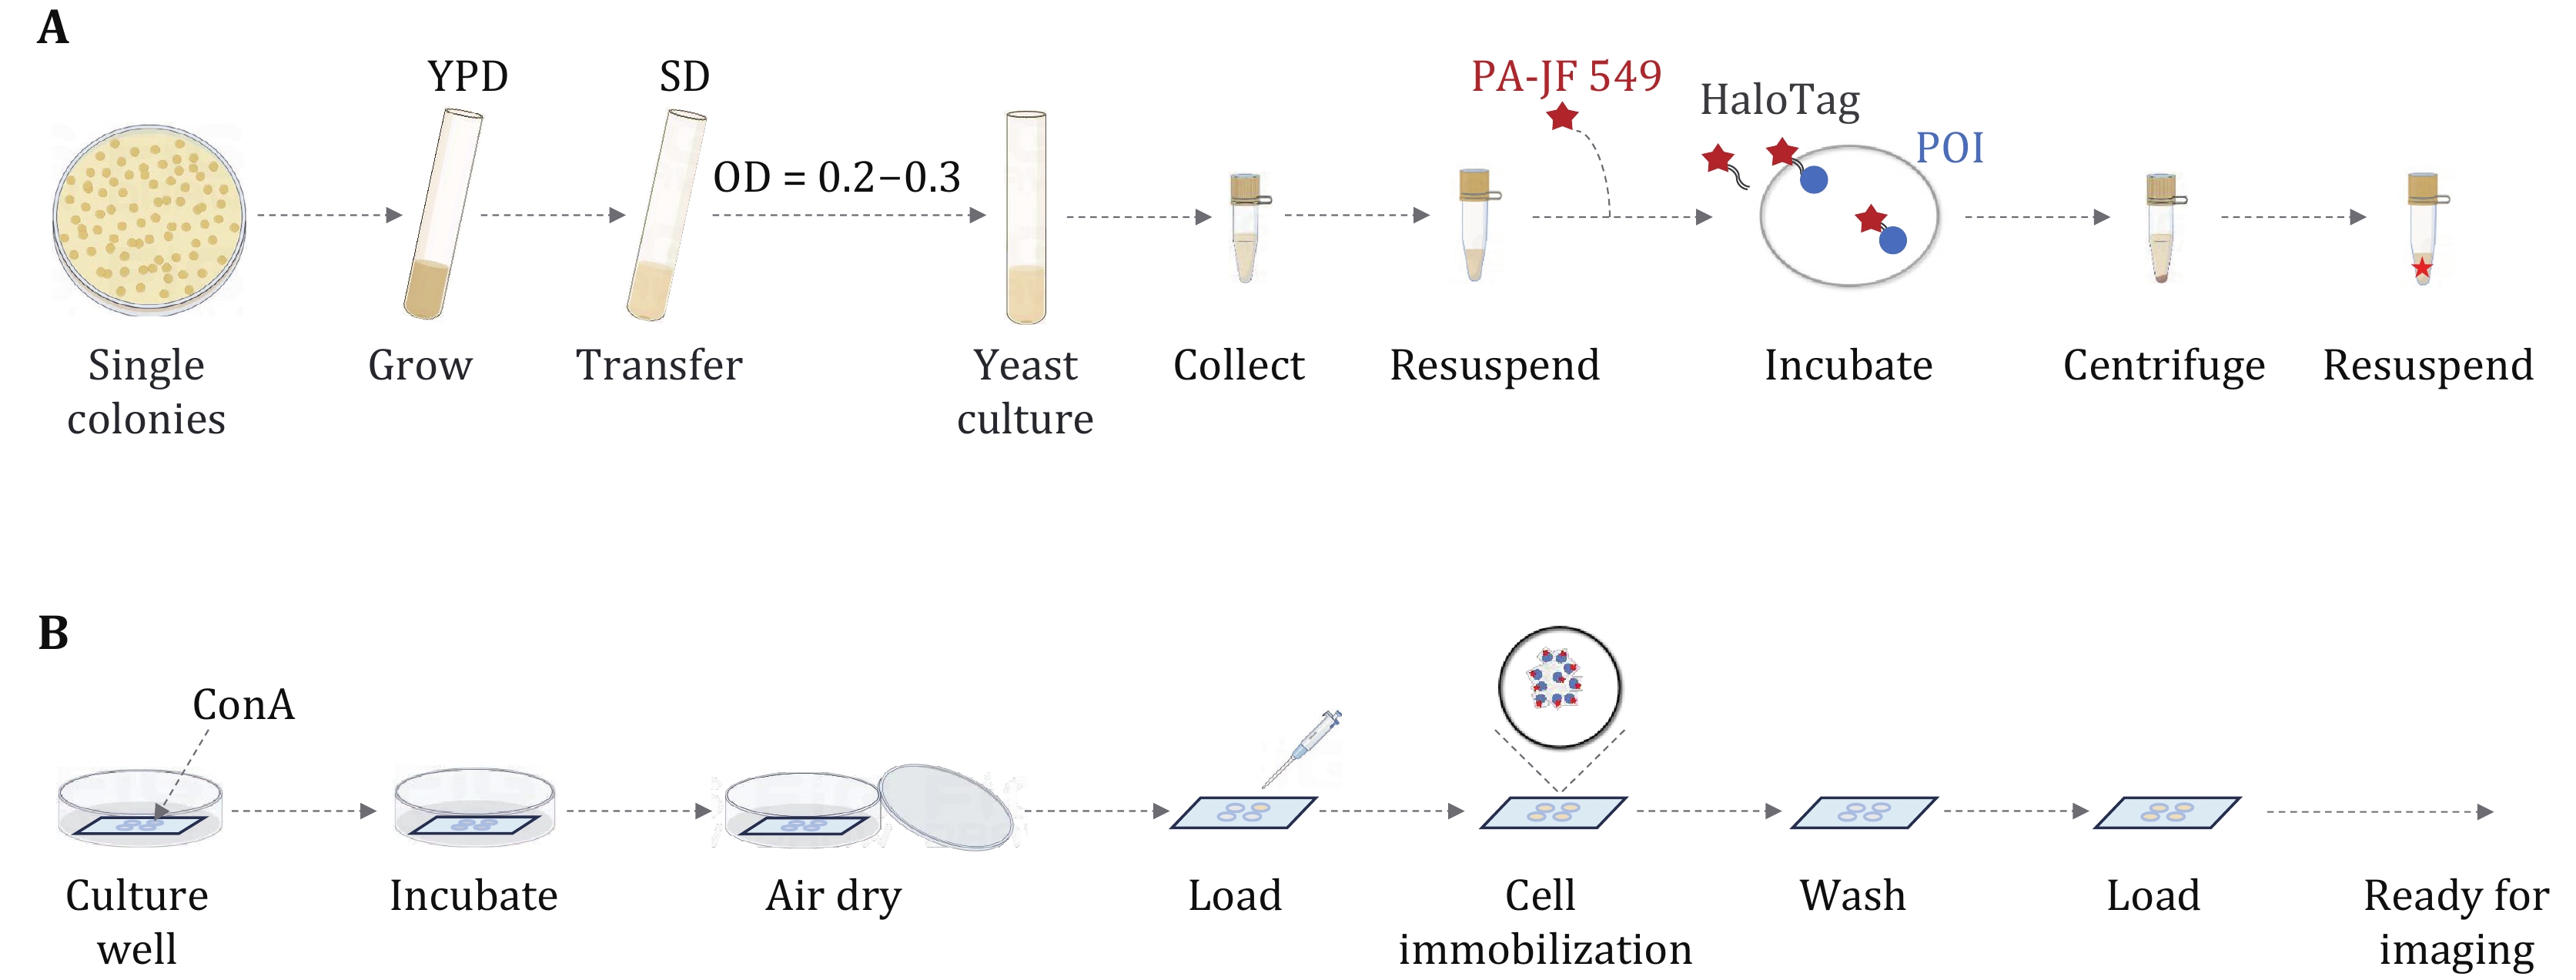
Figure 3. Procedure for labeling Halo tag with a fluorescent ligand in living yeast cells. A Culture the yeast cells to the exponential growth stage. B Coat the coverslips with ConA and prepare the imaging sample
-
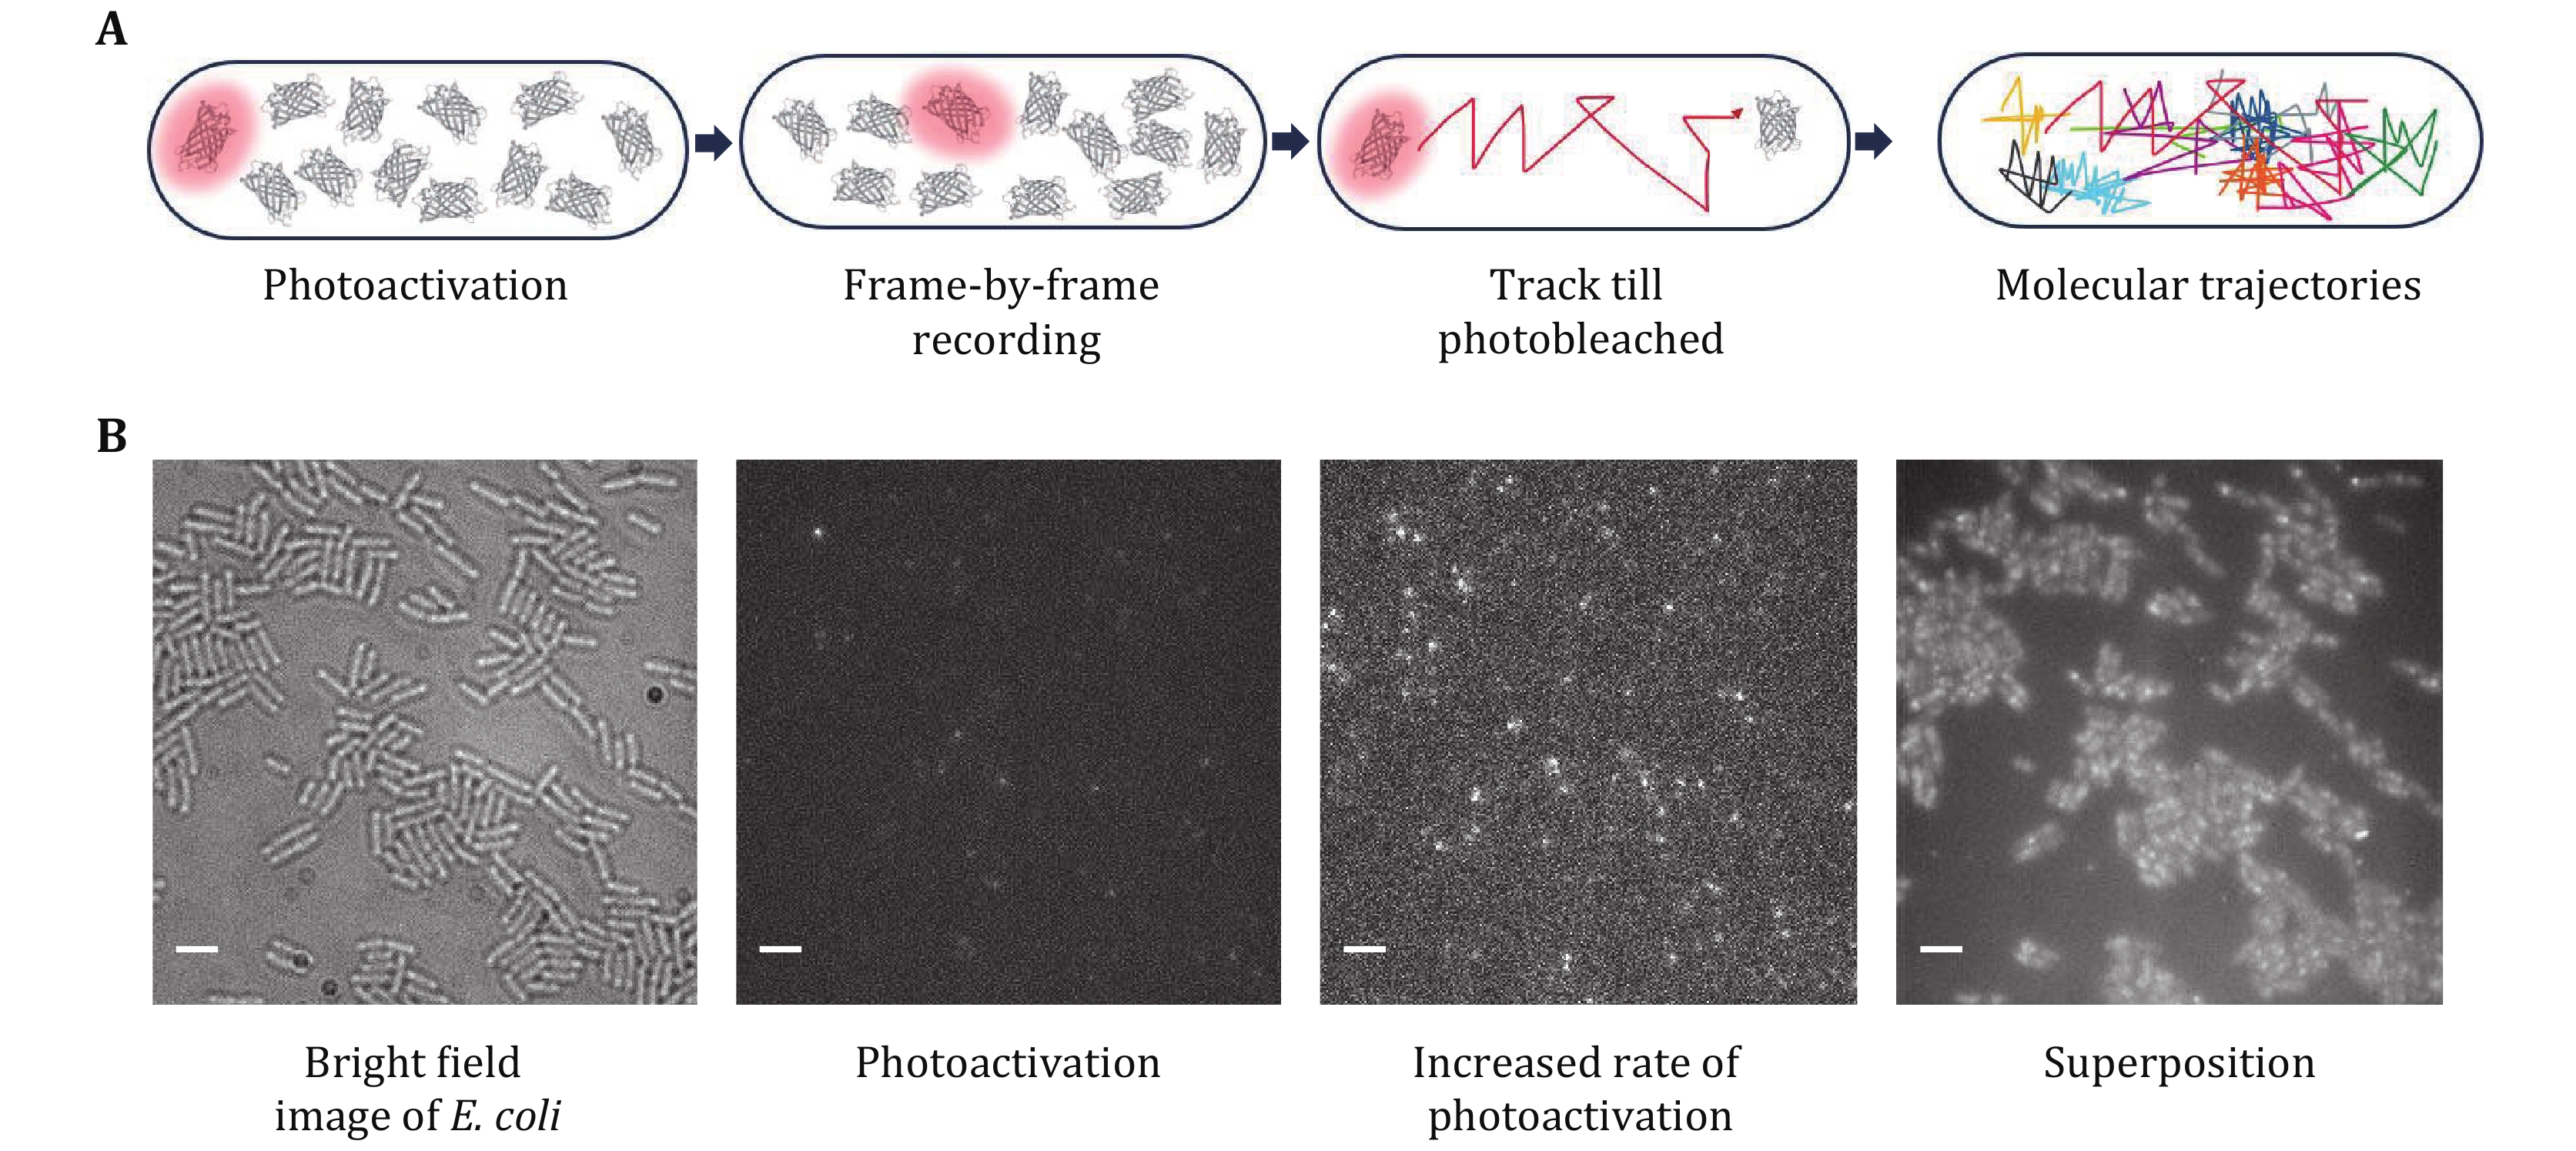
Figure 4. Photoactivation and tracking of RNAP–PAmCherry fusion proteins in living E. coli cells. A The concept of sptPALM. PAmCherry can be photoactivated from an initial nonfluorescent state upon irradiation with 405 nm light. Track the fluorophore at a rate of several tens of frames per second for several frames until photobleaching. Tracks of many molecules are recorded in a sequential manner. B Representative results from a PALM movie of RNAP-PAmCherry. Transmitted light microscopy images of cells immobilized on an agarose pad are taken first. Photoactivate a single PAmCherry in a cell. A higher photoactivation rate increases the number of PAmCherry. Integrated PAmCherry fluorescence from a PALM movie. Scale bar: 3 μm
-

Figure 5. Single-molecule imaging of RPB1-Halo in living yeast cells. A Transmitted light microscopy image. B Integrated PA-JF 549 fluorescence from a PALM movie of the same FOV. C Selected 150 ms frames of raw data from the molecular trajectory shown in the box of Panel B. D Trajectory of the single photoactivated PA-JF 549 shown in Panel C. E Apparent diffusion coefficient (D*) distribution of the several thousands of tracked RPB1-Halo. F Single-molecule trajectory map of RPB1-Halo in living yeast cells
Figure
5 ,Table
2 个