-
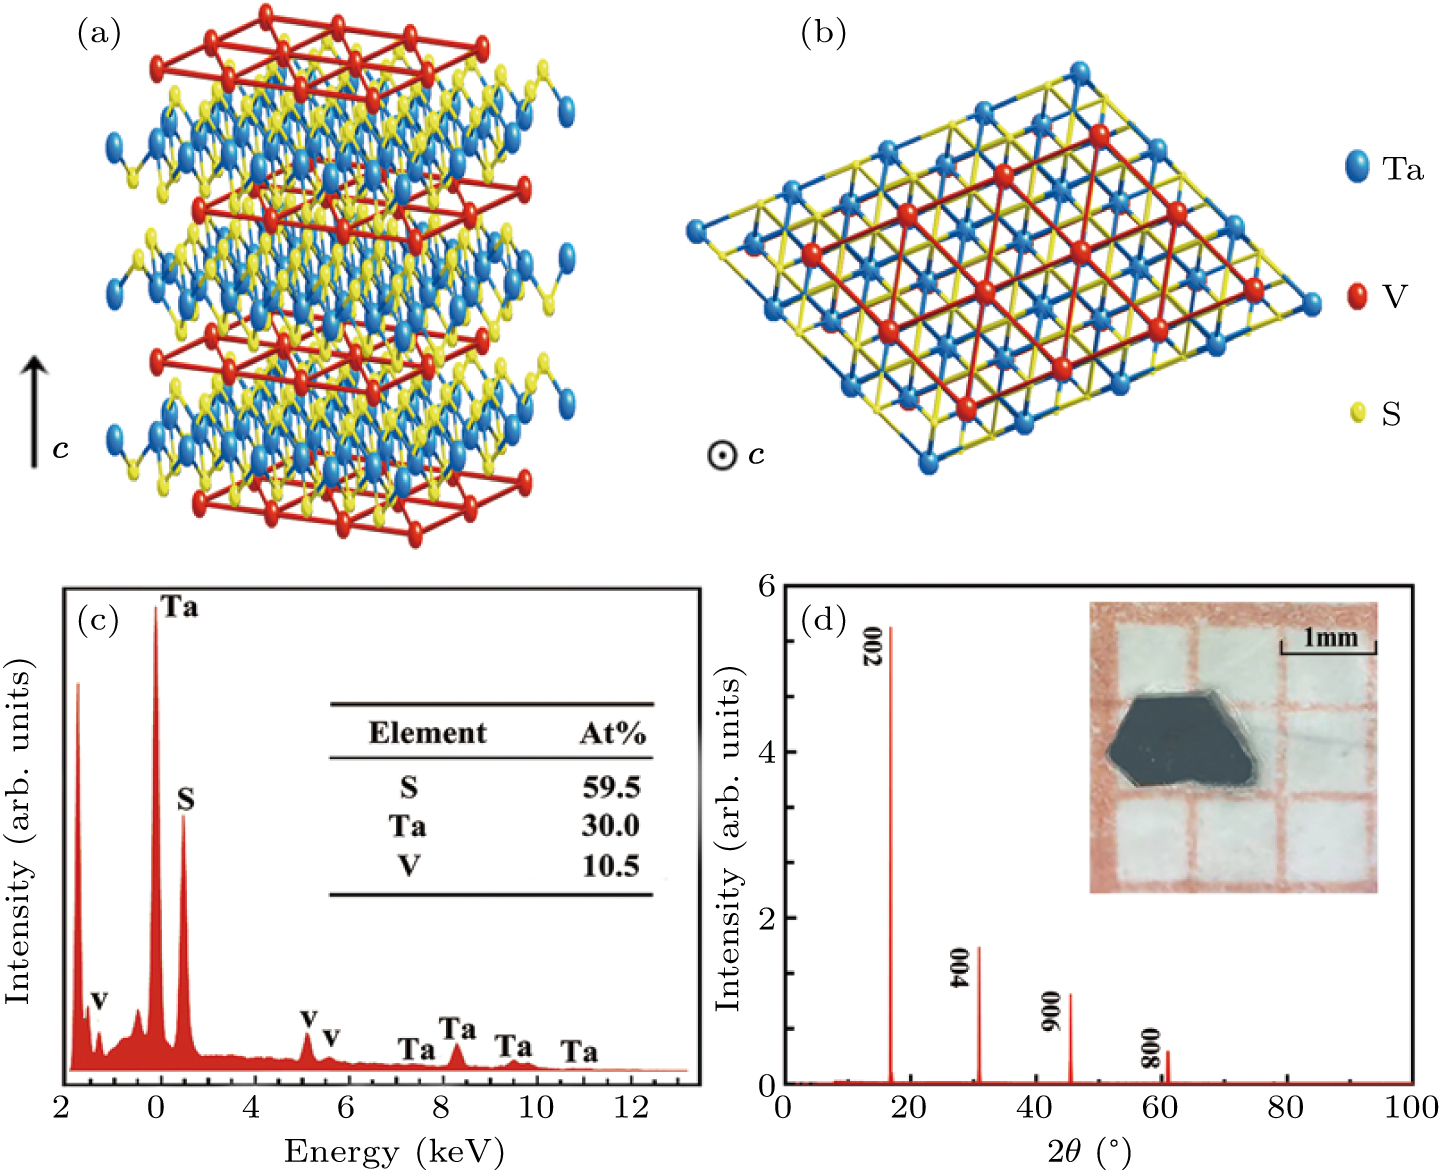
Figure 1. (a) Side view of crystal structure with V atoms intercalated between the TaS2 layers. (b) Top view of crystal structure along the c-axis. (c) Energy dispersive x-ray spectrometer (EDXS) for the V1/3TaS2 crystal. (d) Single crystal XRD pattern. Inset: the photograph of a crystal.
-
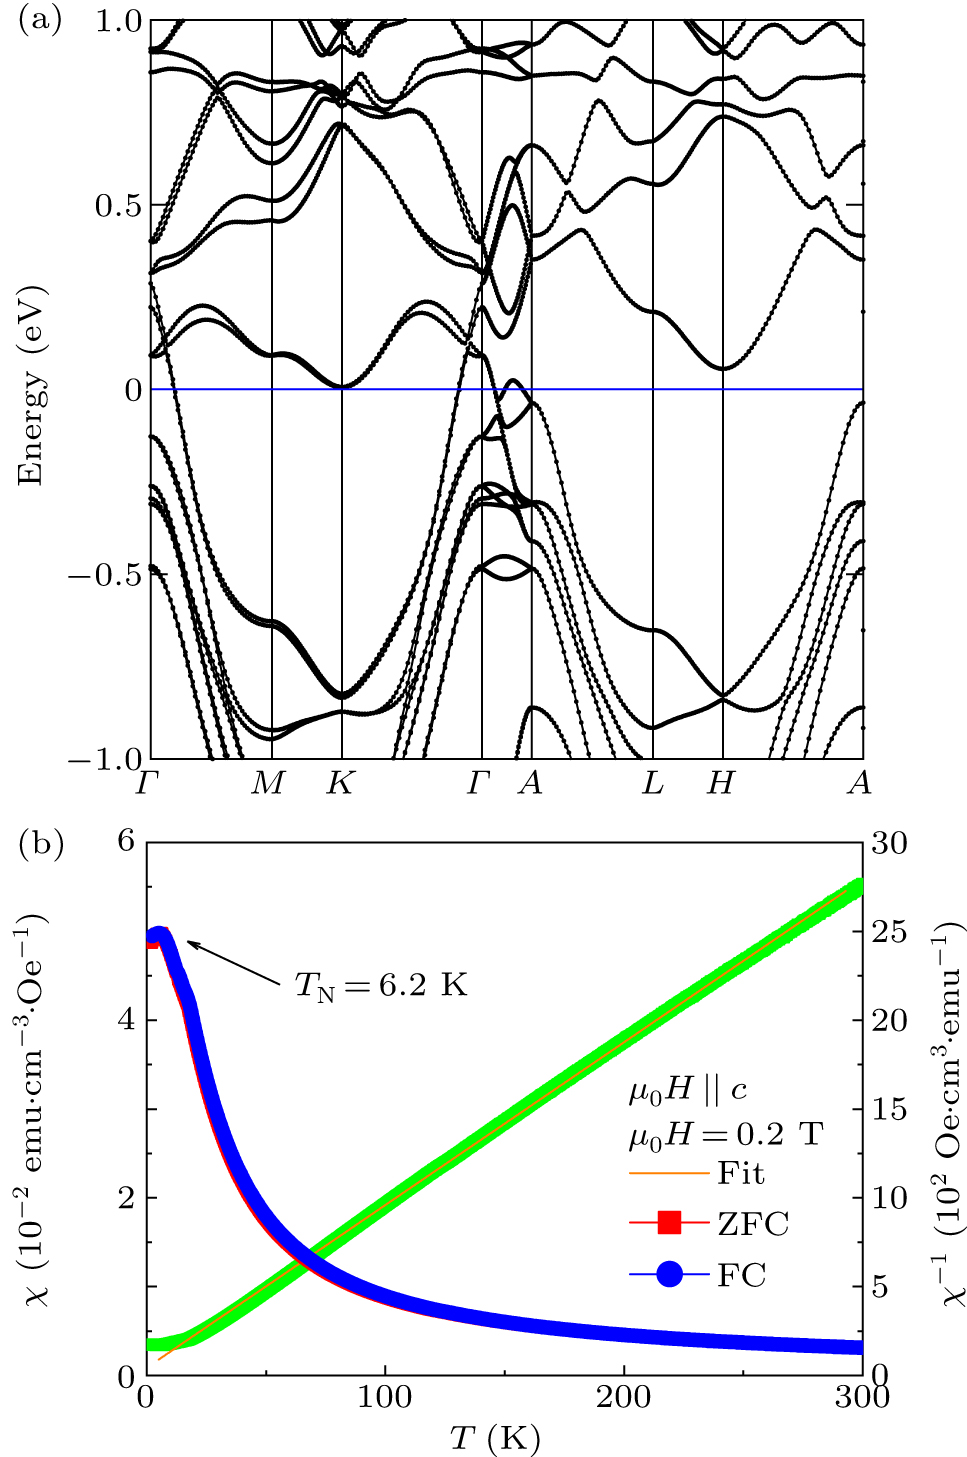
Figure 2. (a) The calculated band structure with SOC. (b) Temperature dependence of magnetic susceptibility, χ = M/H, measured at H = 2000 Oe applied along the c-axis with both ZFC and FC processes. The right axis is for χ−1(T).
-
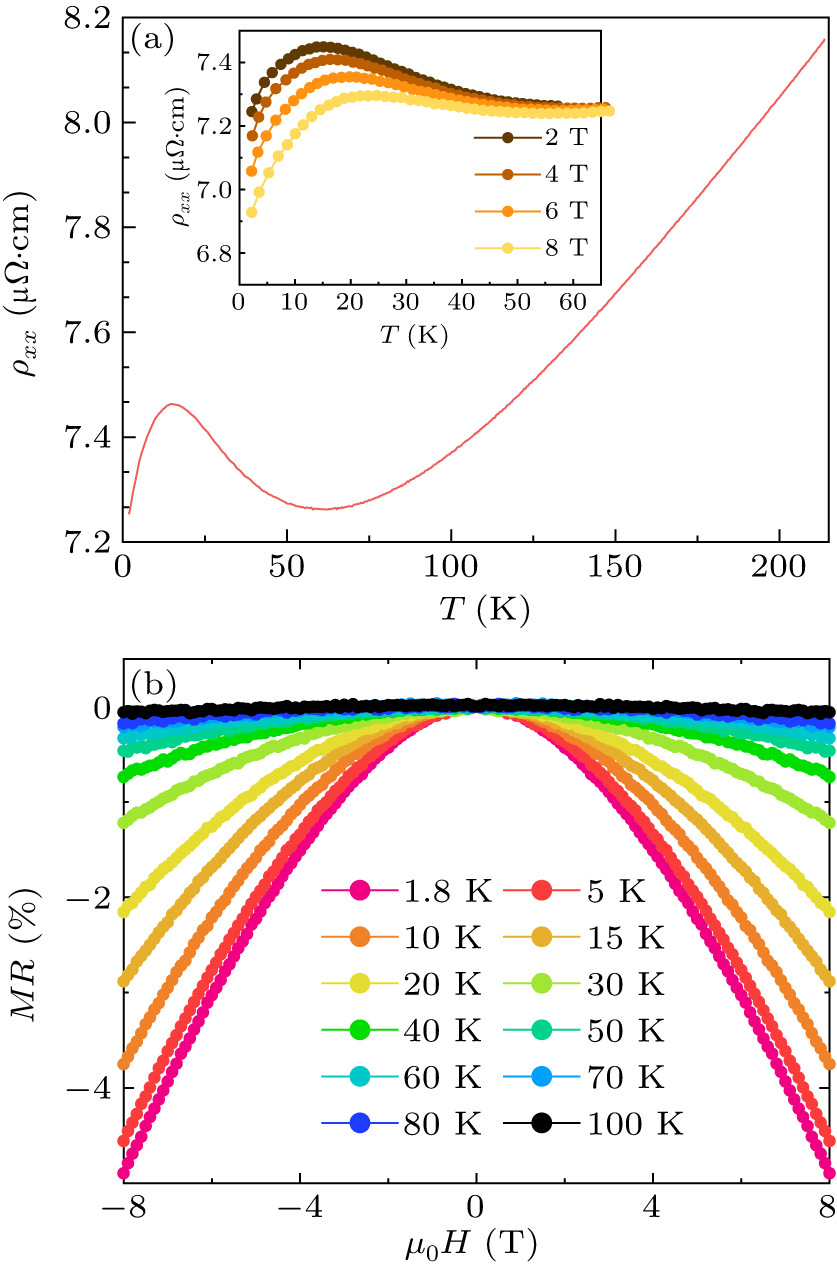
Figure 3. (a) Temperature dependence of longitudinal resistivity ρxx measured at zero field, the inset shows resistivity measured at various magnetic fields. (b) Field dependence of MR at various temperatures with a magnetic field applied along the c-axis.
-

Figure 4. (a) Field dependence of Hall resistivity, ρyx, measured at various temperatures for a V1/3TaS2 crystal. (b) Components of the conductivity tensor, i.e., σxy as a function of magnetic field for different temperatures (<100 K). Hollow dots represent the experimental data and the solid lines are the fitting curves using the two-carrier model.
-
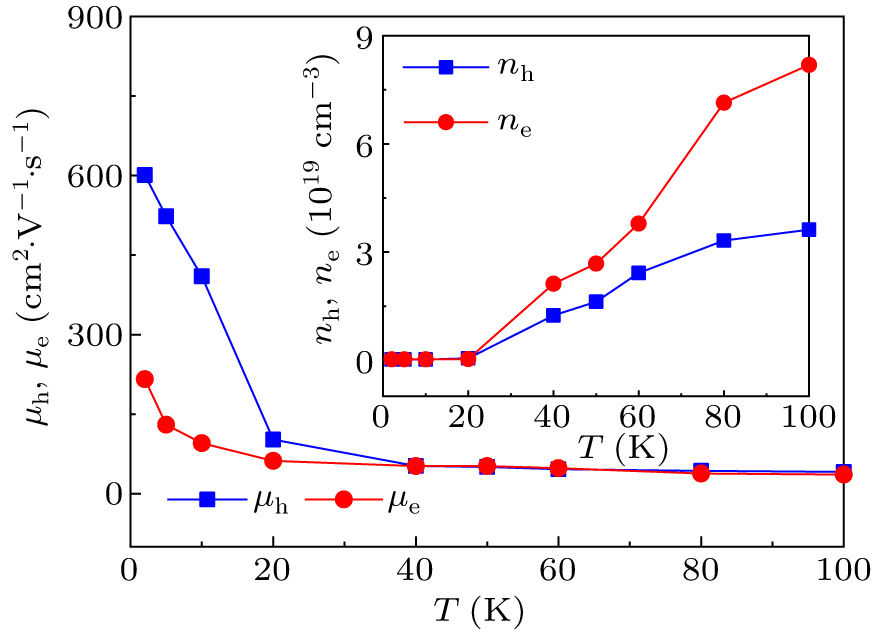
Figure 5. The carrier mobilities, μh and μe, and (inset) the carrier concentrations nh and ne, as a function of temperature, extracted from the two-carrier model analysis of σxy data.
Figure
5 ,Table
0 个