-
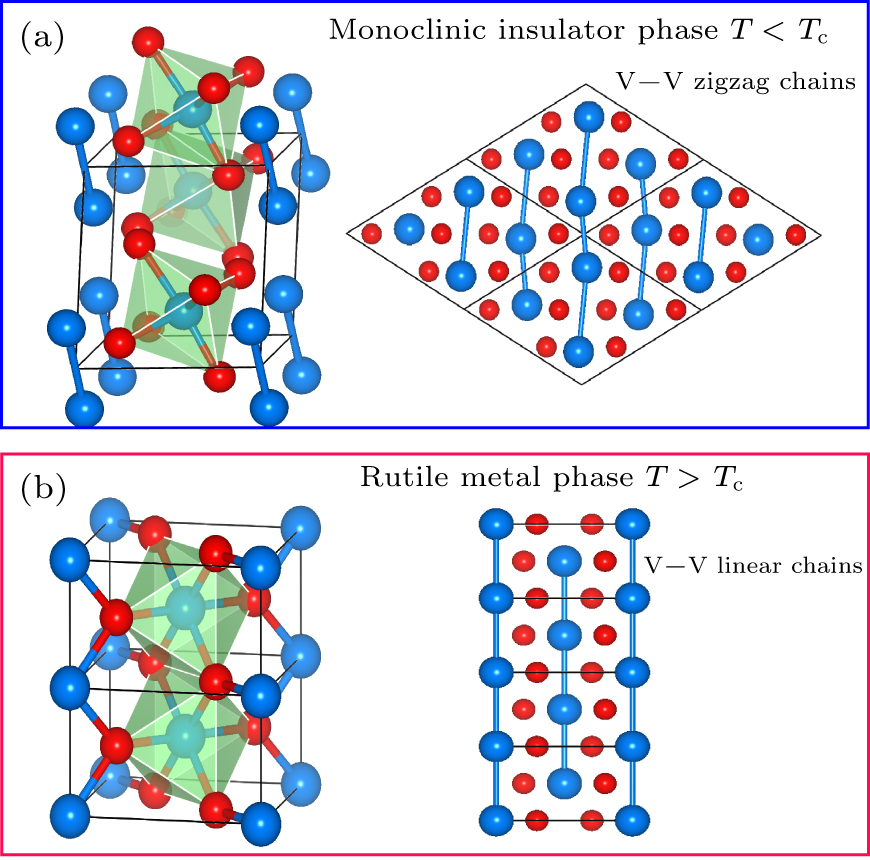
Figure 1. Crystal structure of VO2 in (a) monoclinic (M) phase with alternating V–V dimerization forming zigzag-like chains and (b) rutile (R) phase with equidistant straight V–V chains. The unit cells are indicated by black lines. Vanadium and oxygen atoms are represented by blue and red spheres, respectively.
-
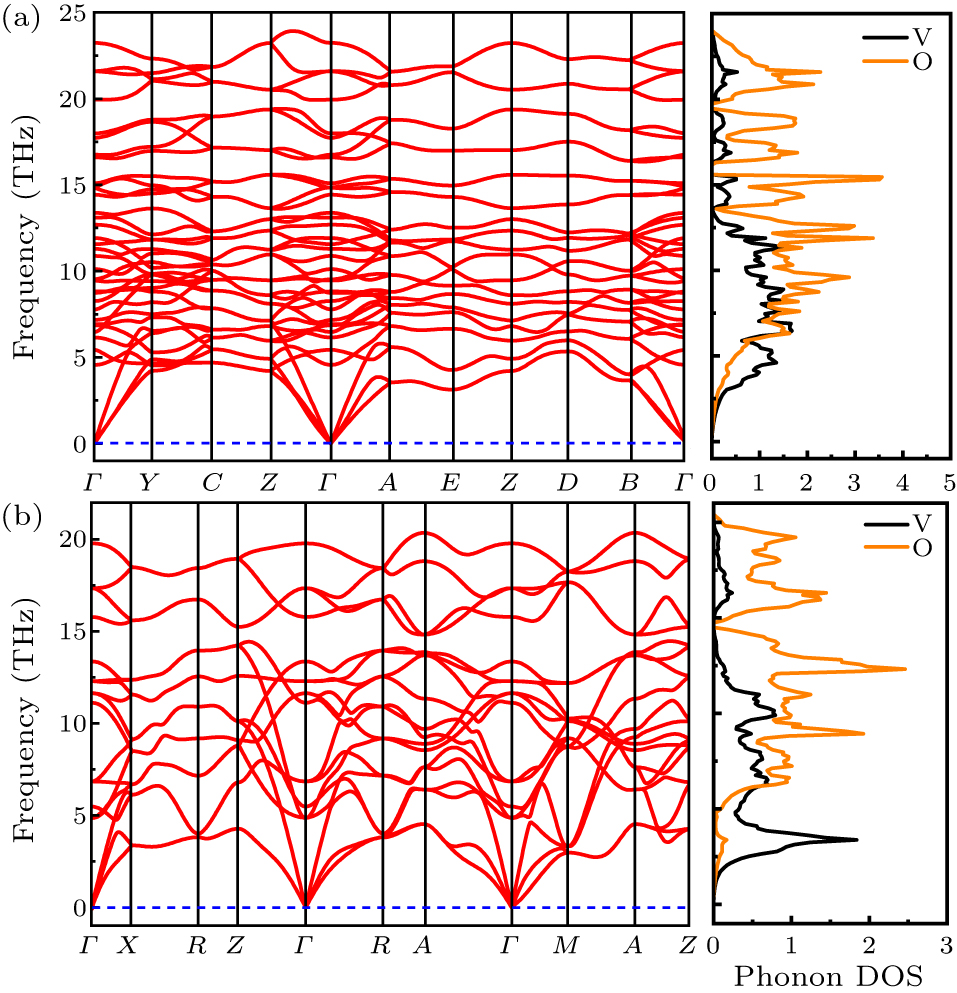
Figure 2. Phonon dispersion along high symmetry lines and the phonon density of states for VO2 in (a) M phase and (b) R phase.
-
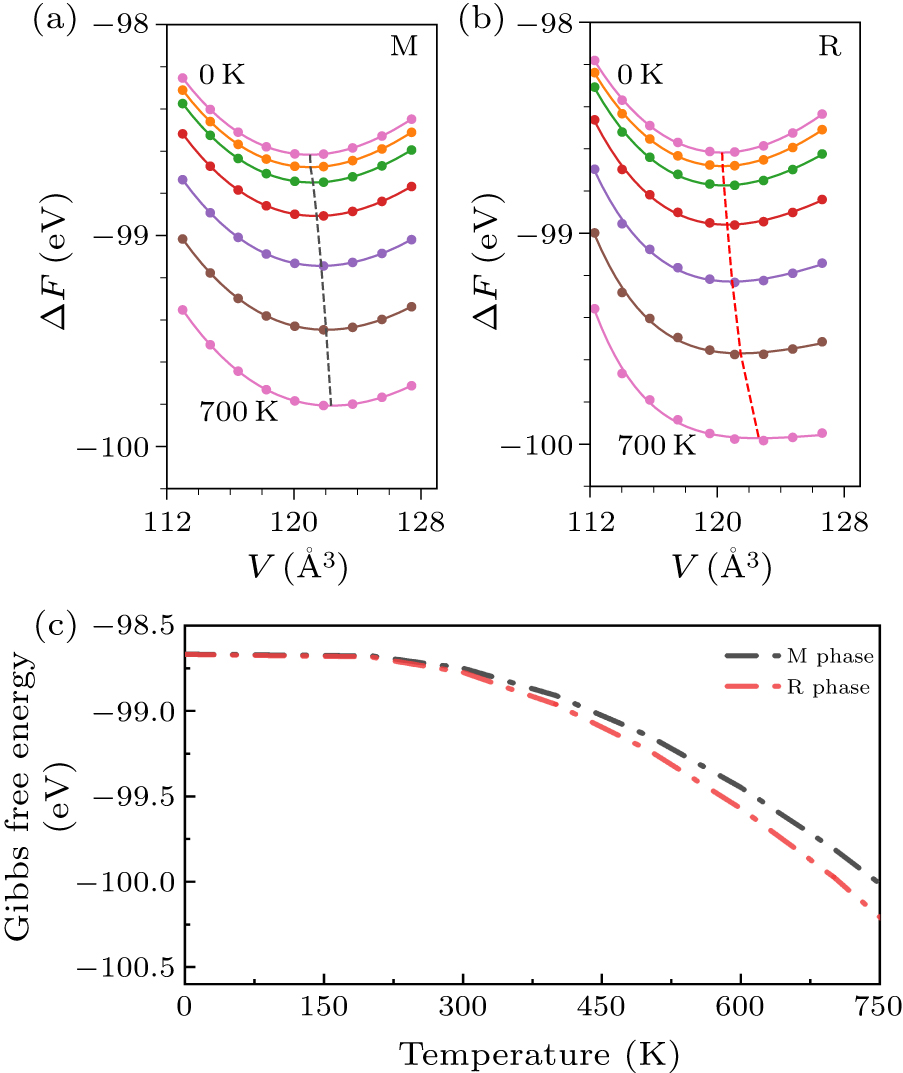
Figure 3. Helmholtz free energy with respect to different volumes of VO2 in (a) M phase and (b) R phase at temperature window between 0 and 700 K with steps of 100 K. The filled circles denote calculated Helmholtz free energy with QHA of nine volumes at specified temperature, and the solid curves show the fitted functions according to the Vinet equation of states. The crossed points of solid and dashed line are the minimum of respective fitted functions and simultaneously represent the equilibrium volumes at each temperature. Dashed lines are a guide to the eyes. (c) The Gibbs free energies of varied temperatures for M and R phases, evolving from the dashed lines in (a) and (b), respectively.
-
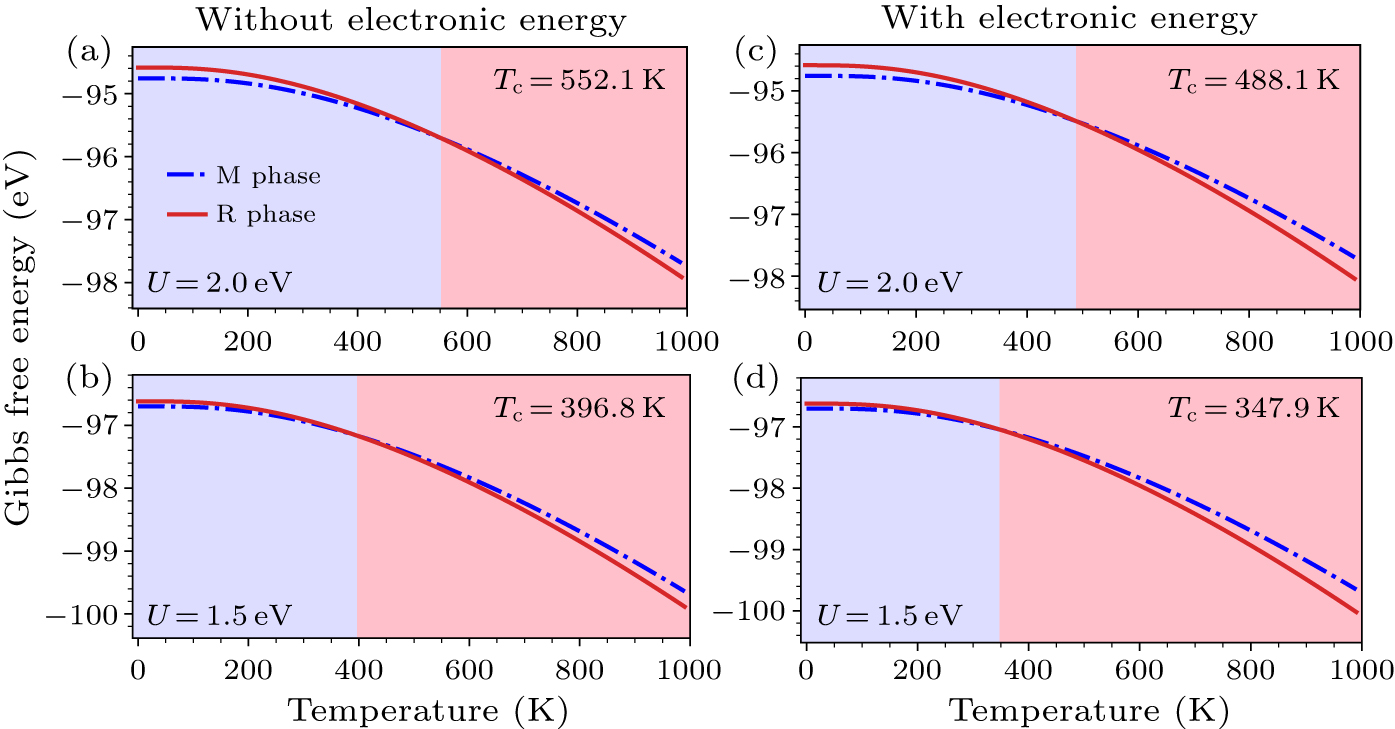
Figure 4. The Gibbs free energy versus temperature, which is performed in a simpler and efficient framework of DFT + U combined with QHA for both M (blue dashed lines) and R phases (red solid lines) at (a) U = 2.0 eV and (b) U = 1.5 eV without considering electronic energy in Helmholtz free energy, (c) U = 2.0 eV and (d) U = 1.5 eV with electronic energy in Helmholtz free energy. The boundary of blue and red shaded region denotes the transition point from low-temperature M phase to high-temperature R phase. The corresponding temperature of boundary is the Tc, as shown in the upper right.
-
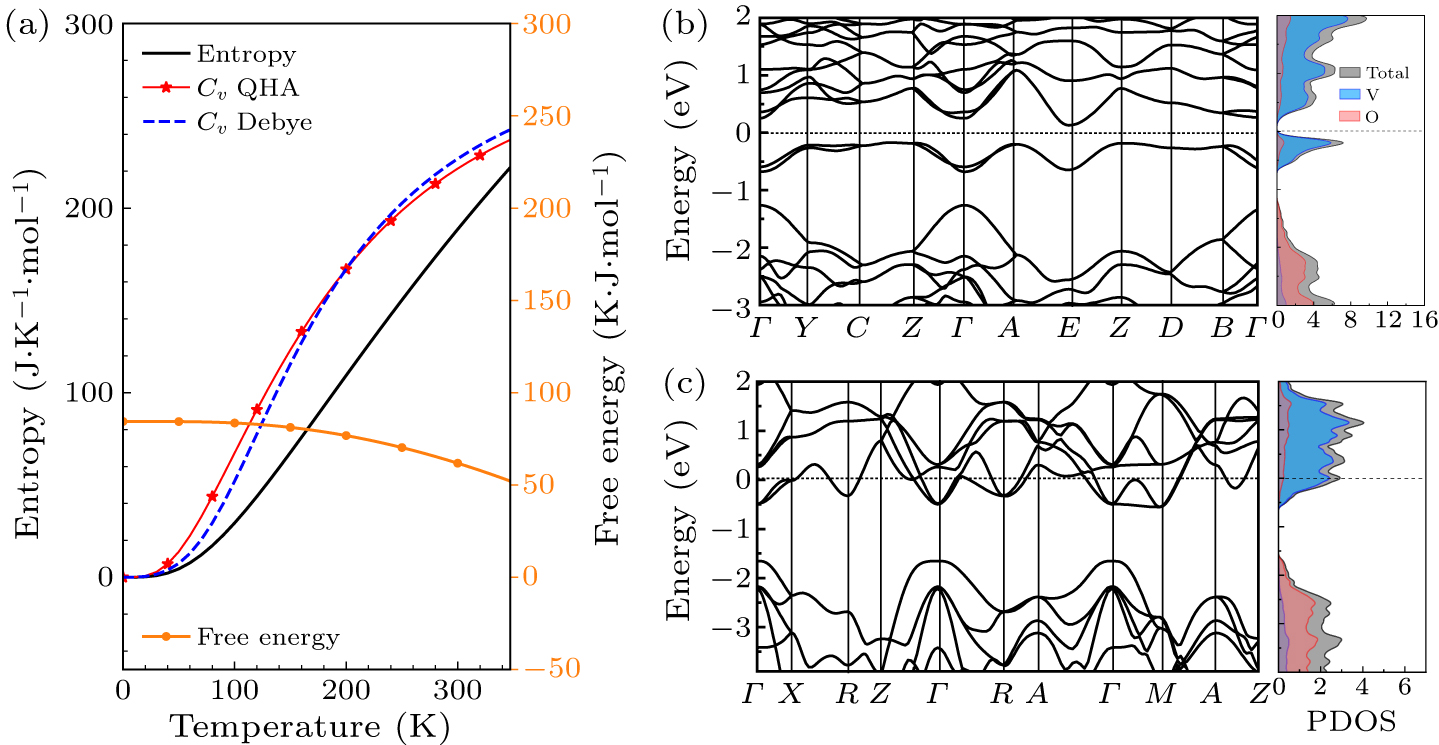
Figure 5. The calculated thermal properties using DFT + U combined with QHA at U = 1.5 eV, including Helmholtz free energy, heat capacity, and entropy for M phase with respect to temperature, shown by orange filled circles, with red filled stars, and black solid line, respectively. The orange and red solid lines connecting filled symbols are guides for the eyes. The blue dashed line denotes the fitted heat capacity as a function of temperature by Debye approximation. Band structures and corresponding partial density of states (PDOS) calculated by DFT + U with U = 1.5 eV for (b) M phase and (C) R phase of VO2. Black dashed line depicts the Fermi level.
Figure
5 ,Table
1 个