-
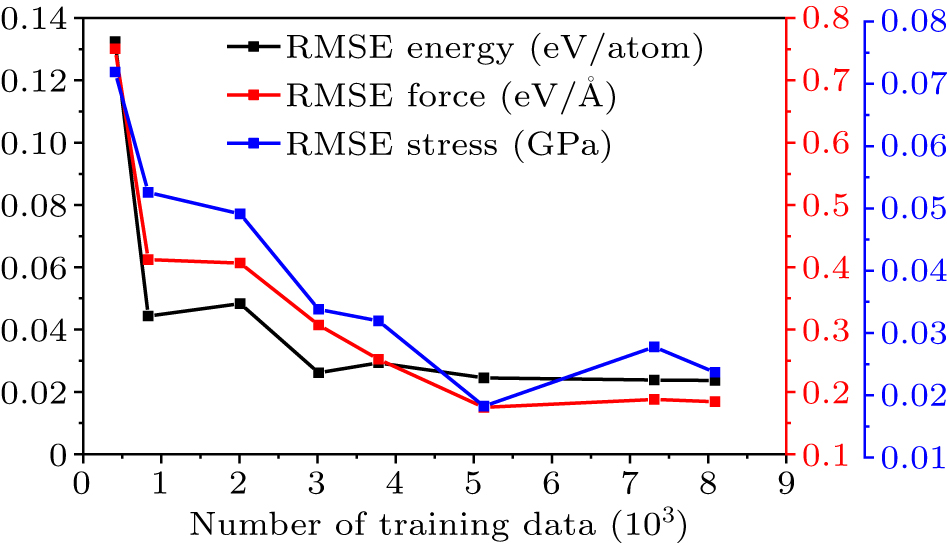
Figure 1. The evolution of the RMSE for the energy (eV⋅atom−1), force (eV⋅Å−1), and stress (GPa) tested on different testing sets.
-
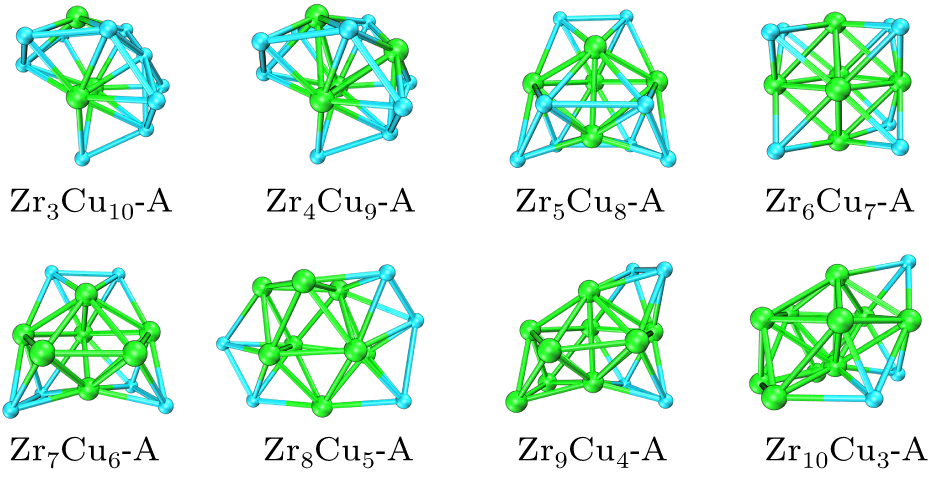
Figure 2. Ground state structure of the ZrnCu13−n (n = 3–10) clusters searched by MLP (green balls represent Zr atoms, cyan balls represent Cu atoms).
-
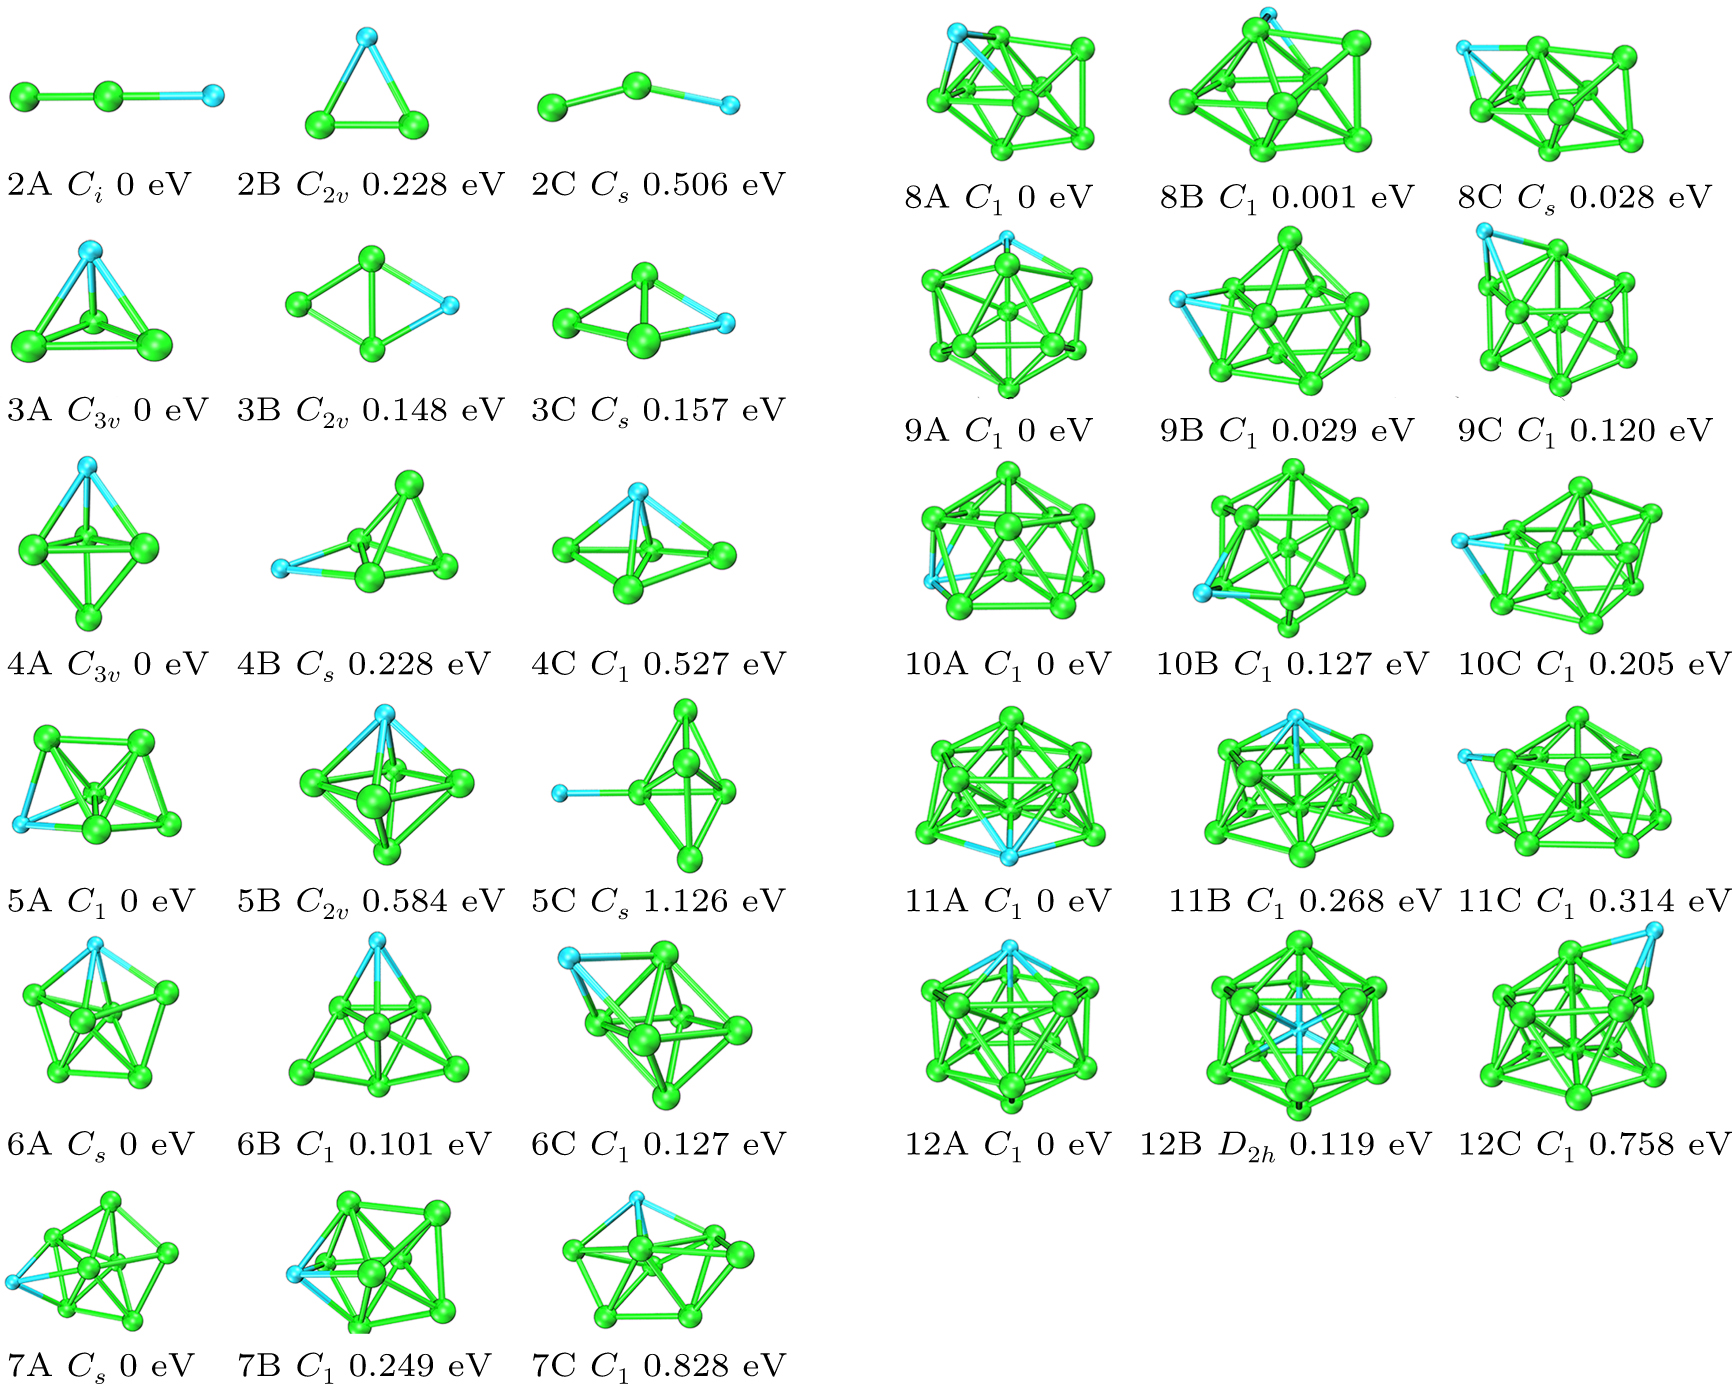
Figure 3. The geometry of the three lowest energy isomers of the ZrnCu (n = 2–12) nanoclusters searched by MLP, and the energy difference in electronvolts from the lowest energy isomer at the same size (green balls represent Zr atoms, cyan balls represent Cu atoms).
-
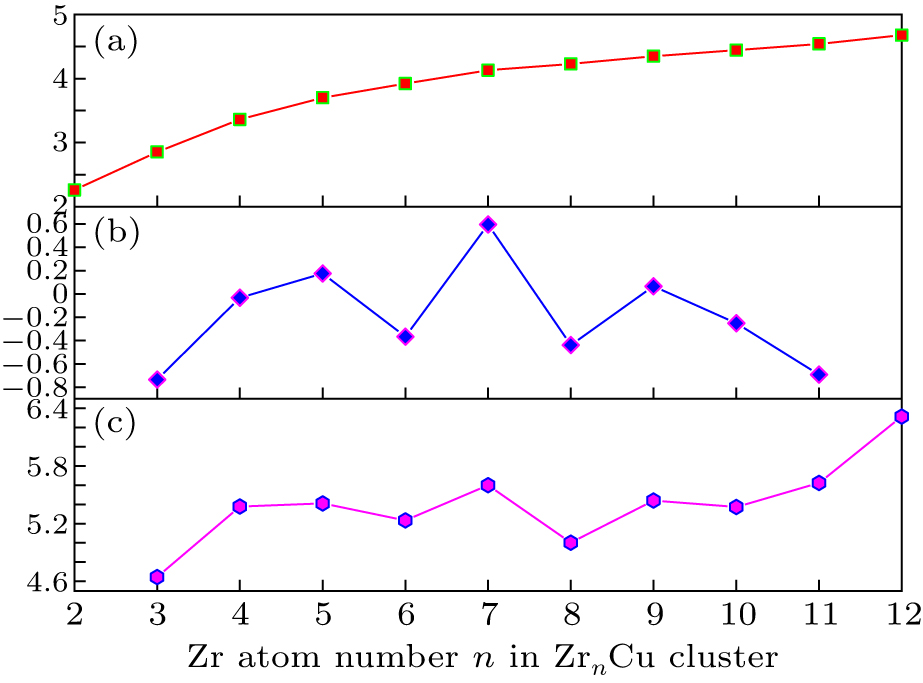
Figure 4. Size dependence of (a) the averaged binding energy (Eb), (b) the second-order energy difference (Δ2E), and (c) the dissociation energy (Ed) for the lowest energy ZrnCu (n = 2–12) clusters.
-
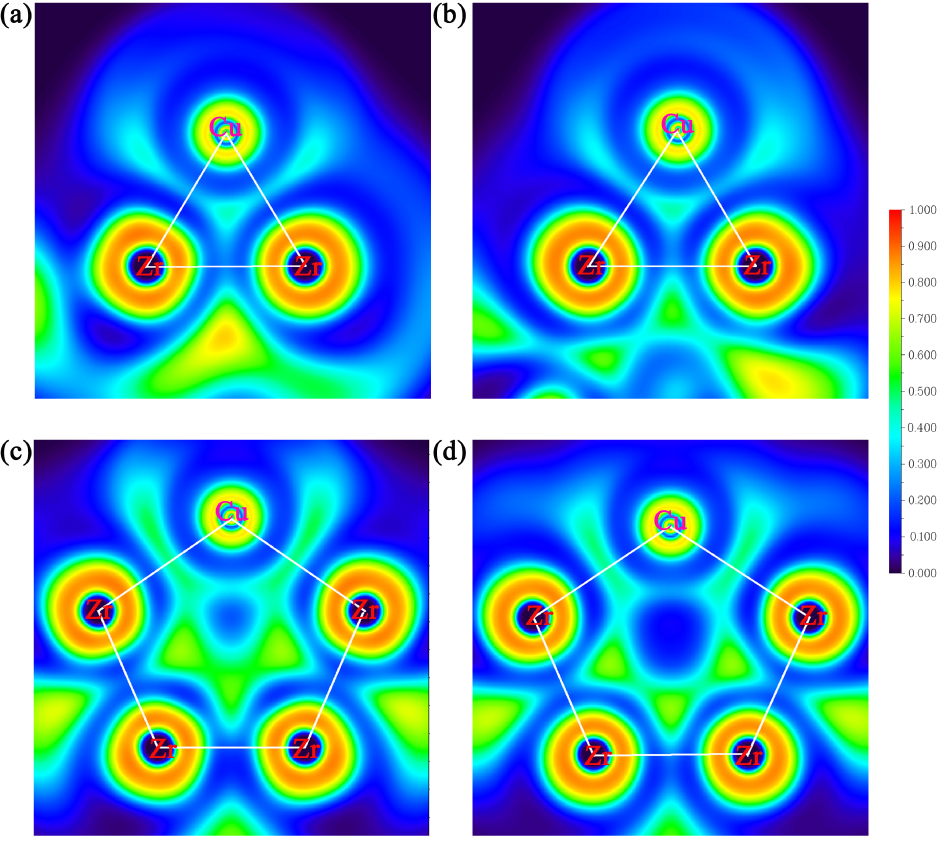
Figure 5. The two-dimensional ELF of the (a) Zr5Cu, (b) Zr7Cu, (c) Zr9Cu, and (d) Zr12Cu clusters.
-

Figure 6. The PDOS of the Cu and Zr atoms in (a) the lowest-energy Zr5Cu cluster, (b) the lowest-energy Zr7Cu cluster, (c) the lowest-energy Zr9Cu cluster, and (d) the lowest-energy Zr12Cu cluster.
-
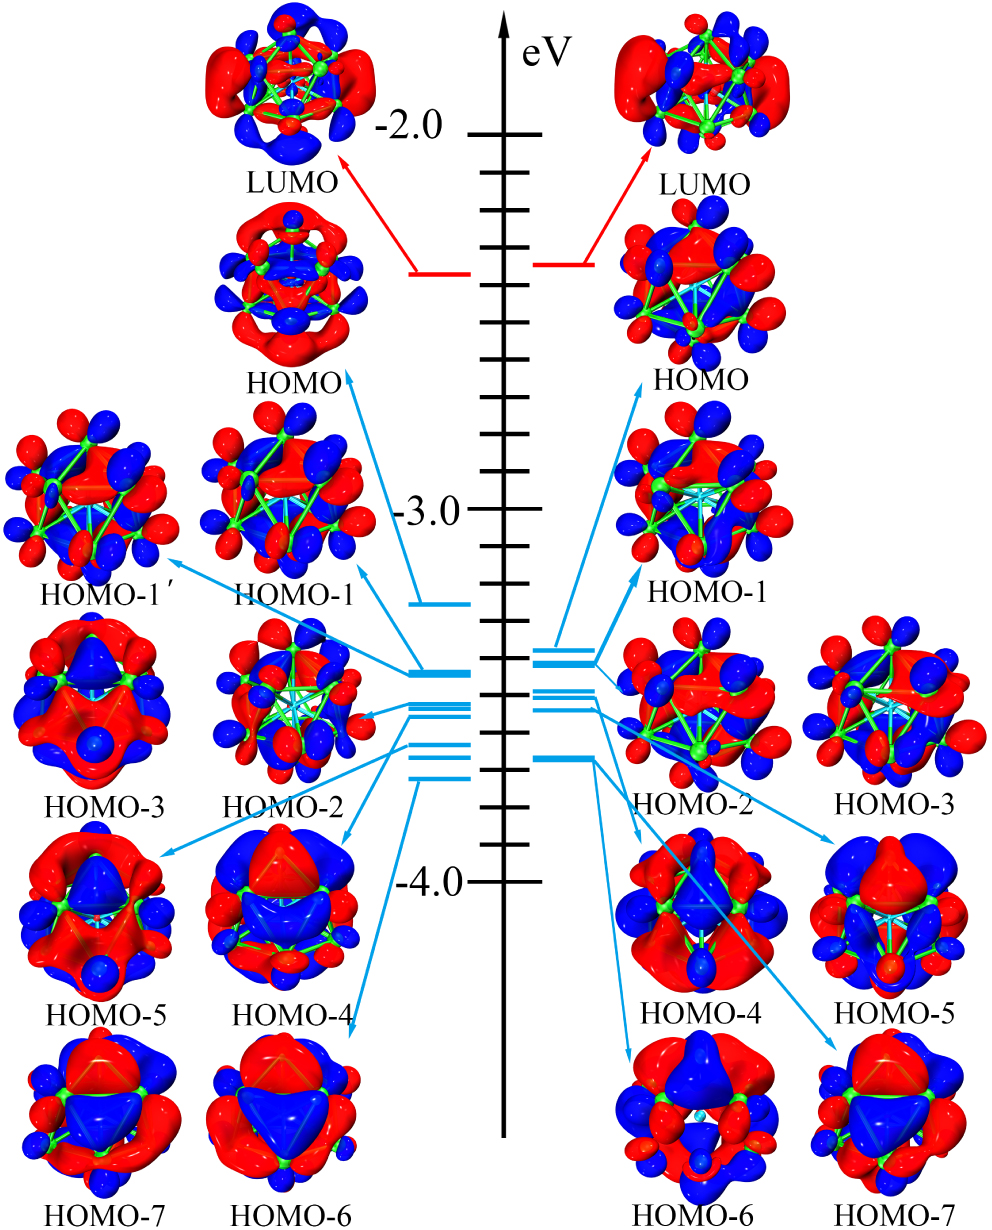
Figure 7. MOs and corresponding energy levels of the 12B cluster.
-
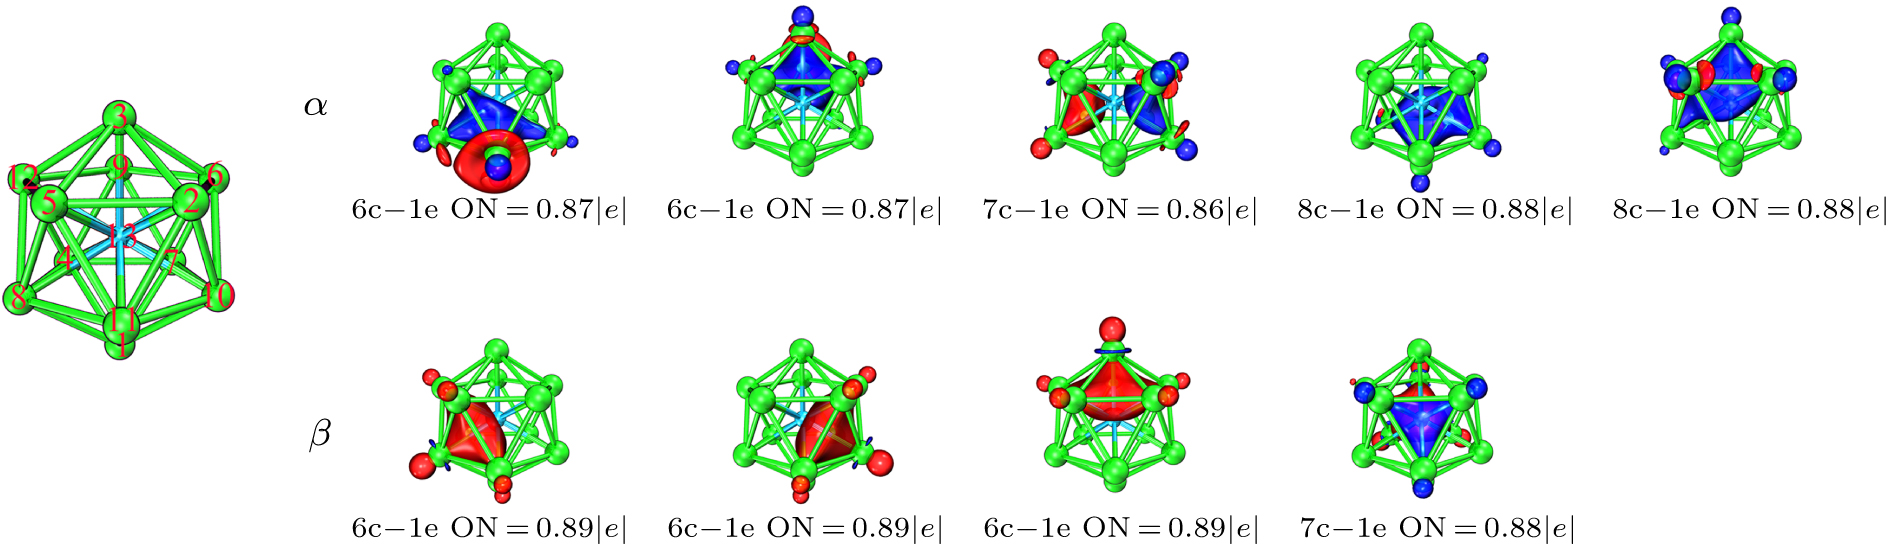
Figure 8. The 6c–1e chemical bond analyzed by the AdNDP method. ON means the occupancy number.
Figure
8 ,Table
2 个