-
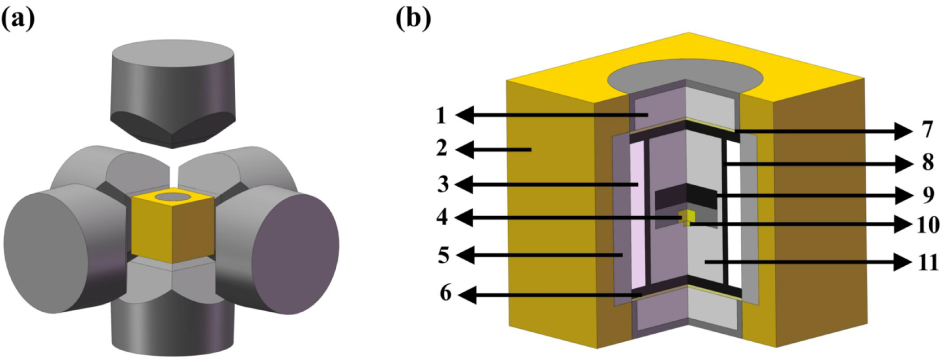
Figure 1. Schematic diagram of the experimental system used to synthesize diamond in an HPHT environment: (a) an alloy hammer and sample cell; (b) schematic of the diamond growth cell: (1) steel cap; (2) pyrophyllite container; (3) dolomite container; (4) diamond sample; (5) NaCl + ZrO2 sleeve; (6) graphite sheet; (7) Cu sheet; (8) graphite heater; (9) carbon source; (10) seed crystal; (11) ZrO2 + MgO pillar.
-
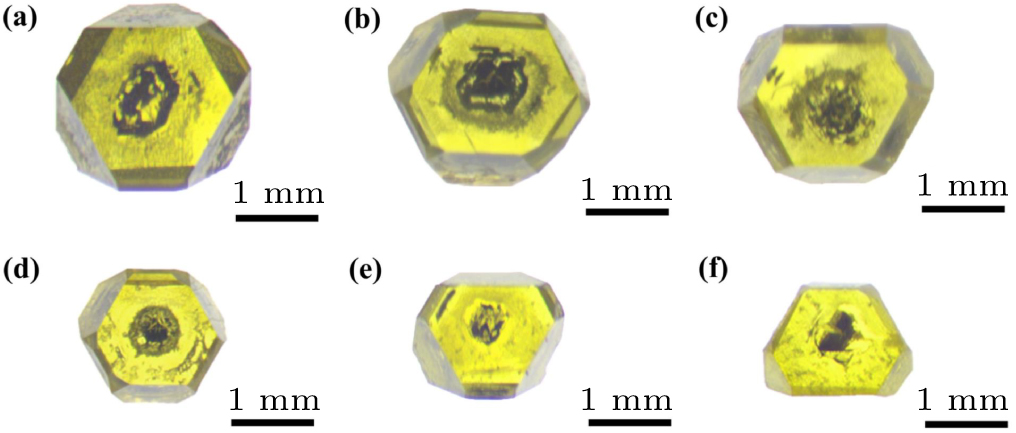
Figure 2. Optical photos of diamond crystals synthesized in different experimental synthesis systems: (a) D-1; (b) D-2; (c) D-3; (d) D-4; (e) D-5; (f) D-6. See Table 1 for all associated experimental parameters.
-
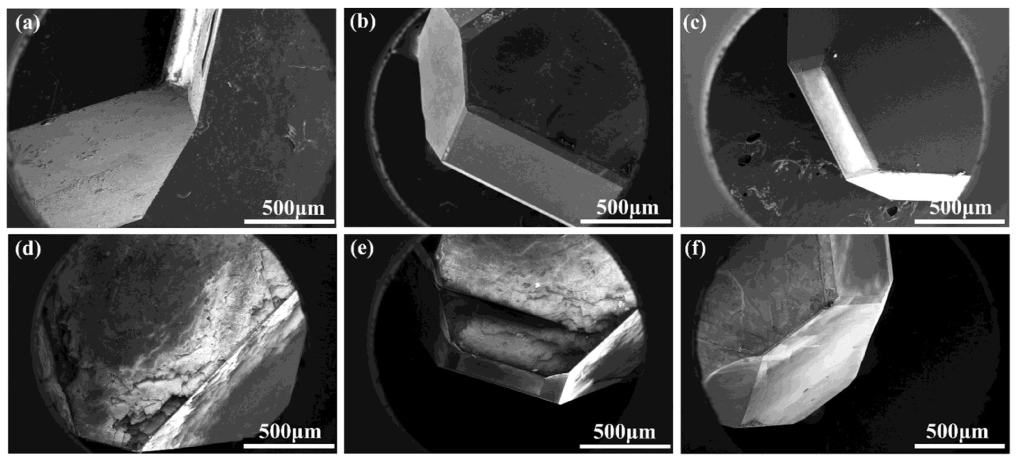
Figure 3. Scanning electron microscopy images of diamond crystals synthesized under different pressures in different synthesis systems: (a) D-1; (b) D-2; (c) D-3; (d) D-4; (e) D-5; (f) D-6. See Table 1 for all associated experimental parameters.
-
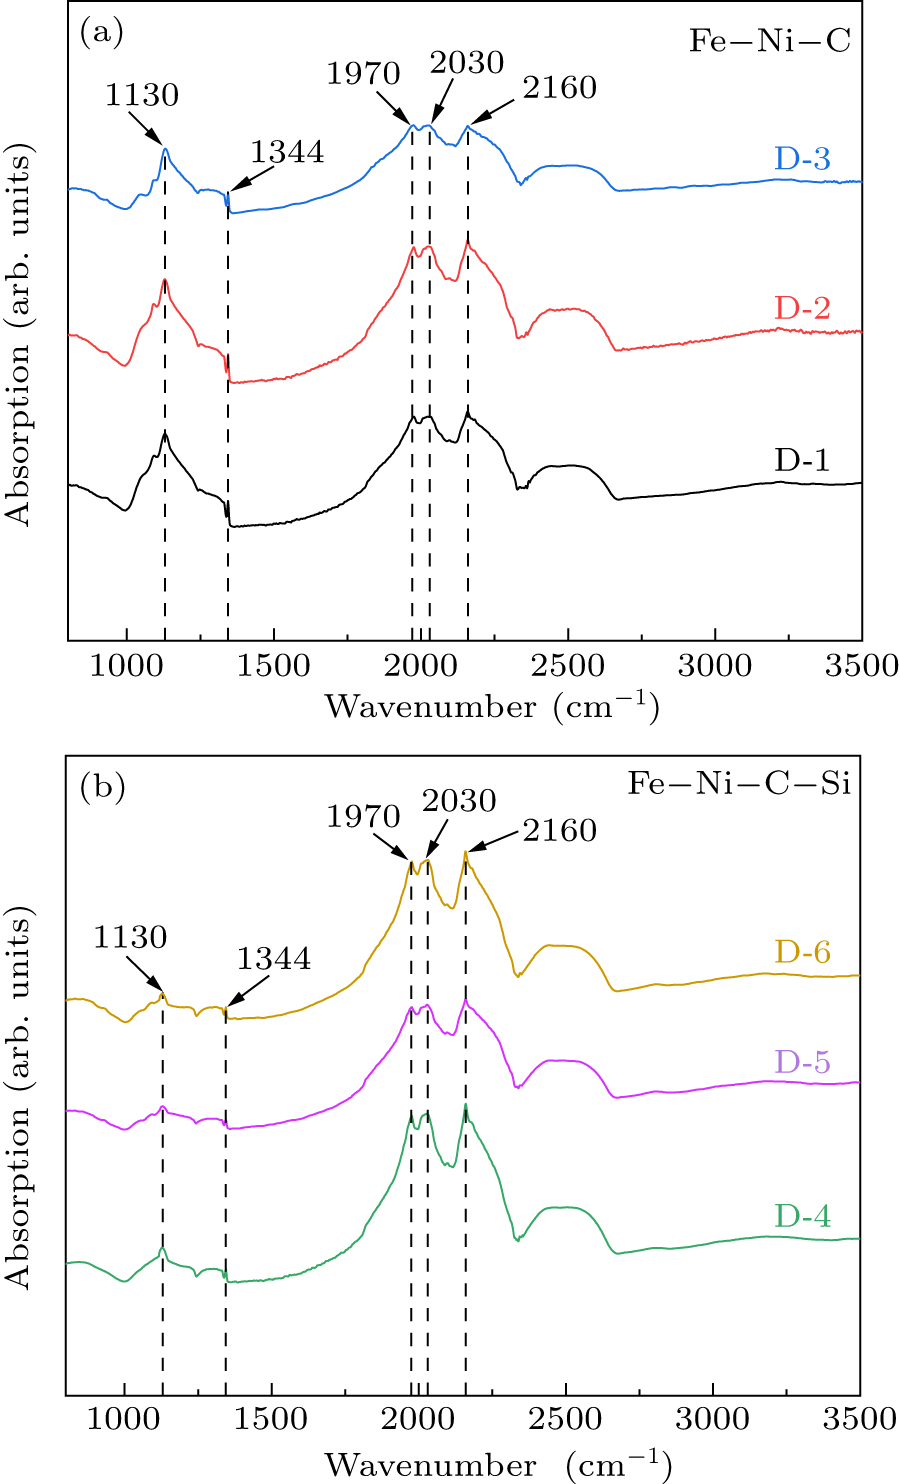
Figure 4. FTIR spectra of diamond crystals synthesized under different pressures in different synthesis systems. See Table 1 for all associated experimental parameters.
-
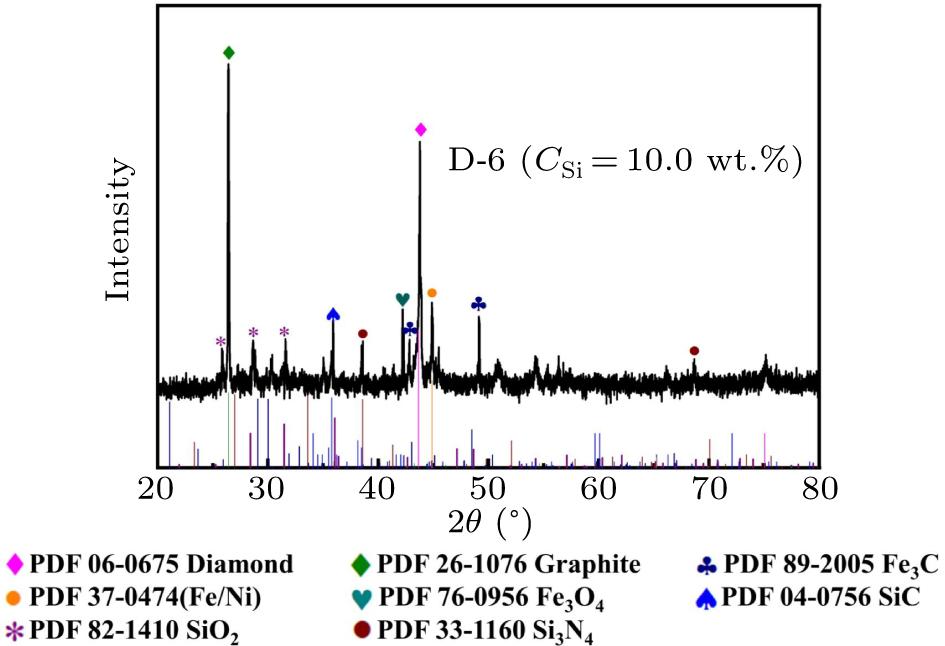
Figure 5. XRD spectrum of 10.0 wt.% typical carbon source block (D-6) in the Fe–Ni–C–Si system.
-
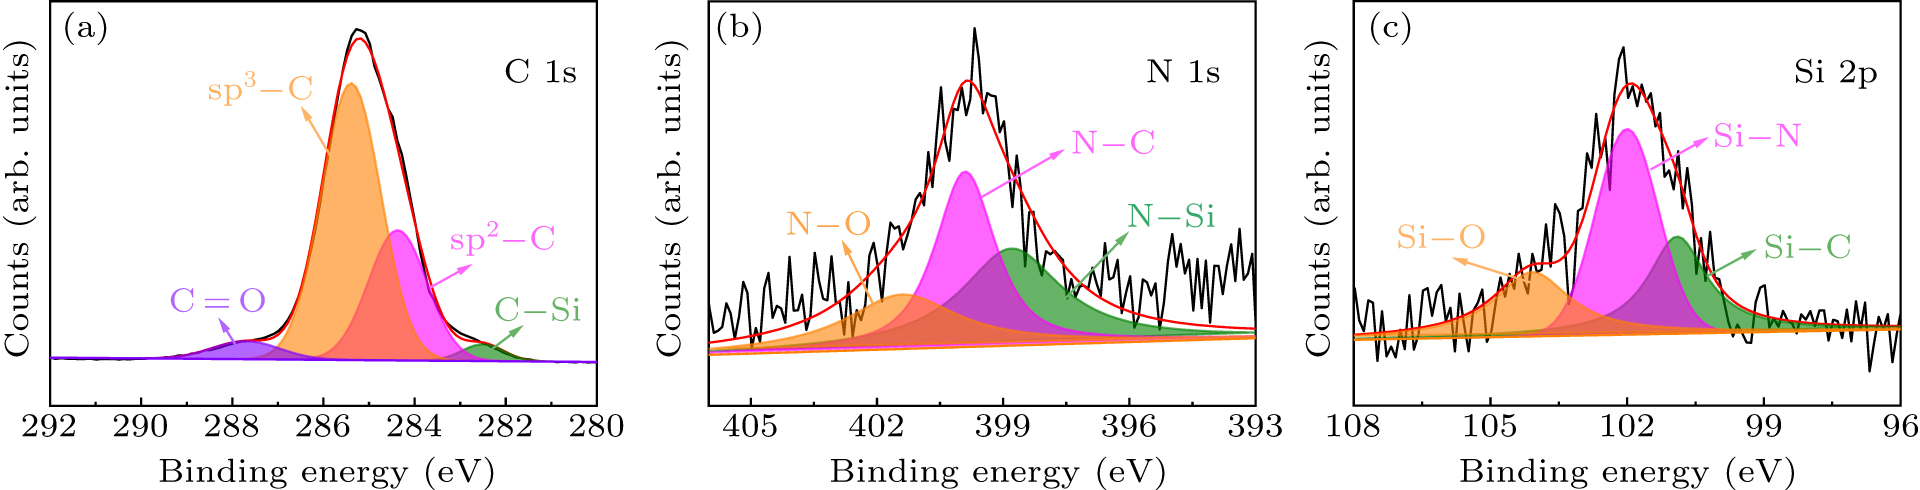
Figure 6. The XPS spectra of a diamond crystal synthesized from a 10% Si source at 6.8 GPa pressure (D-6). (a) C 1s. (b) N 1s. (c) Si 2p.
-
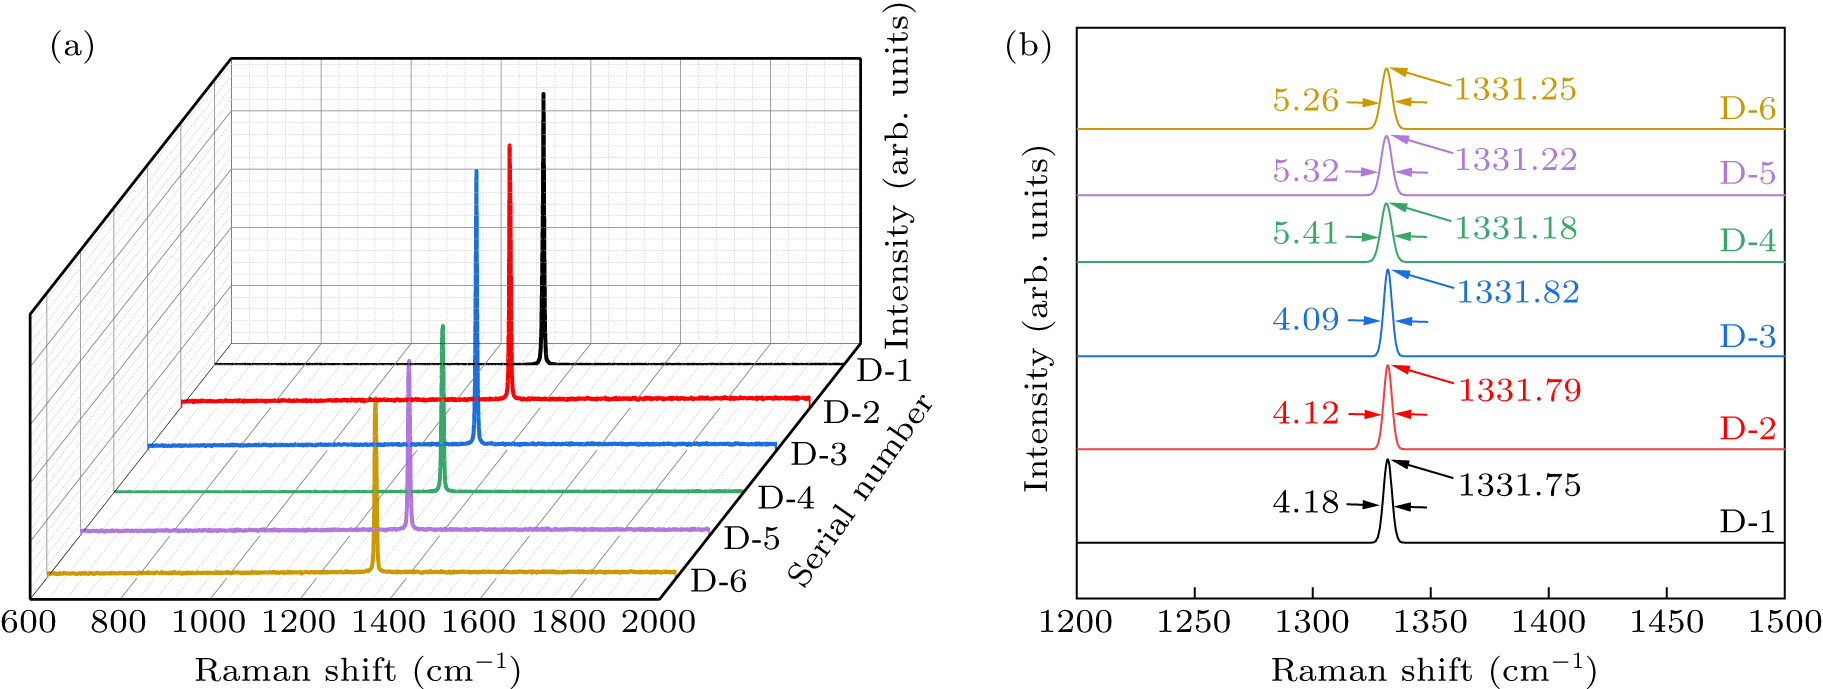
Figure 7. (a) Raman spectra of diamond crystals synthesized under different pressures in different systems. (b) Magnified map of Raman spectral data within the range of 1200.00 cm−1–1500.00 cm−1. See Table 1 for all associated experimental parameters.
-
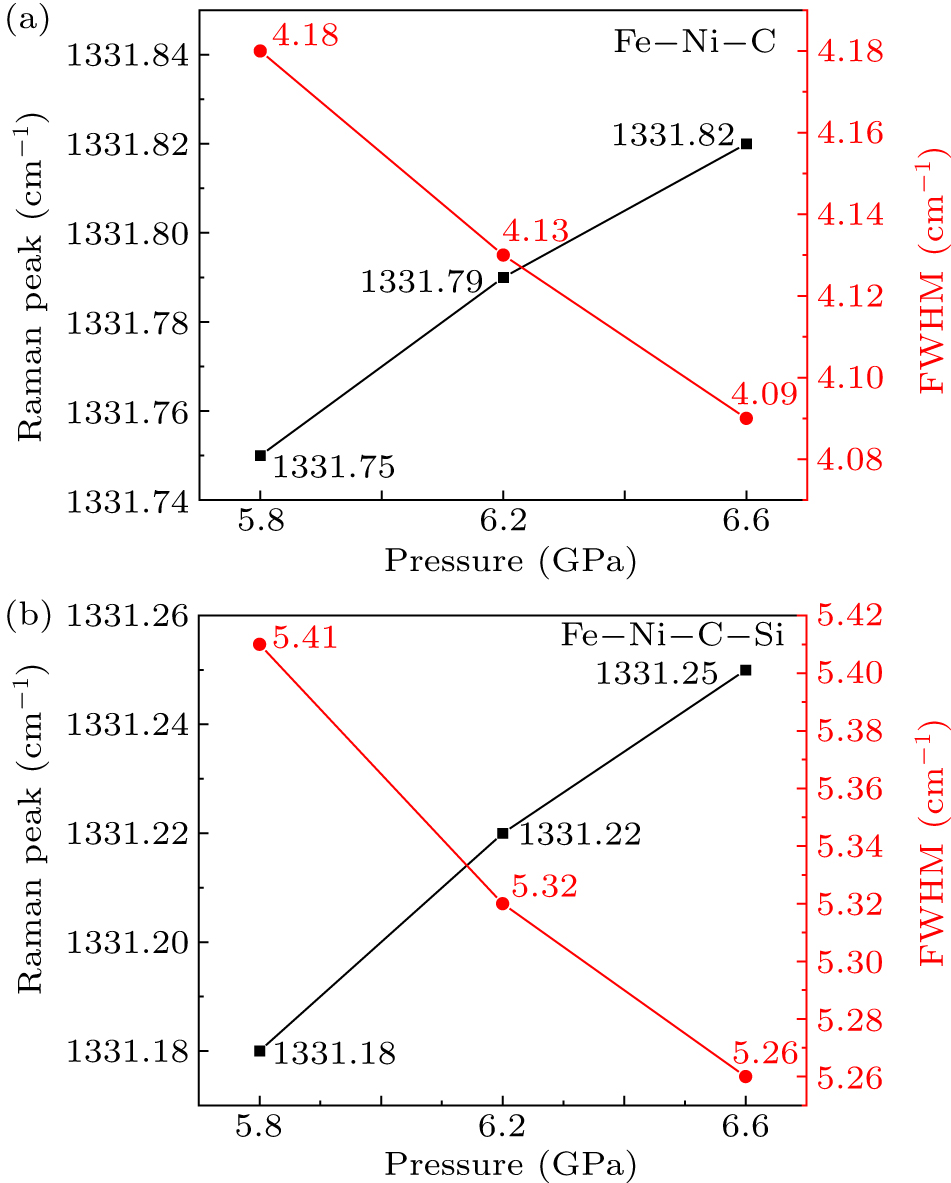
Figure 8. Changes in Raman peak position and full-width at half-peak of synthesized diamond crystals under different pressure conditions. (a) Fe–Ni–C system. (b) Fe–Ni–C–Si system.
-
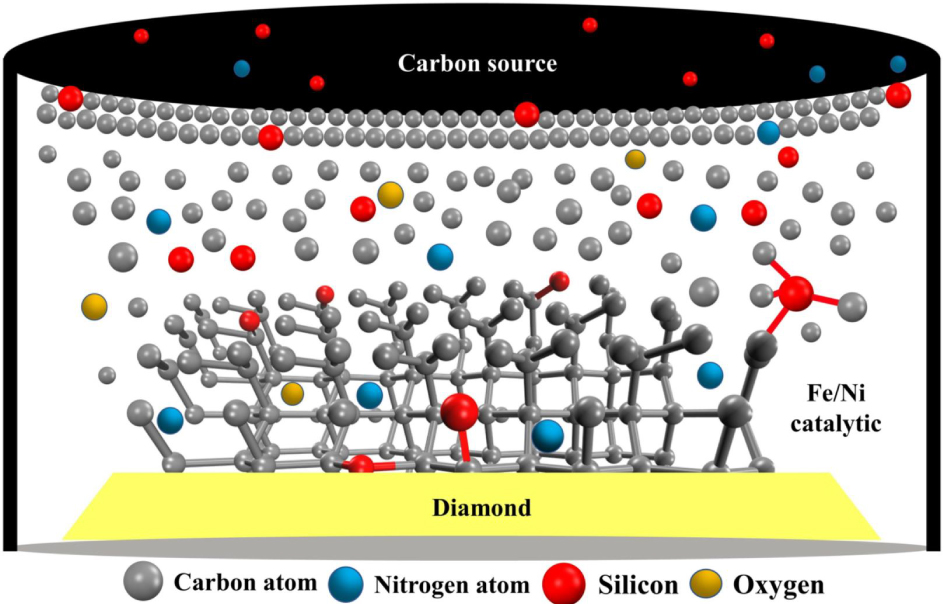
Figure 9. Schematic diagram of the conceptual diamond crystal growth process as observed in the Fe–Ni–C–Si system.
Figure
9 ,Table
2 个