-
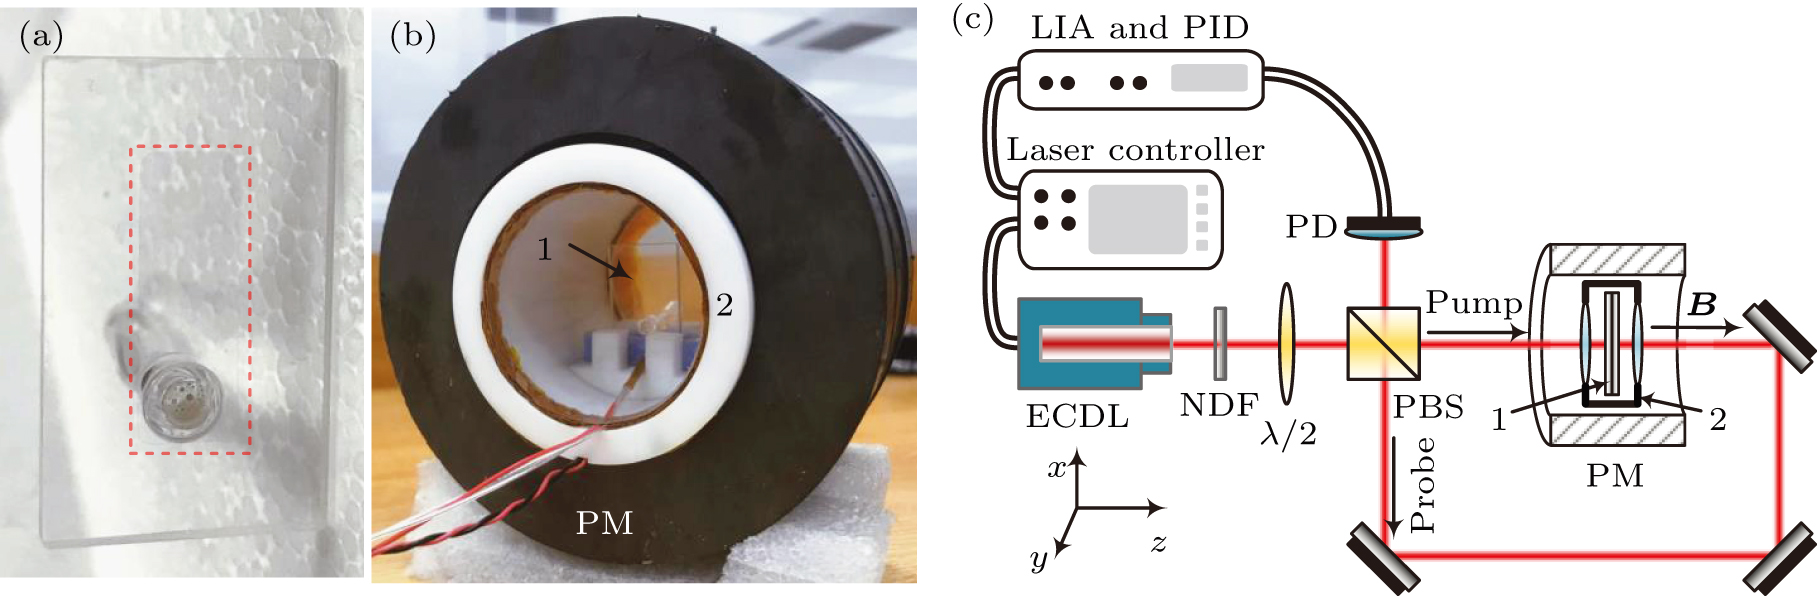
Figure 1. (a) The MC used in experiments, and the red dashed square marks the thin chamber where Cs atoms are sealed. (b) The setup with the MC placed in the heating furnace and the PM: (1) MC, (2) furnace. (c) Schematic diagram of the experimental setup. LIA: lock-in amplifier, PID: proportional-integral-derivative module, PD: photodetector, ECDL: external cavity diode laser, NDF: neutral density filter, λ/2: half-wave plate, PBS: polarization beam splitter, PM: permanent magnet ring.
-
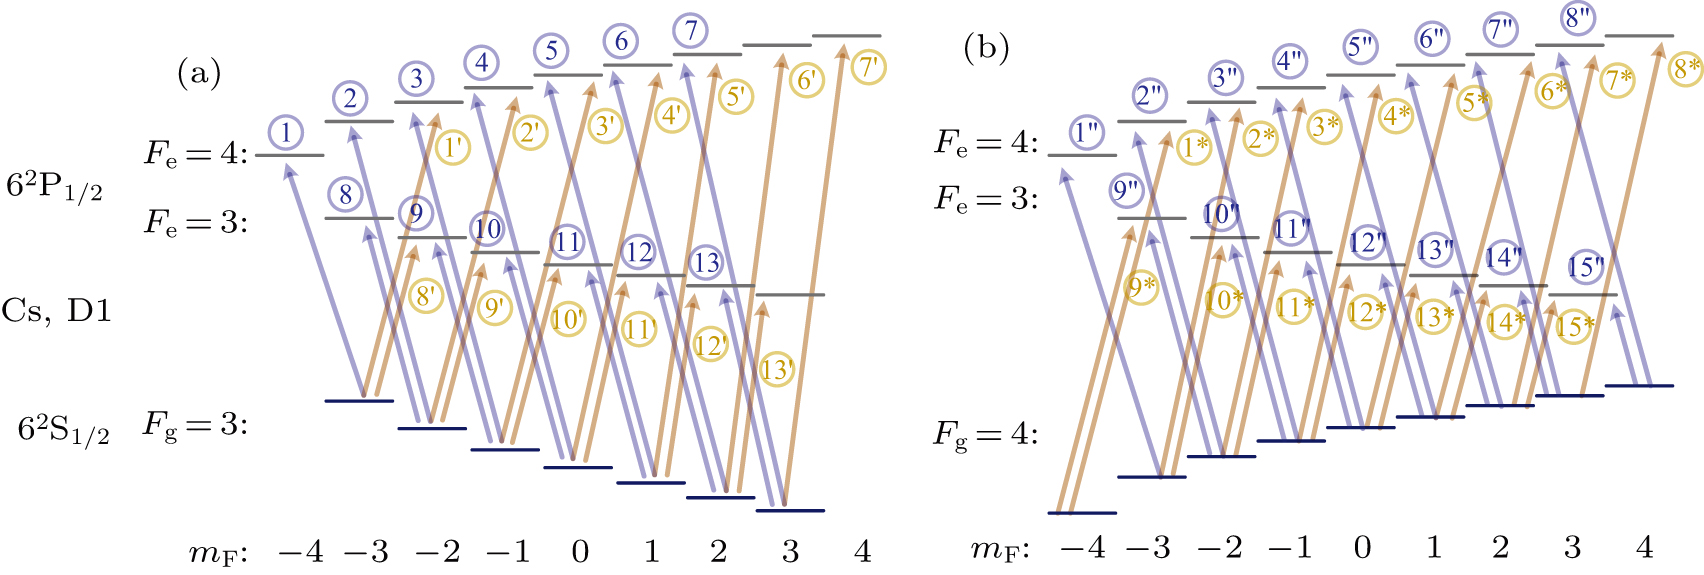
Figure 2. Hyperfine Zeeman splitting of Cs D1 transitions, where the transitions of Fg = 3 ↔ Fe = 3, 4 and Fg = 4 ↔ Fe = 3, 4 are outlined in (a) and (b), and labeled by 1–13, 1′–13′ and 1″–15″, 1*–15*, respectively, with σ− and σ+ transitions distinguished by the blue and yellow arrows.
-
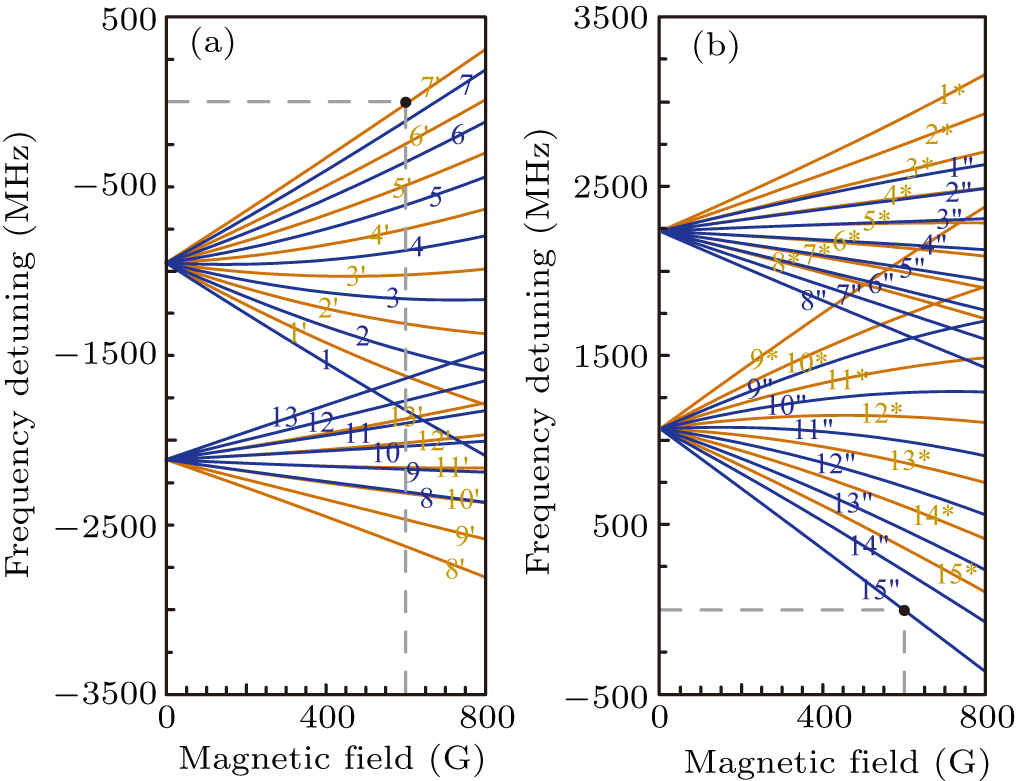
Figure 3. Frequencies of transitions 1–13, 1′–13′ [blue and yellow lines in (a)] and transitions 1″–15″, 1*–15* [blue and yellow lines in (b)] at different magnetic field strengths, with transitions 7′ and 15″ in 600-G magnetic field assigned as the origins of frequency detuning (shown by the black dots).
-
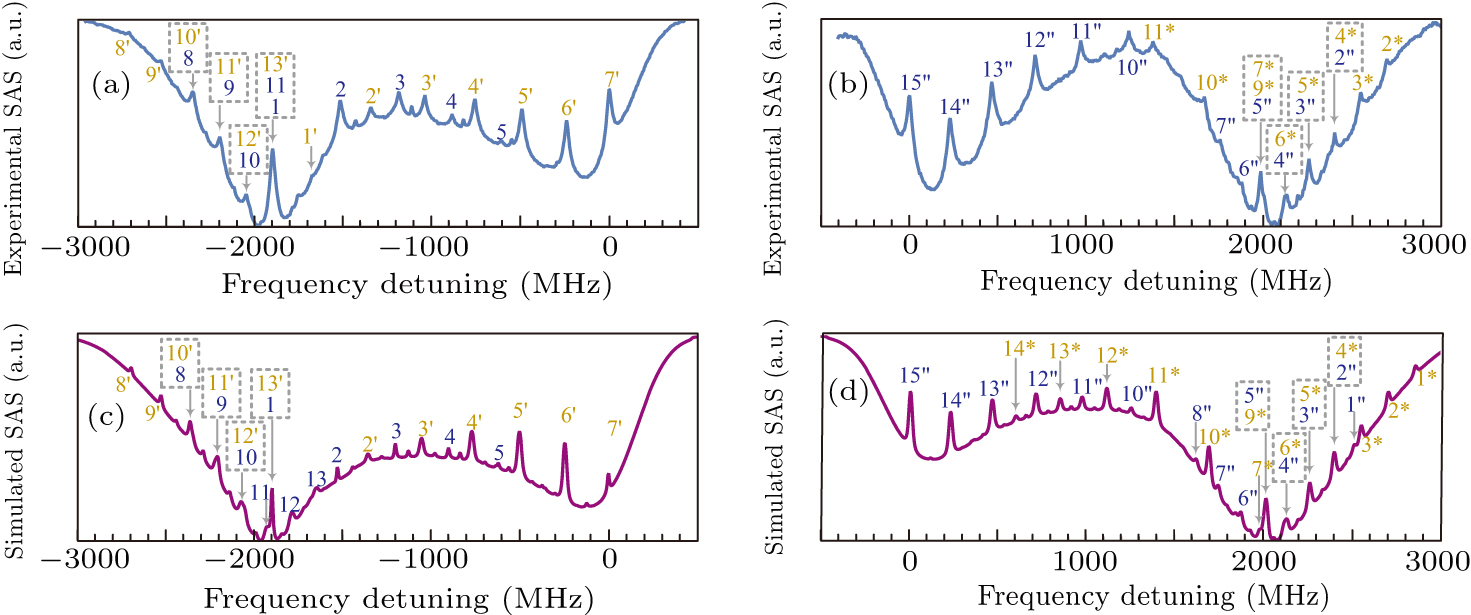
Figure 4. [(a), (b)] Experimental saturated absorption spectra (SAS) of Fg = 3 ↔ Fe = 3,4 and Fg = 4 ↔ Fe = 3,4 using the MC at magnetic-field strength of about 600 G, with the transitions marked on corresponding spectral lines. The dashed squares indicate the transitions that are very close in frequency with mutually overlapped spectral lines. [(c), (d)] Theoretically calculated saturated absorption spectra of Fg = 3 ↔ Fe = 3,4 and Fg = 4 ↔ Fe = 3,4 at the same magnetic-field strength, with transitions marked.
-
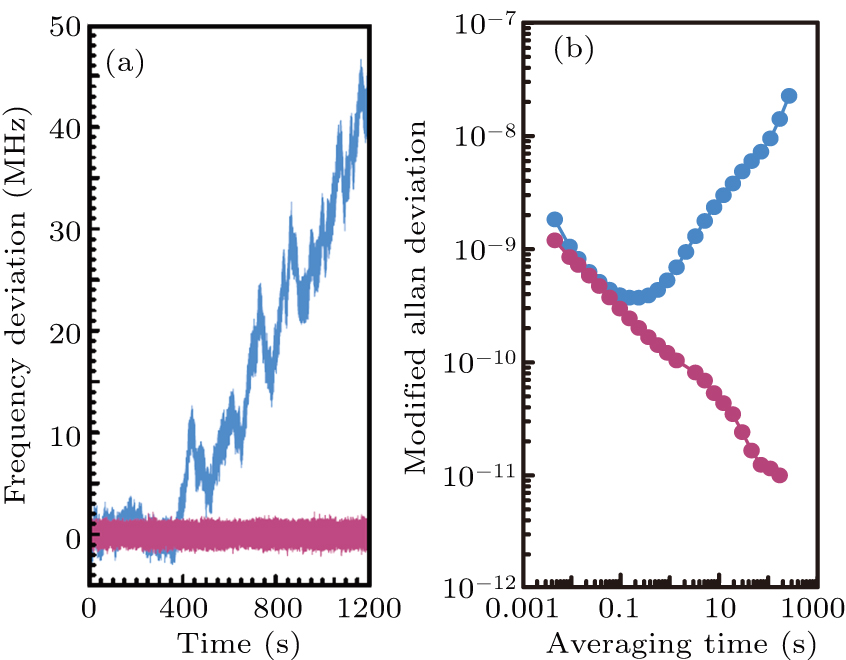
Figure 5. (a) Frequency deviation of ECDL for 1200 s in both frequency-stabilized state (red line) and free-running state (blue line), where transition 7′ is used as the frequency reference. (b) Modified Allan deviation obtained from ECDL in both frequency-stabilized state (red dotted line) and free-running state (blue dotted line) at different averaging times.
Figure
5 ,Table
0 个