-
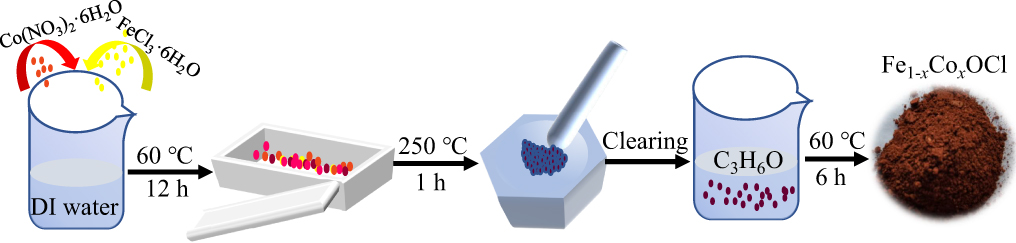
Figure 1. Schematic illustration of the synthesis of Fe1−xCoxOCl.
-
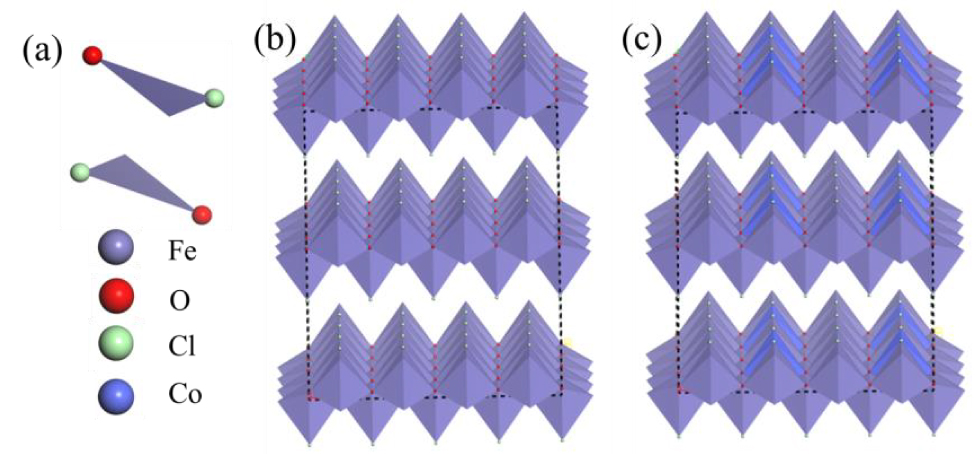
Figure 2. Structure of a primitive bulk unit (a), supercell of FeOCl crystal (b) and supercell of Co doped FeOCl crystal (c).
-
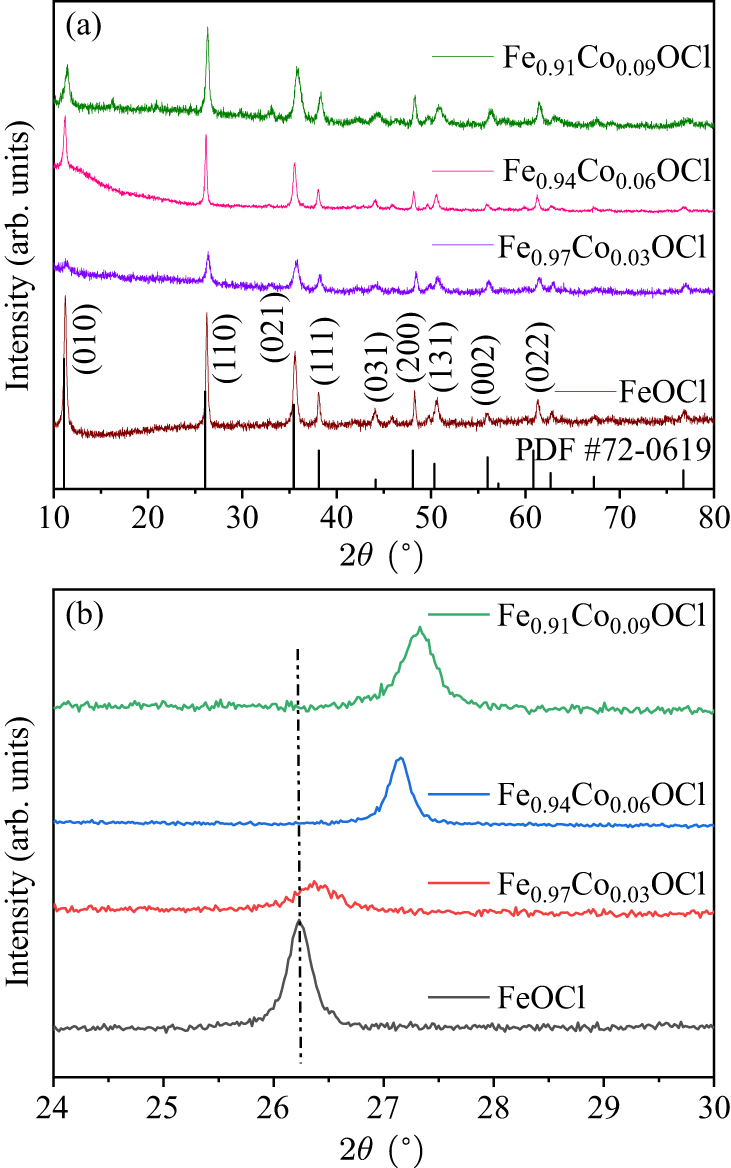
Figure 3. (a) and (b) XRD patterns and diffraction peaks of Fe1−xCoxOCl.
-
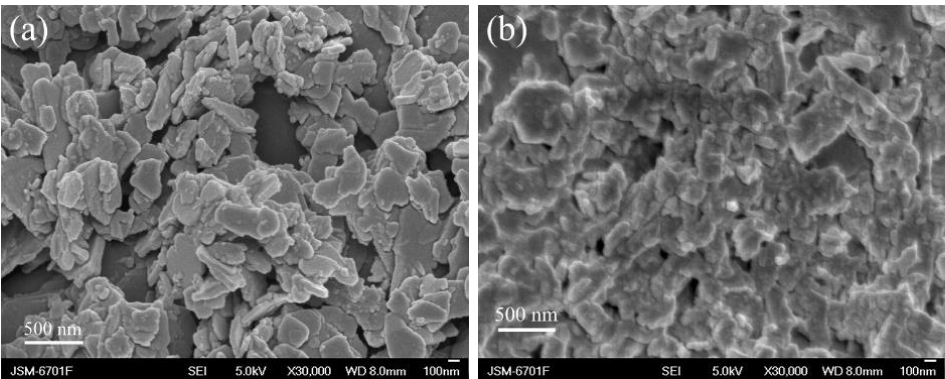
Figure 4. SEM images of (a) FeOCl and (b) Fe0.94Co0.06OCl.
-
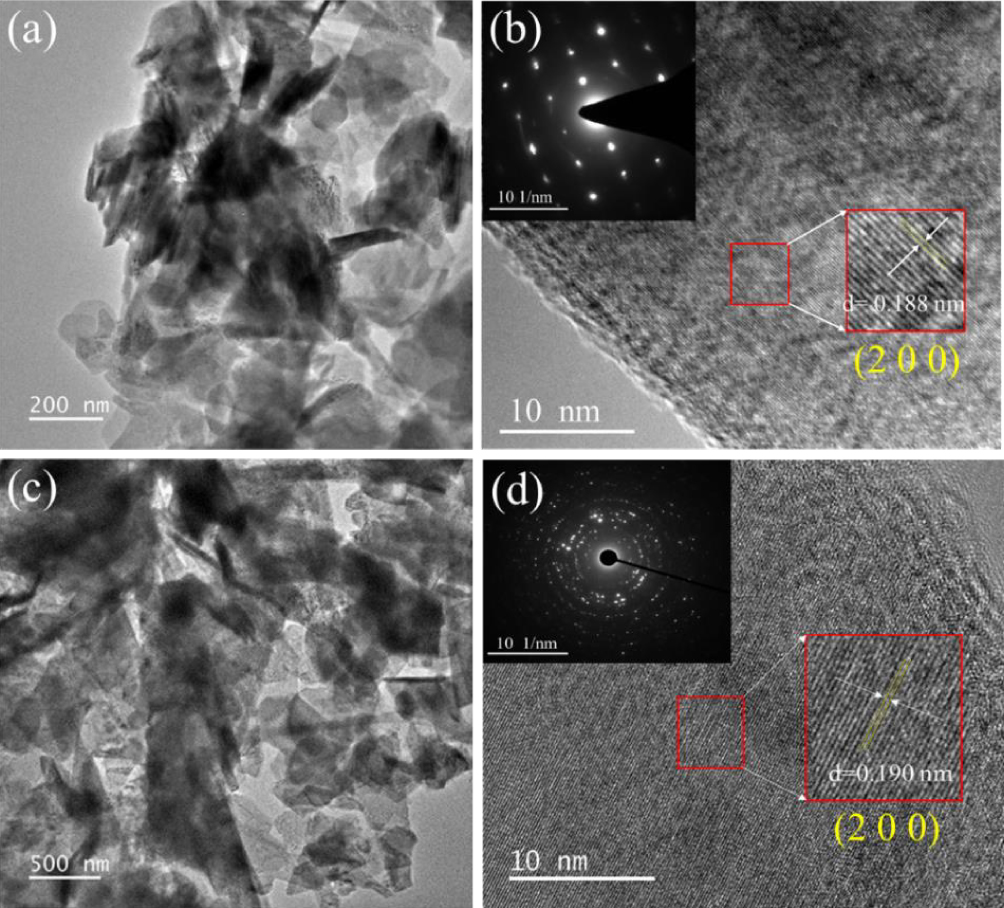
Figure 5. TEM and HRTEM images of [(a) and (b)] FeOCl and [(c) and (d)] Fe0.94Co0.06OCl.
-
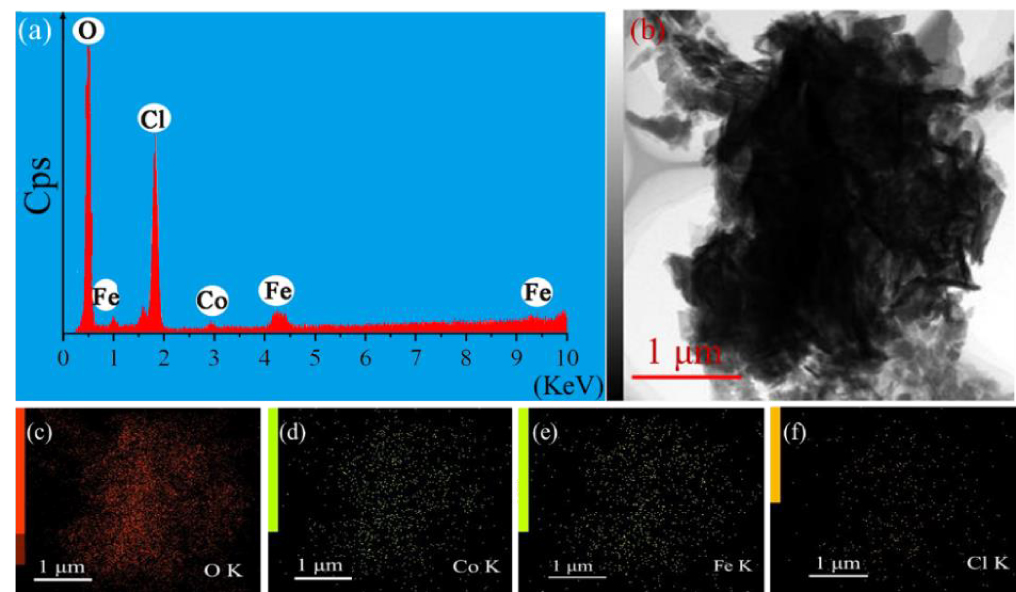
Figure 6. (a) EDS pattern and (c)–(f) the corresponding element mappings for Fe0.94Co0.06OCl.
-
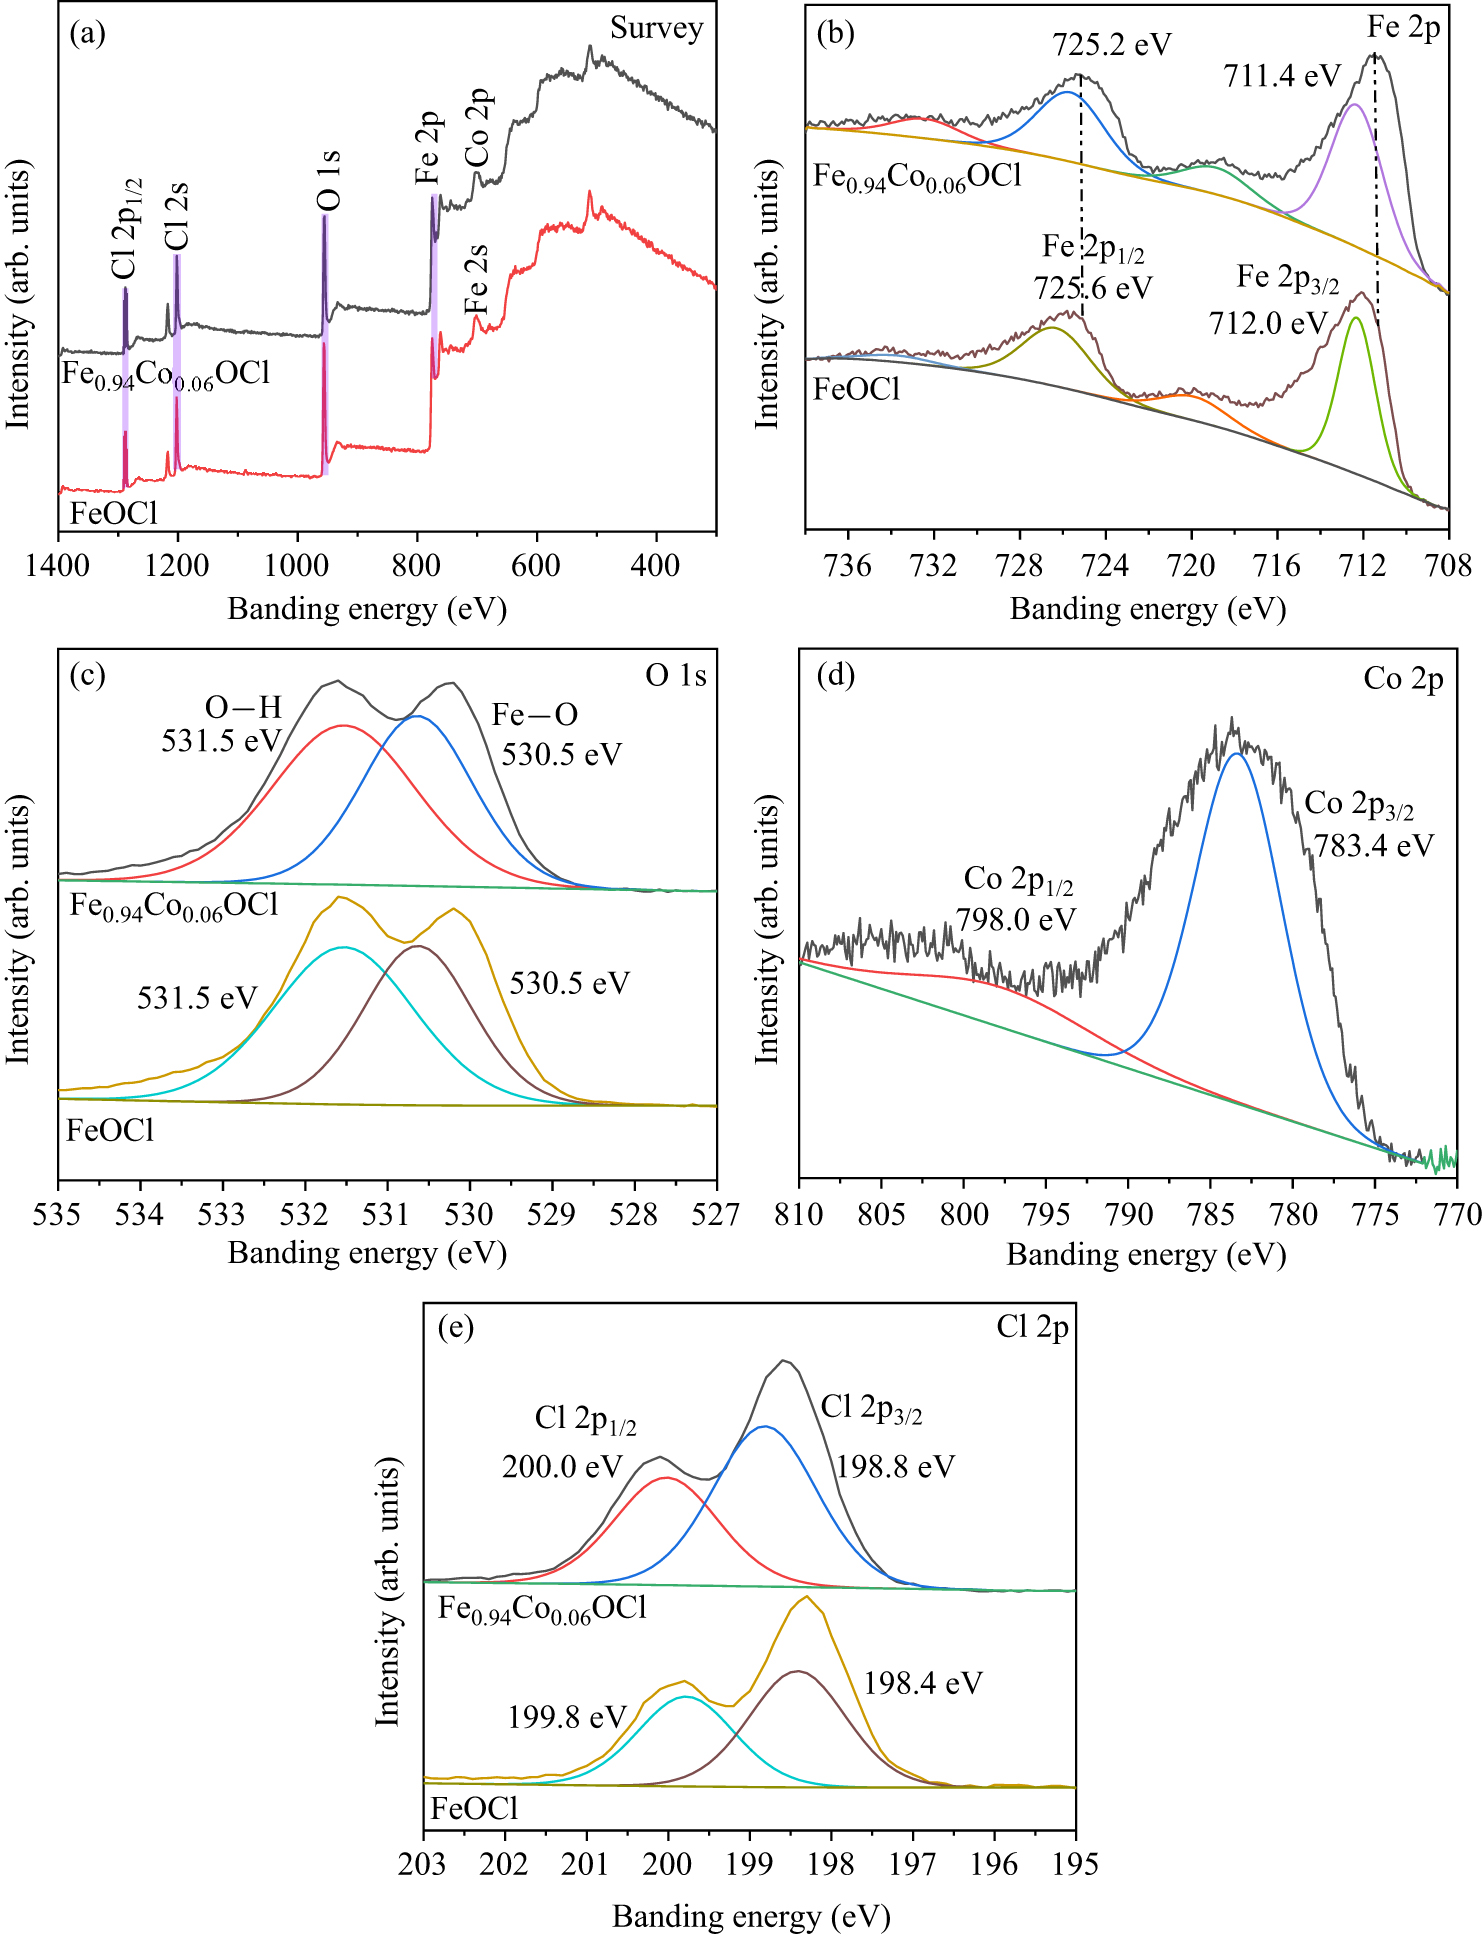
Figure 7. High resolution XPS: (a) survey spectra, (b) Fe 2p, (c) O 1s, (d) Co 2p and (e) Cl 2p of FeOCl and Fe0.94Co0.06OCl.
-
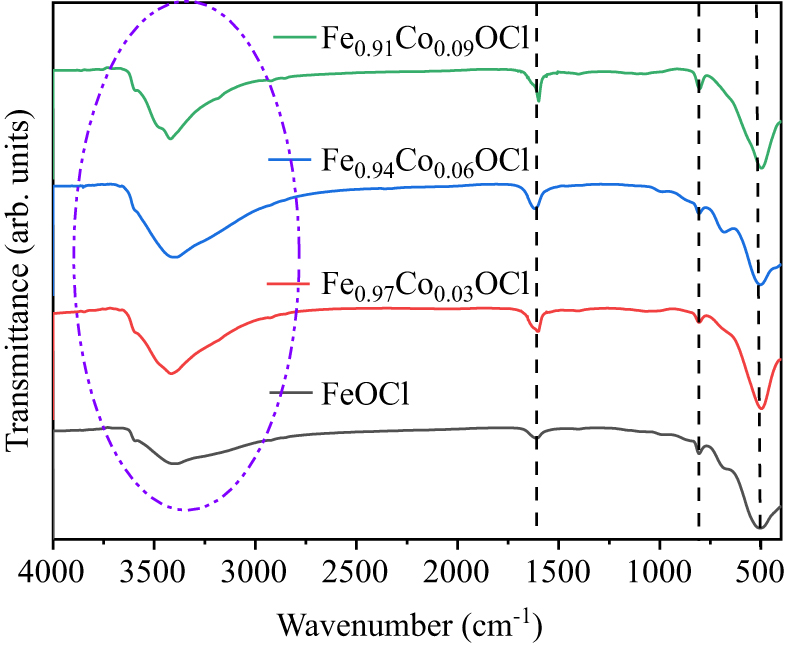
Figure 8. FT-IR spectra of Fe1−xCoxOCl.
-
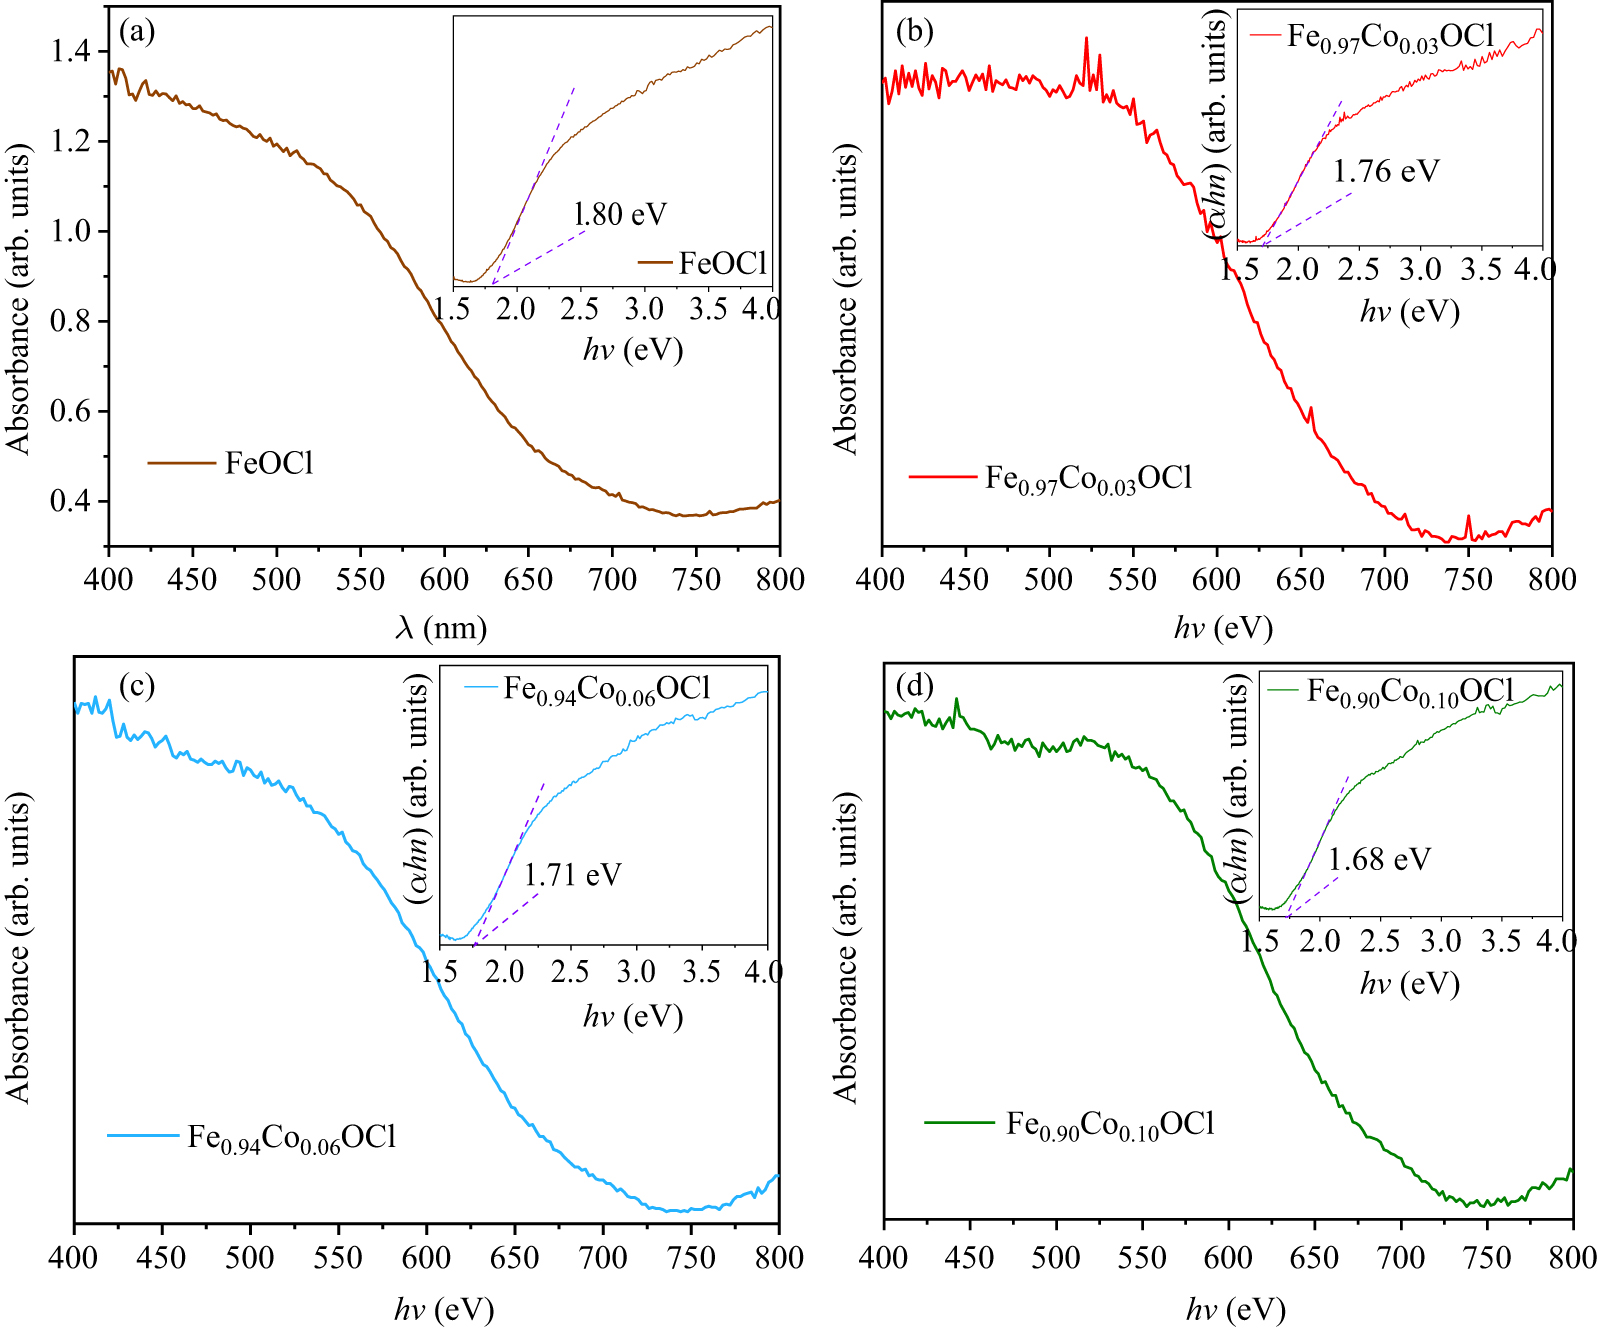
Figure 9. (a)–(d) UV–visible absorption spectra. The insets show the (αhv)1/2–hv curve of Fe1−xCoxOCl.
-
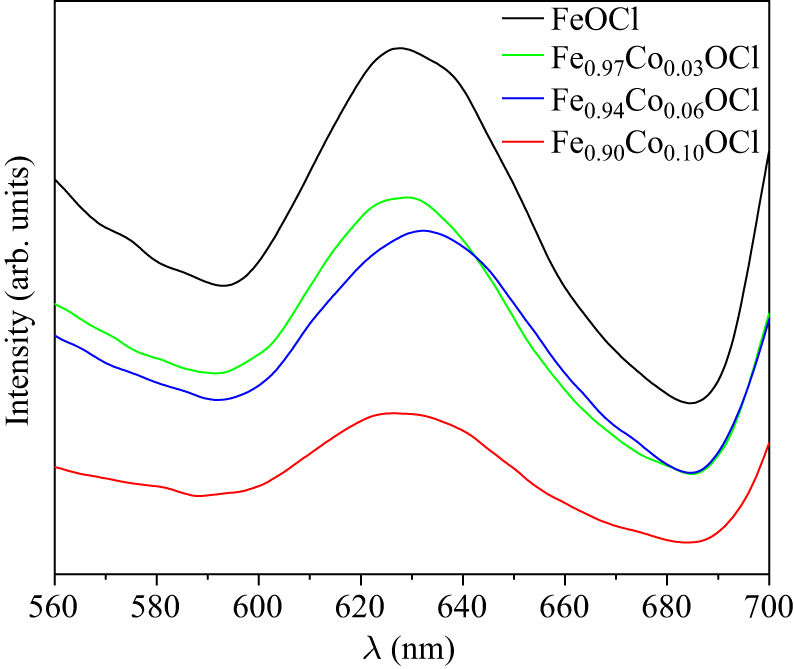
Figure 10. PL spectrum of Fe1−xCoxOCl.
-
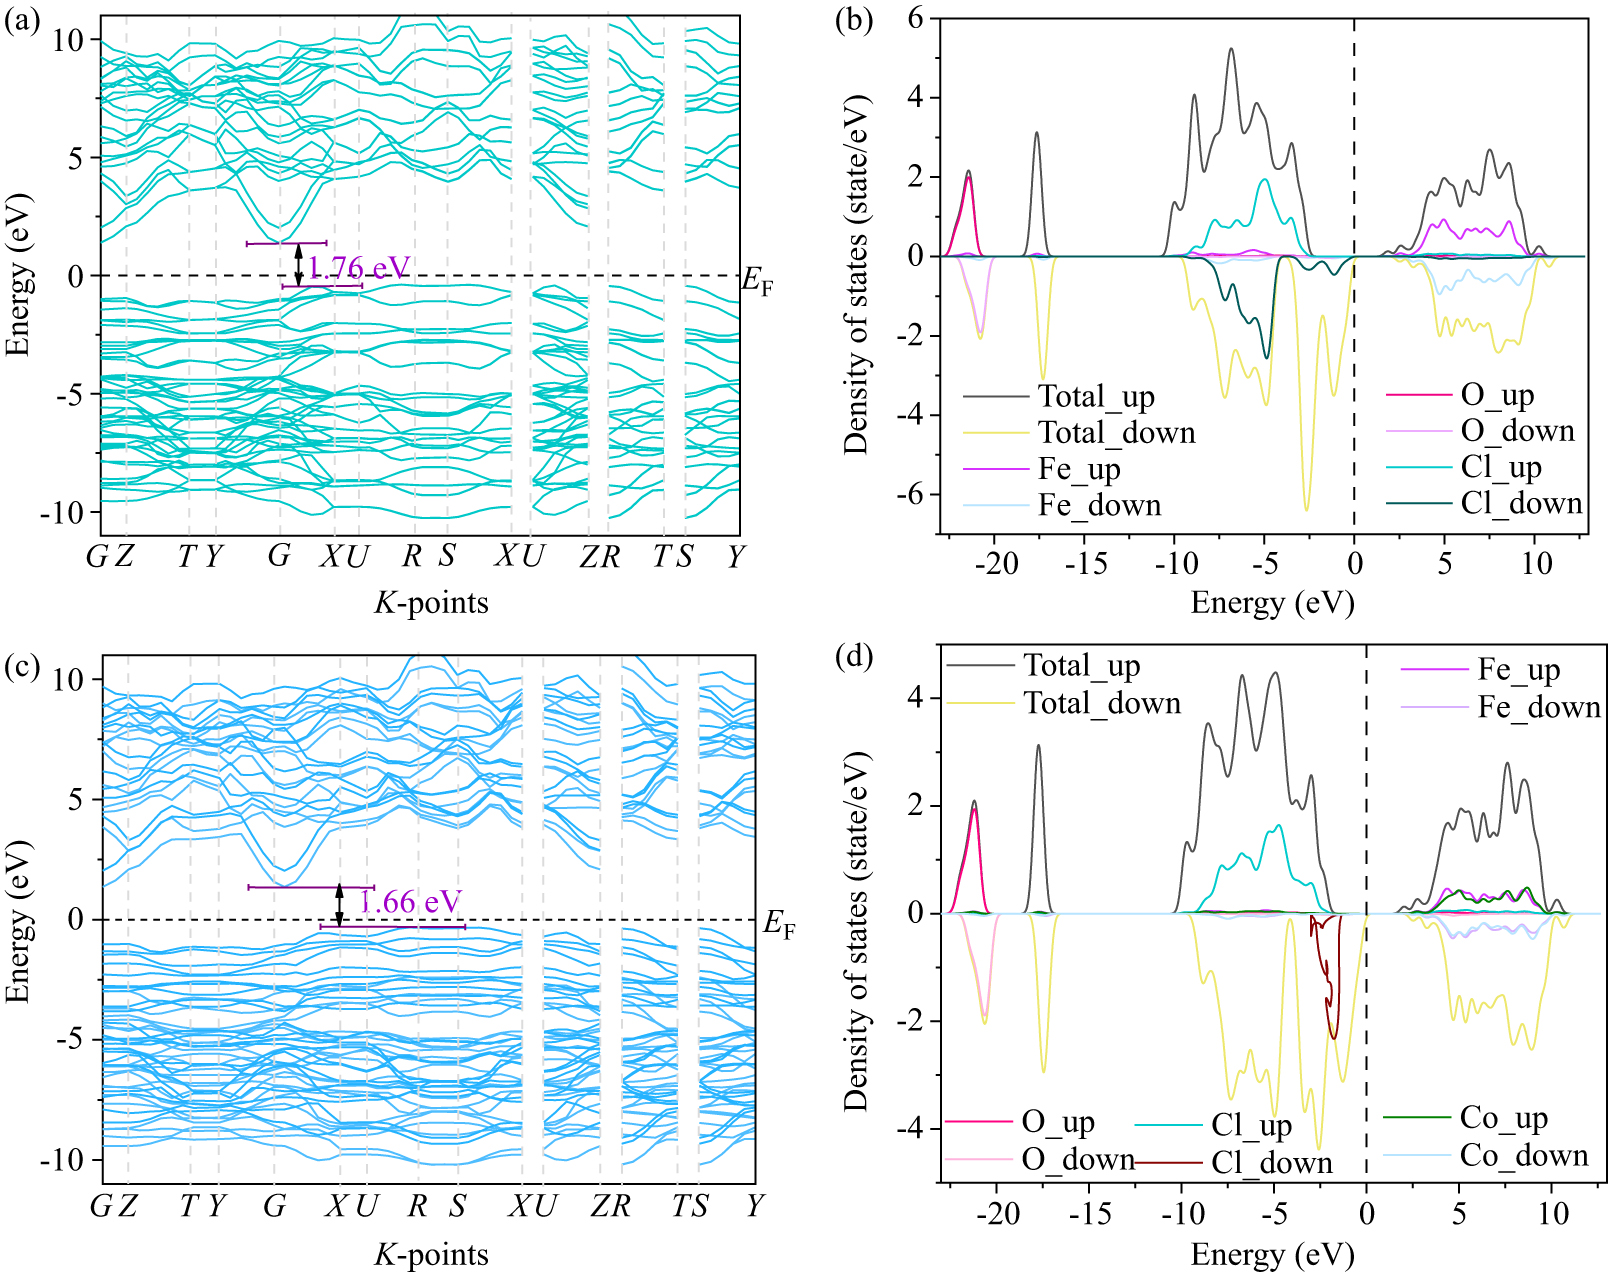
Figure 11. Calculated band structure and density of states of [(a) and (b)] FeOCl and [(c) and (d)] Fe0.94Co0.06OCl.
-
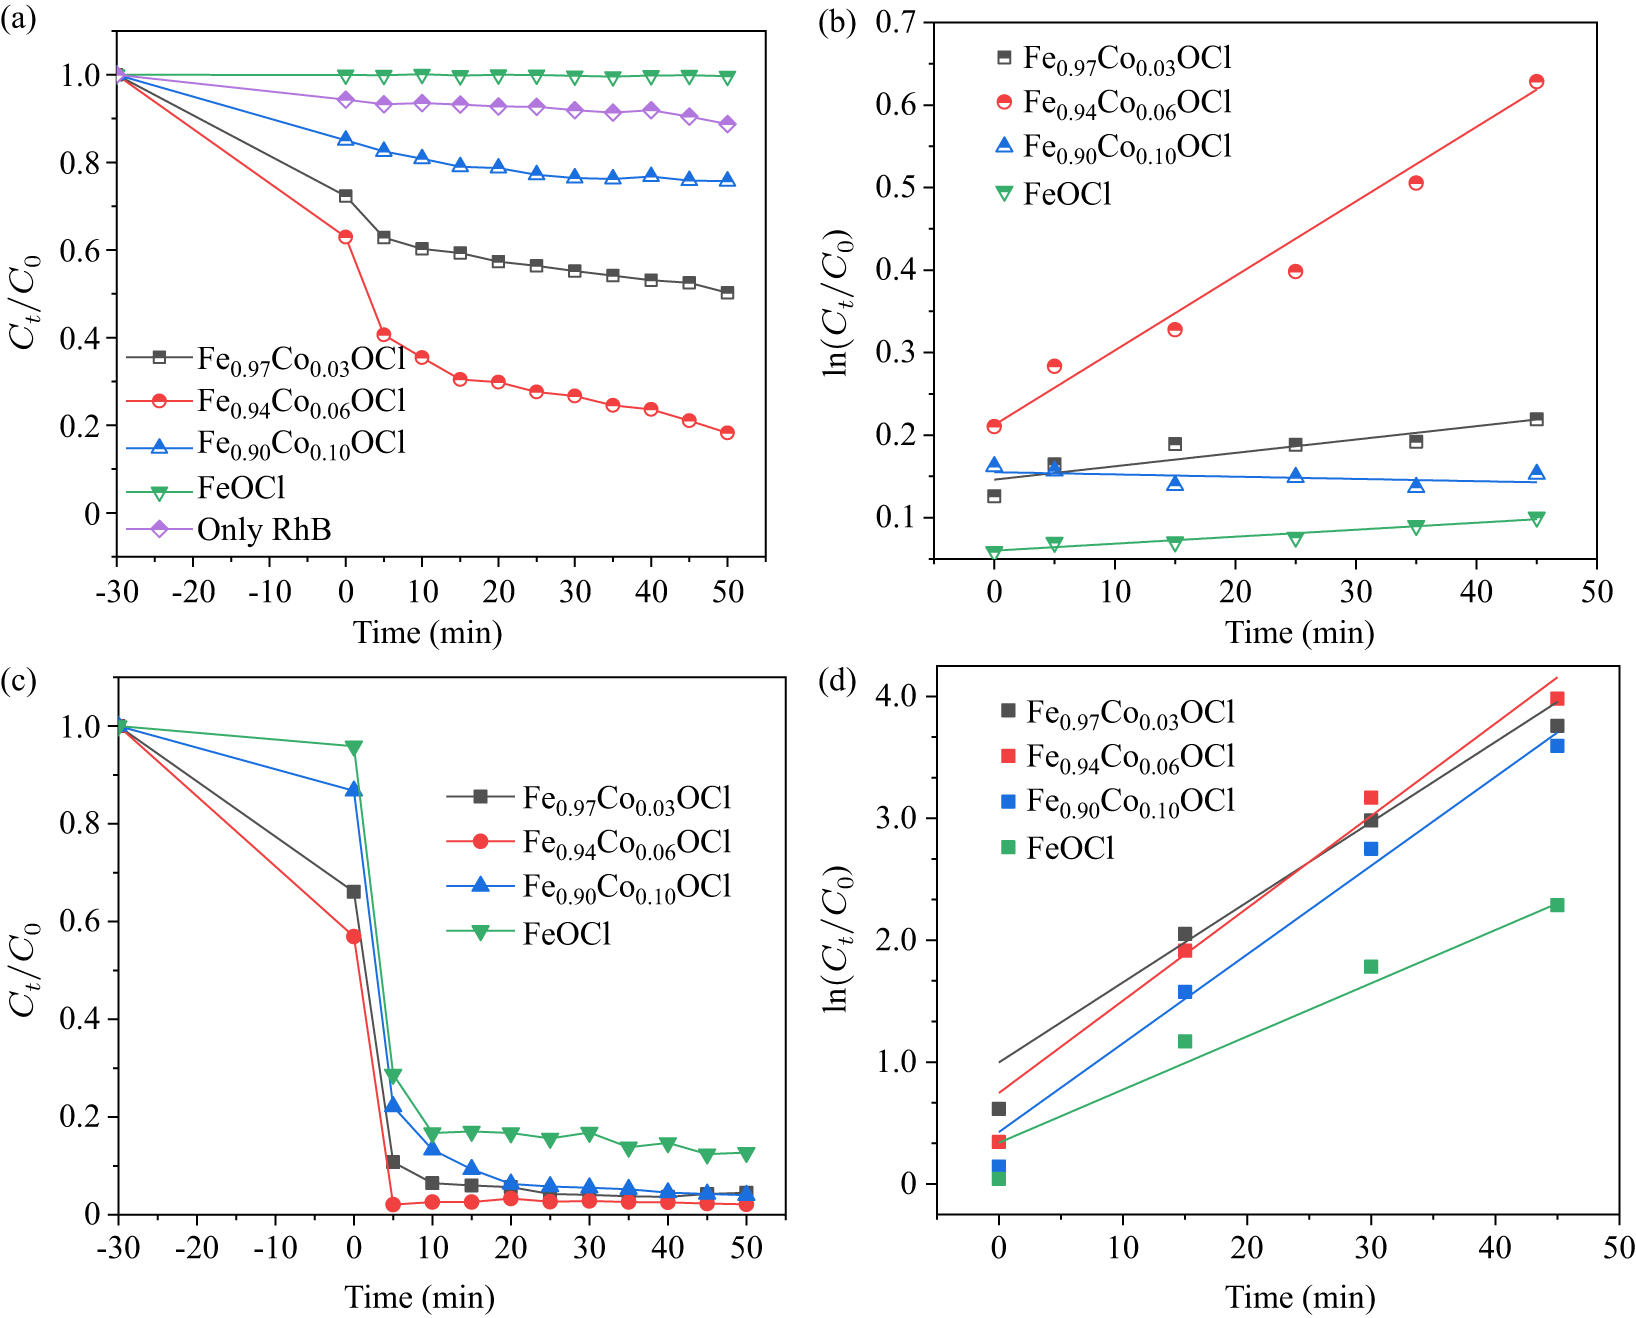
Figure 12. (a) Photocatalytic degradation, (c) photo-Fenton degradation and [(b) and (d)] the corresponding kinetic plots over Fe1−xCoxOCl.
-
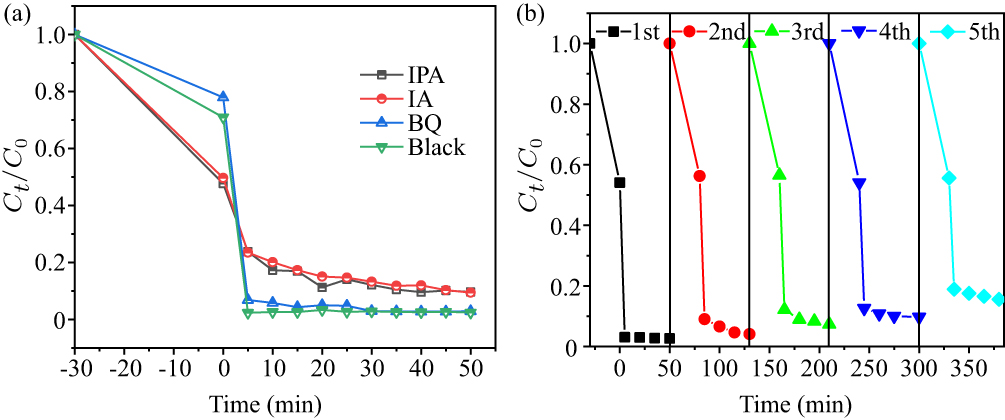
Figure 13. (a) Effects of different capture agents and (b) recyclability of five runs in the presence of Fe0.94Co0.06OCl.
-
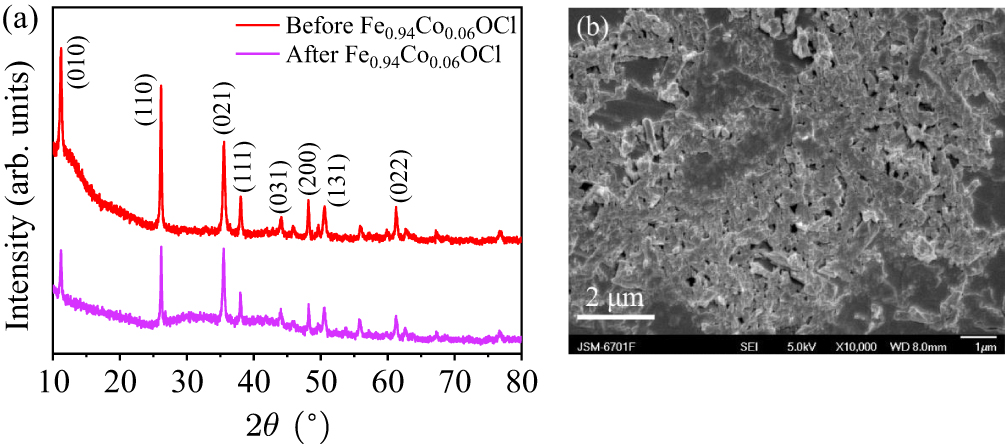
Figure 14. (a) XRD patterns and (b) SEM images of Fe0.94Co0.06OCl photocatalyst before and after the photo-Fenton degradation experiment.
-
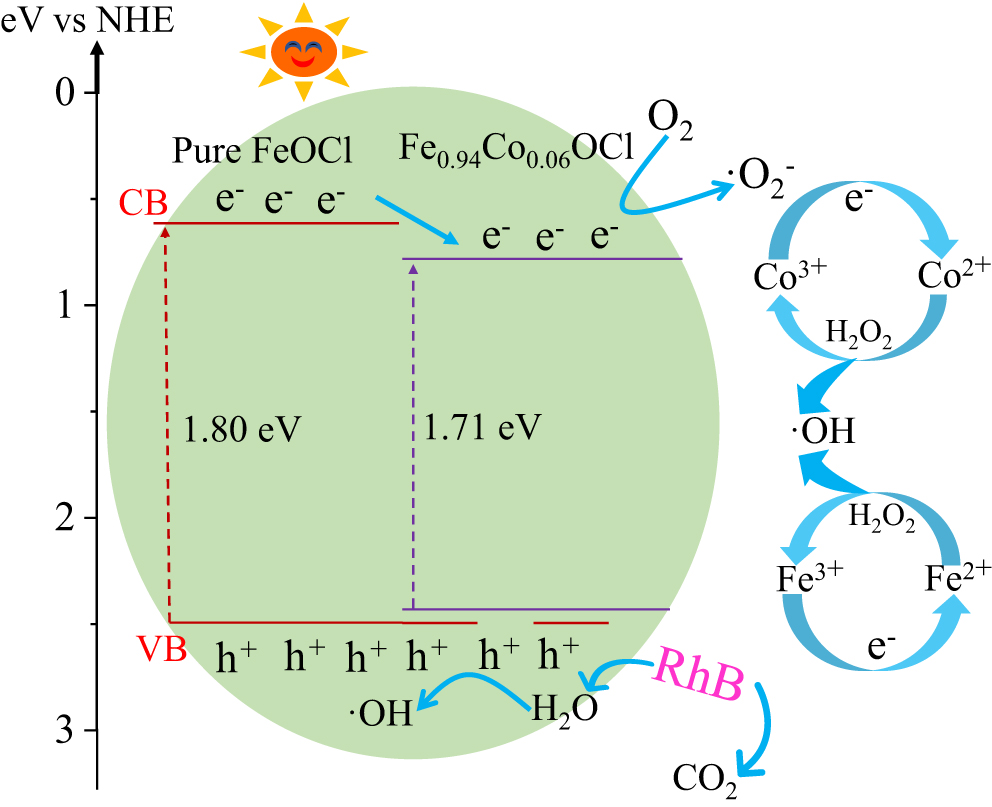
Figure 15. Catalytic mechanism in the Fe0.94Co0.06OCl system (vs NHE: versus normal hydrogen electrode).
Figure
15 ,Table
1 个