-
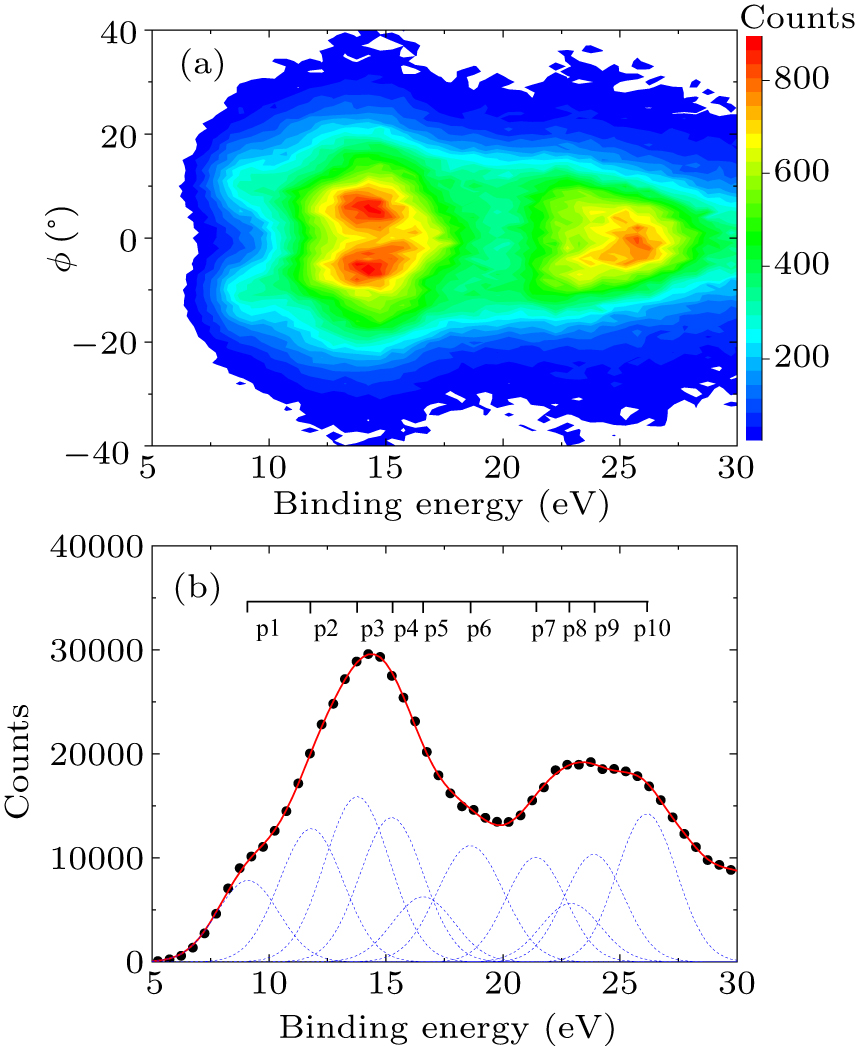
Figure 1. (a) The measured valence electron density map of toluene. (b) The total binding energy spectrum. Ten Gaussian peaks (dashed lines) are used to fit the spectrum and their summed profile is denoted by the solid line.
-
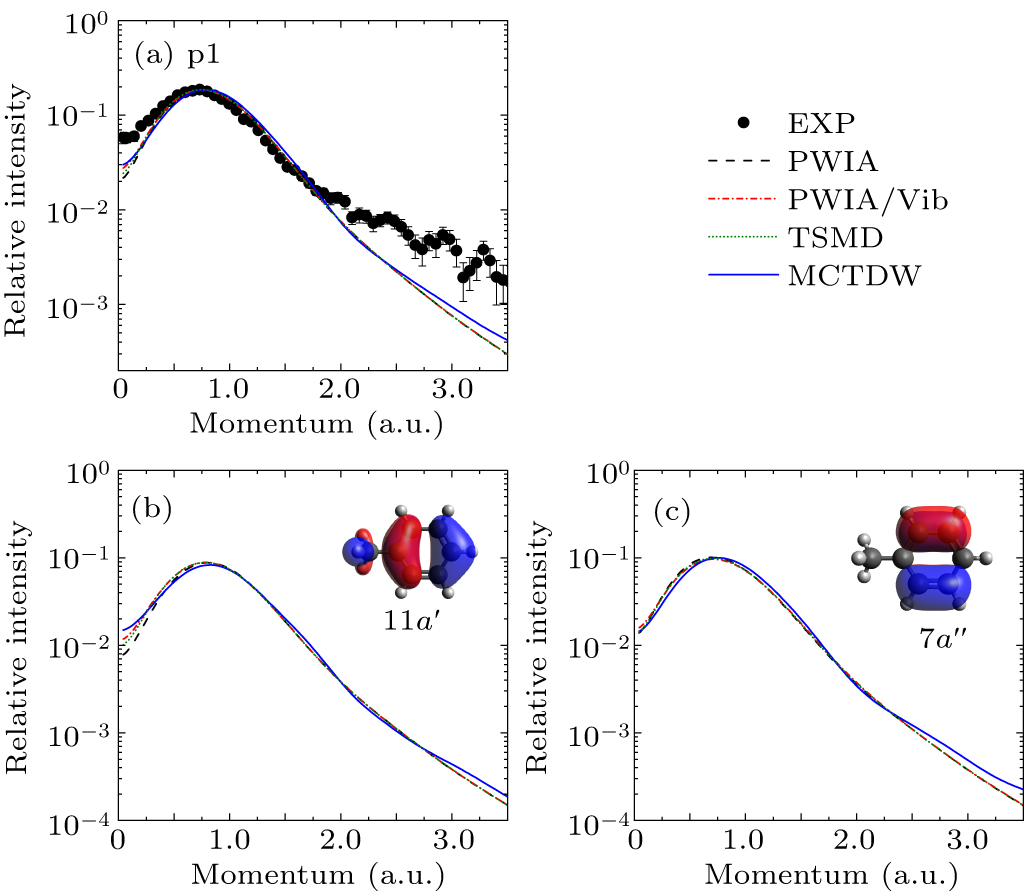
Figure 2. (a) Experimental and theoretical EMDs for p1. Panels (b) and (c) illustrate the theoretical EMDs of 11a′ and 7a″, respectively, together with the orbital map calculated by B3LYP/aug-cc-pVTZ.
-
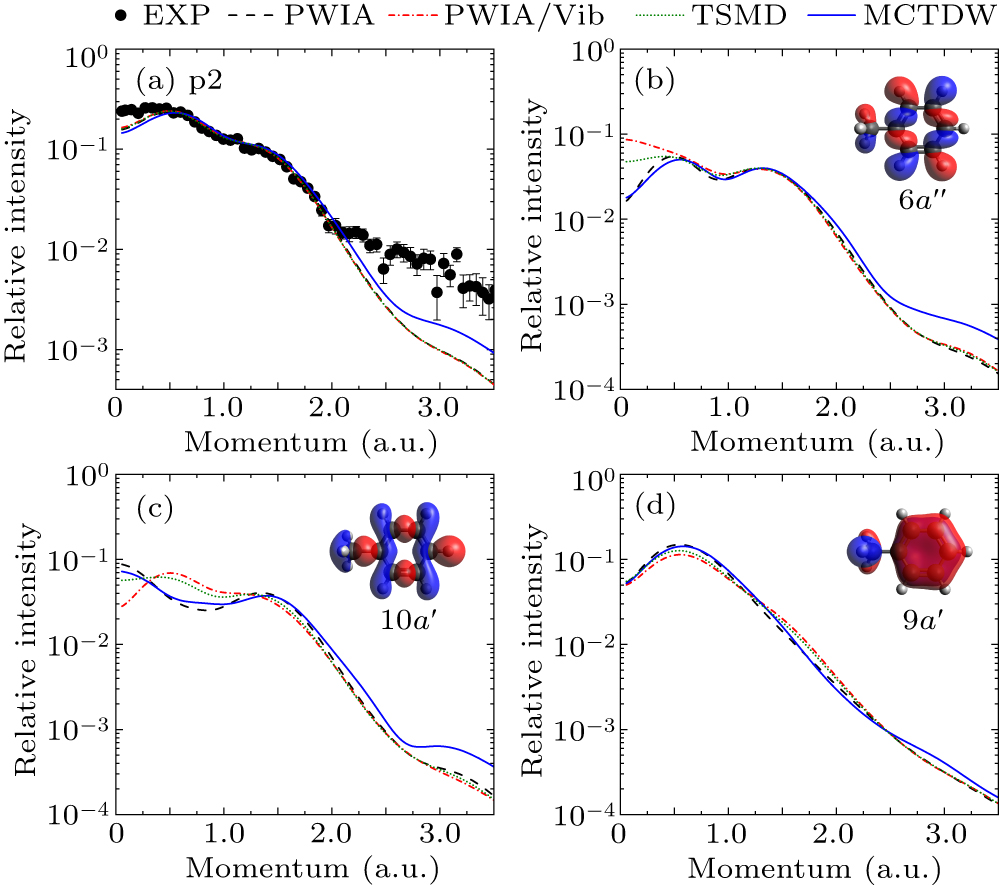
Figure 3. (a) Experimental and theoretical EMDs for p2. Panels (b), (c), and (d) illustrate the theoretical EMD of individual MO 6a″, 10a′, and 9a′, respectively, together with the orbital map calculated by B3LYP/aug-cc-pVTZ.
-

Figure 4. (a) Experimental and theoretical EMDs for p3. Panels (b), (c), (d), and (e) illustrate the theoretical EMD of individual MO 5a″, 8a′, 4a″, and 7a′, respectively, as well as the orbital map calculated by B3LYP/aug-cc-pVTZ.
-
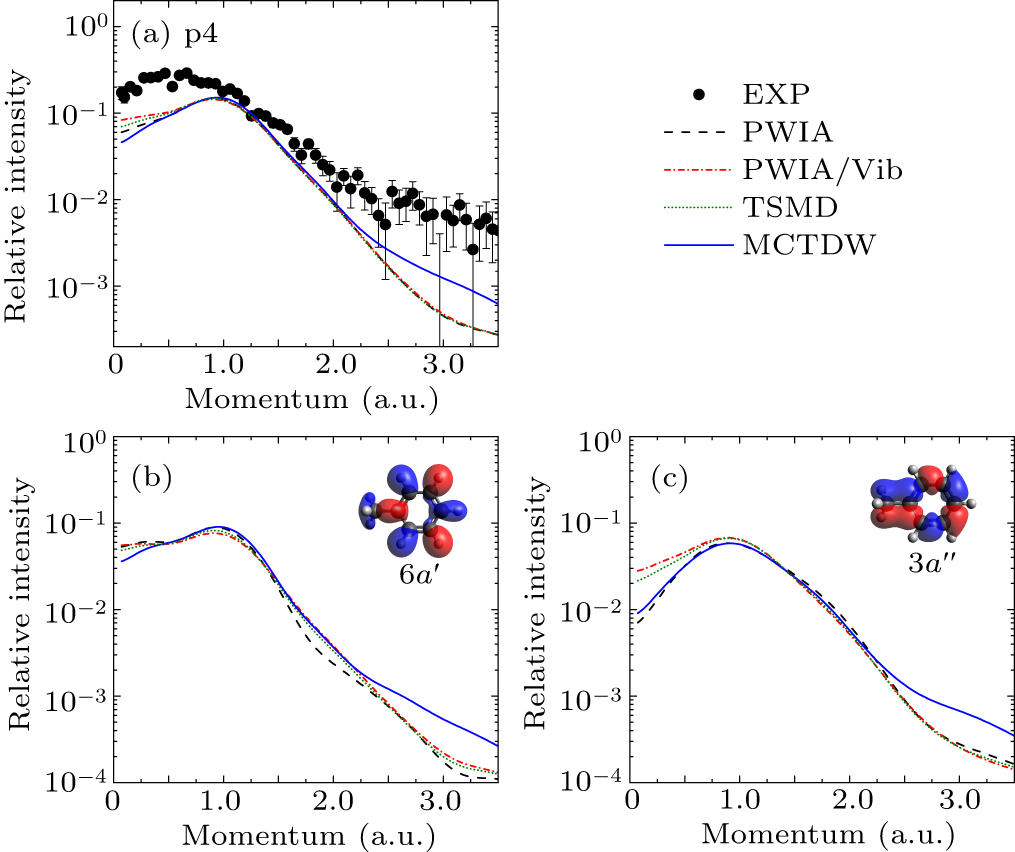
Figure 5. (a) Experimental and theoretical EMDs for p4. Panels (b) and (c) illustrate the individual EMDs of 6a′ and 3a″, respectively, together with the orbital map calculated by B3LYP/aug-cc-pVTZ.
-
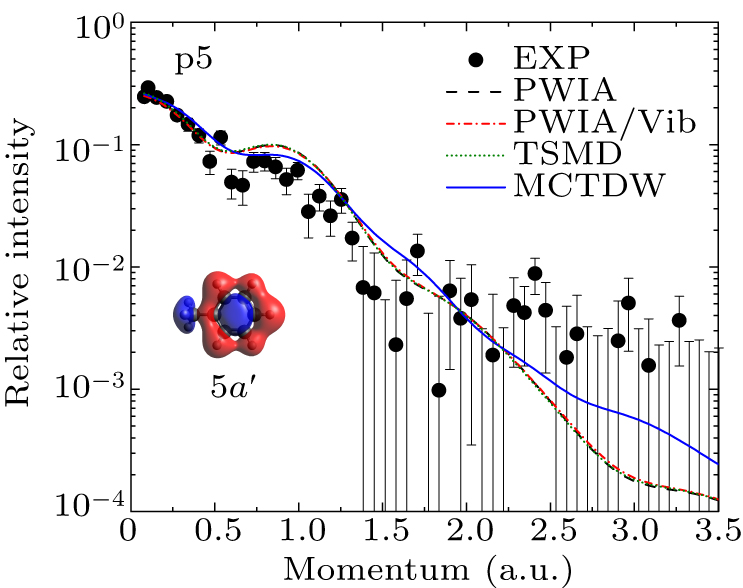
Figure 6. Experimental and theoretical EMDs for p5 and the orbital map calculated by B3LYP/aug-cc-pVTZ.
-
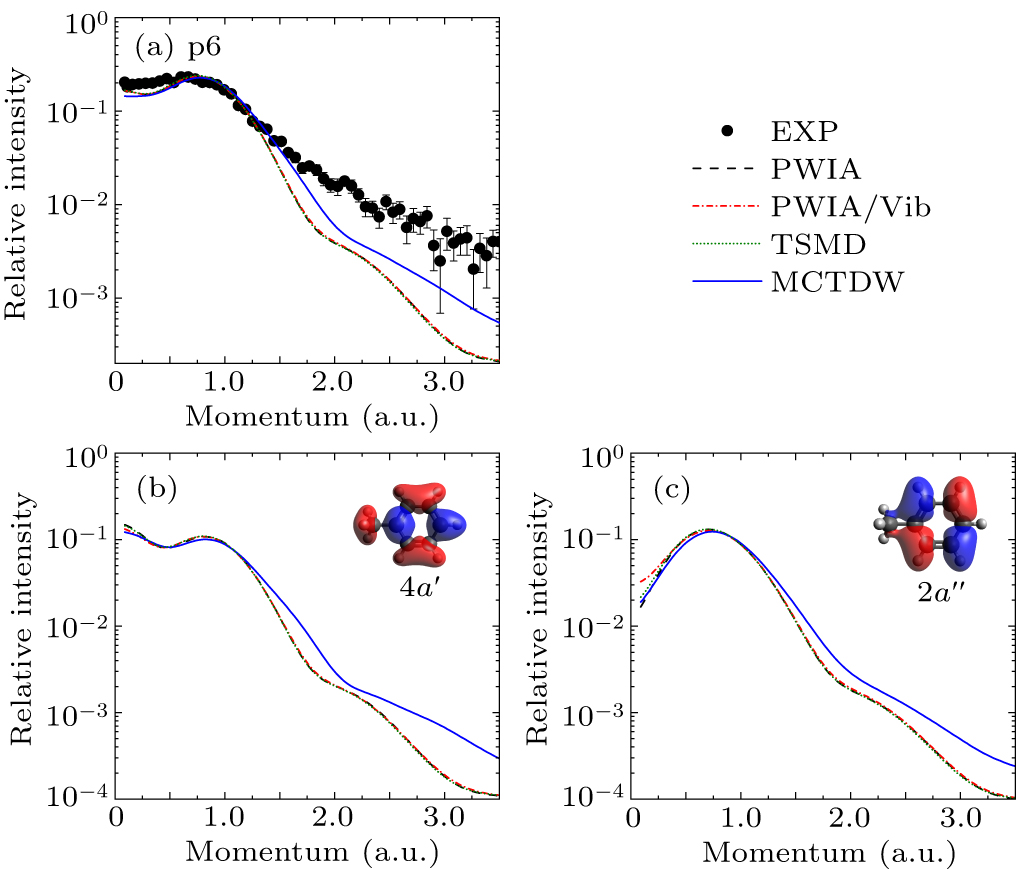
Figure 7. (a) Experimental and theoretical EMDs for p6. Panels (b) and (c) illustrate the theoretical EMD of individual MO 4a′ and 2a″, respectively, along with the orbital map calculated by B3LYP/aug-cc-pVTZ.
-
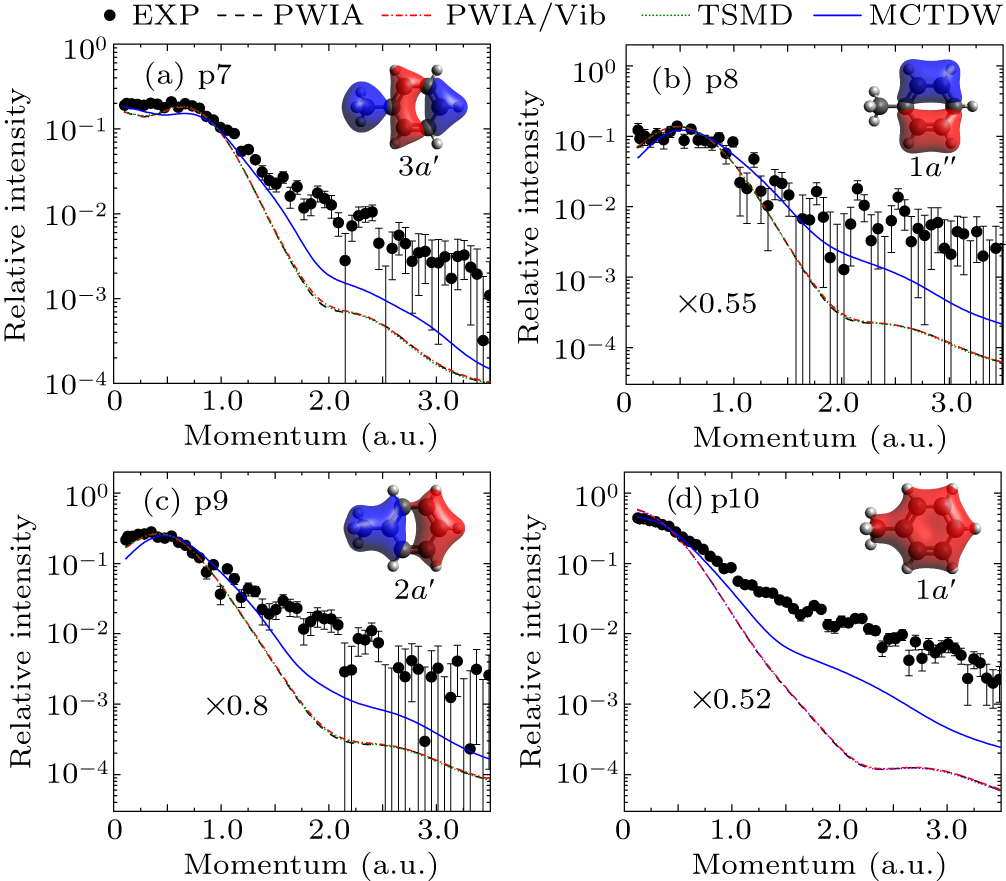
Figure 8. Experimental and theoretical EMDs for inner-valence orbitals (a) p7, (b) p8, (c) p9, and (d) p10.
Figure
8 ,Table
1 个