-
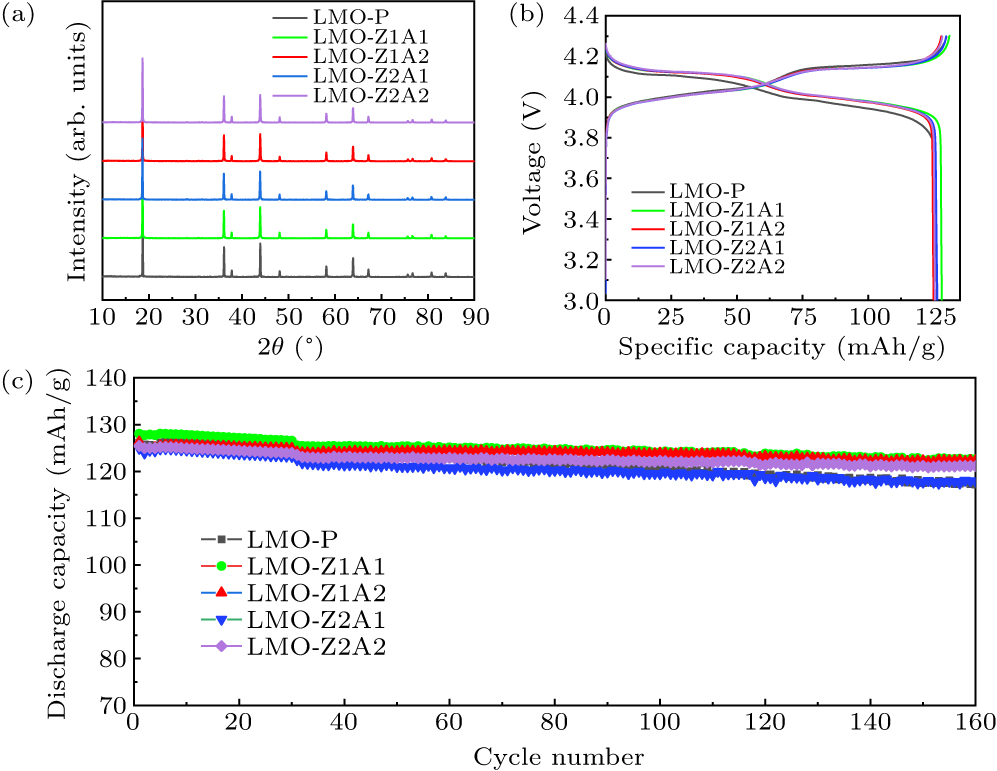
Figure 1. (a) Powder XRD patterns of LMO-P and Al–Zr dual-doped LMO samples. (b) The first charge and discharge curves at 0.1 C and (c) the capacities at 1 C of LMO-P and Al–Zr dual-doped LMO samples.
-
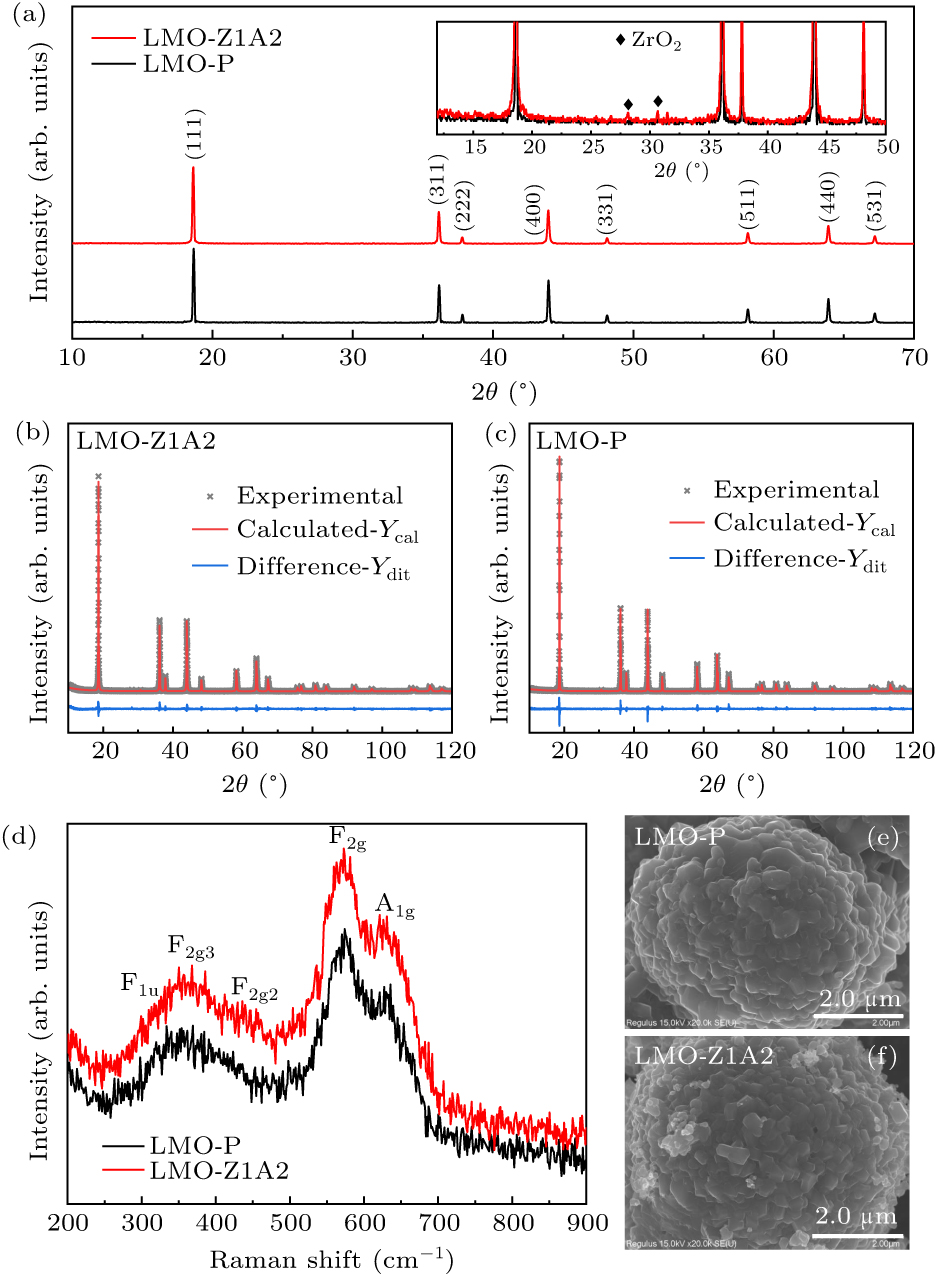
Figure 2. (a) Powder XRD patterns of LMO-P and LMO-Z1A2 samples. Refined XRD data of (b) LMO-Z1A2 and (c) LMO-P. (d) Raman spectra of LMO-P and LMO-Z1A2 samples. SEM images of (e) LMO-P and (f) LMO-Z1A2 samples.
-
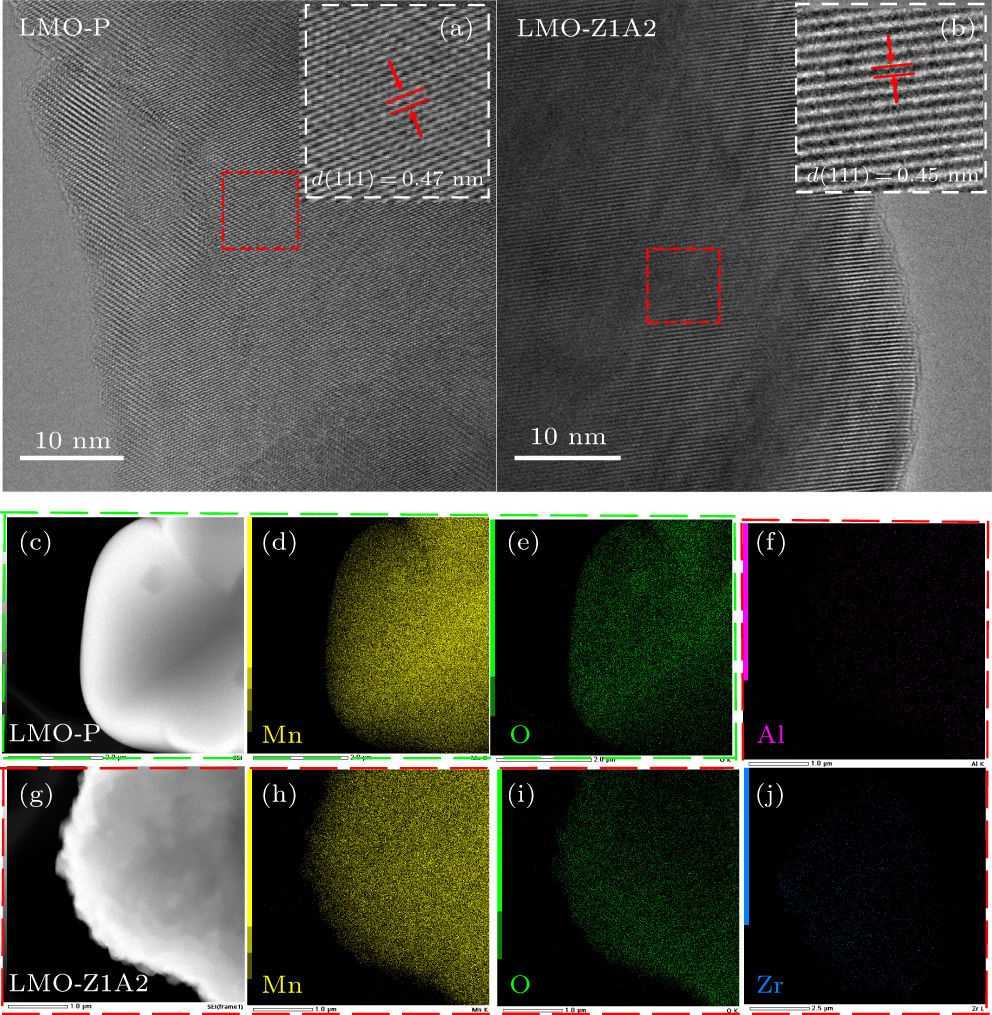
Figure 3. TEM image of (a) LMO-P and (b) LMO-Z1A2 samples, showing the (111) lattice plane. (c)–(e) EDS images of LMO-P samples. (f)–(j) EDS images of LMO-Z1A2 samples.
-
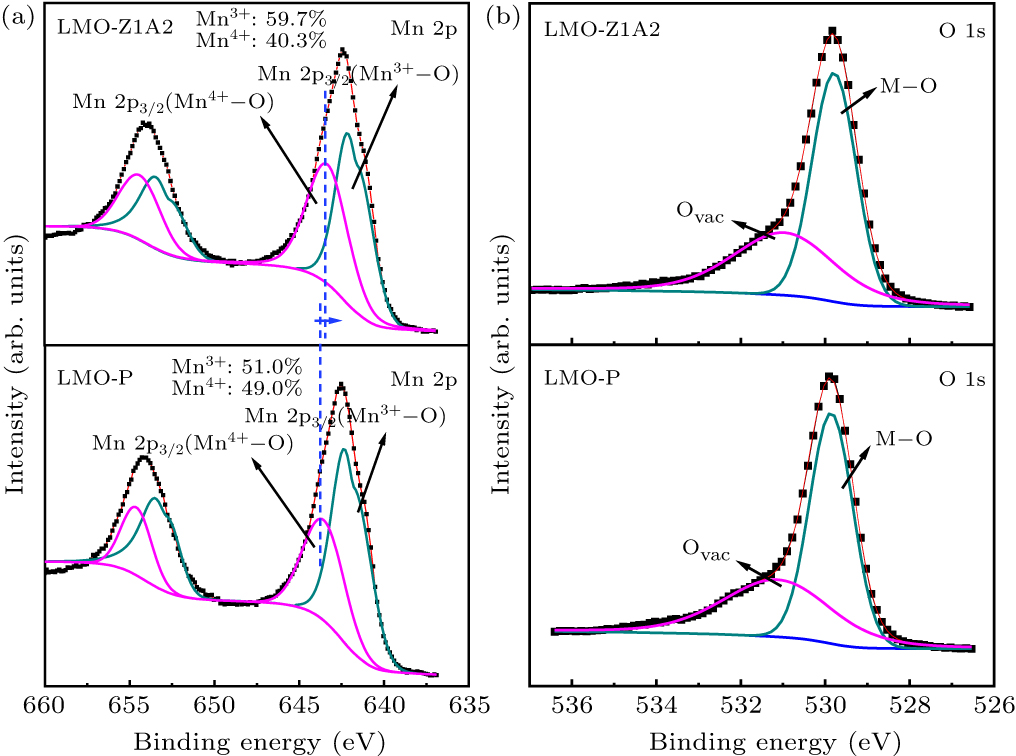
Figure 4. XPS patterns of the LMO-P and LMO-Z1A2. (a) Mn 2p spectra for LMO-P and LMO-Z1A2. (b) O 1s spectra for LMO-P and LMO-Z1A2.
-
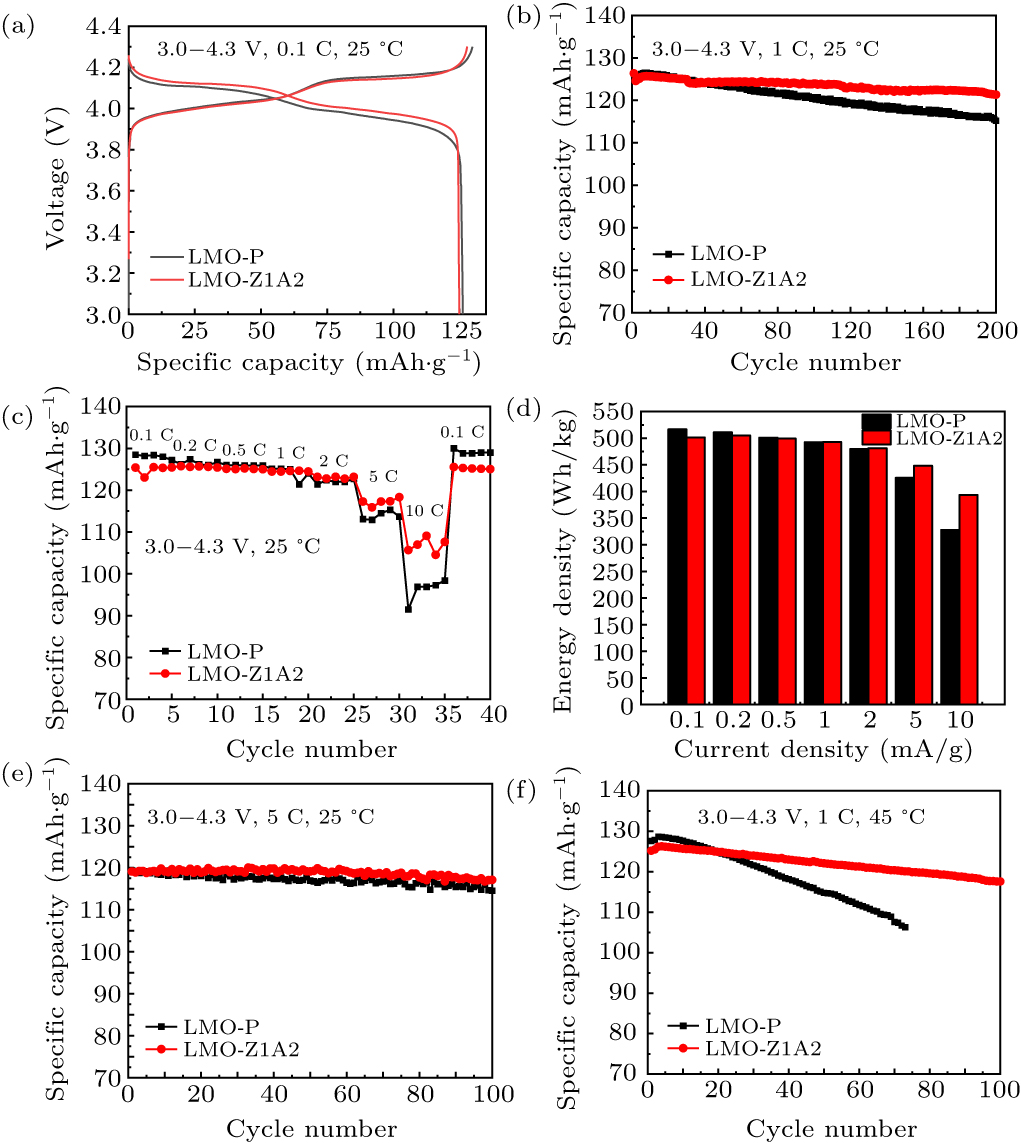
Figure 5. (a) The typical electrochemical charge-discharge curves of LMO-P and LMO-Z1A2 samples for the first cycle. (b) The cyclic stabilities of two LMO samples at rate of 1 C are compared. (c) Rate capabilities of the as-obtained samples. (d) Energy density as a function of current density. (e) High-rate performance comparison. (f) High-temperature electrochemical performance comparison.
-
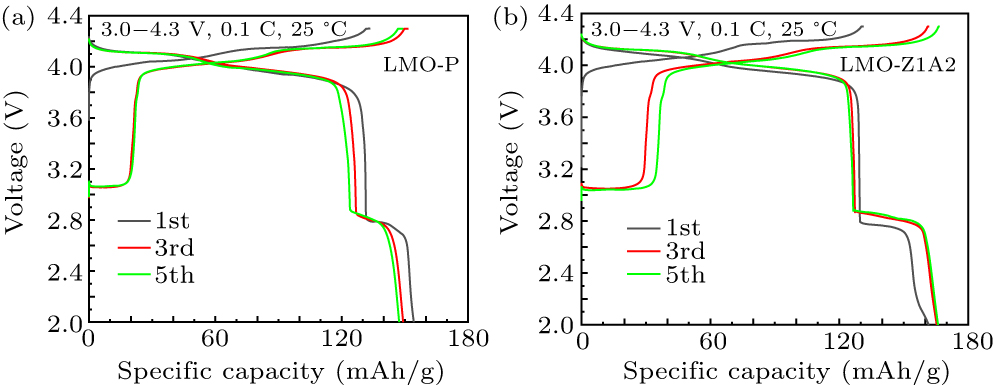
Figure 6. The charge–discharge curves during the 1st, 3rd, and 5th cycles at 0.1 C of (a) LMO-P and (b) LMO-Z1A2.
-
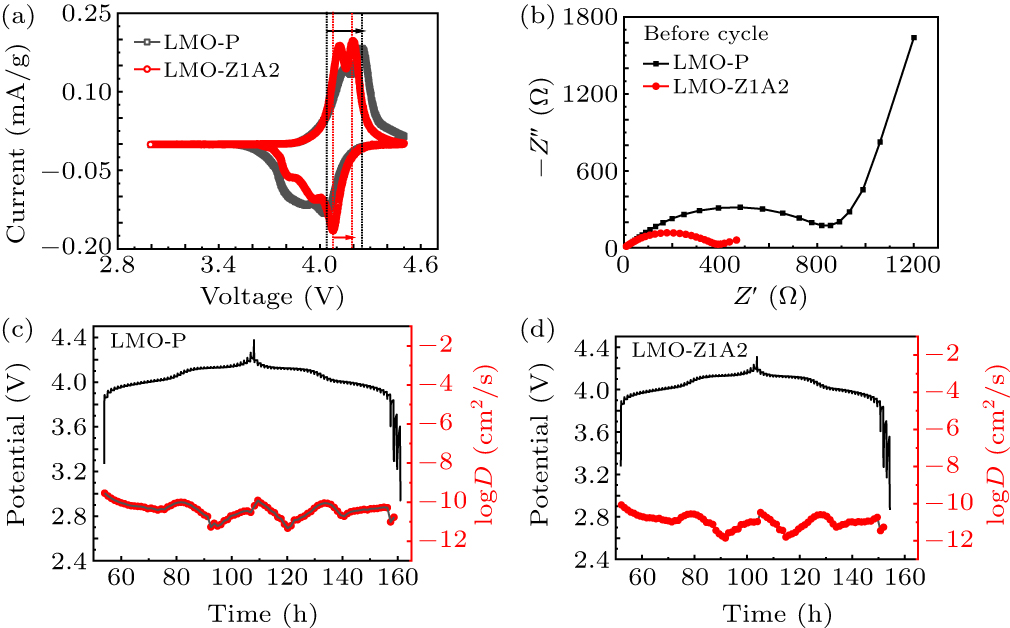
Figure 7. (a) Cyclic voltammograms of LMO-P and LMO-Z1A2 samples from 3.0–4.5 V at a scan rate of 0.1 mV/s. (b) Nyquist plots of LMO-P and LMO-Z1A2 samples in the frequency range of 0.01–106 Hz, with a 5 mV AC voltage perturbation. GITT results for (c) LMO-P cathodes. GITT results for (d) LMO-Z1A2 cathodes.
Figure
7 ,Table
0 个