-
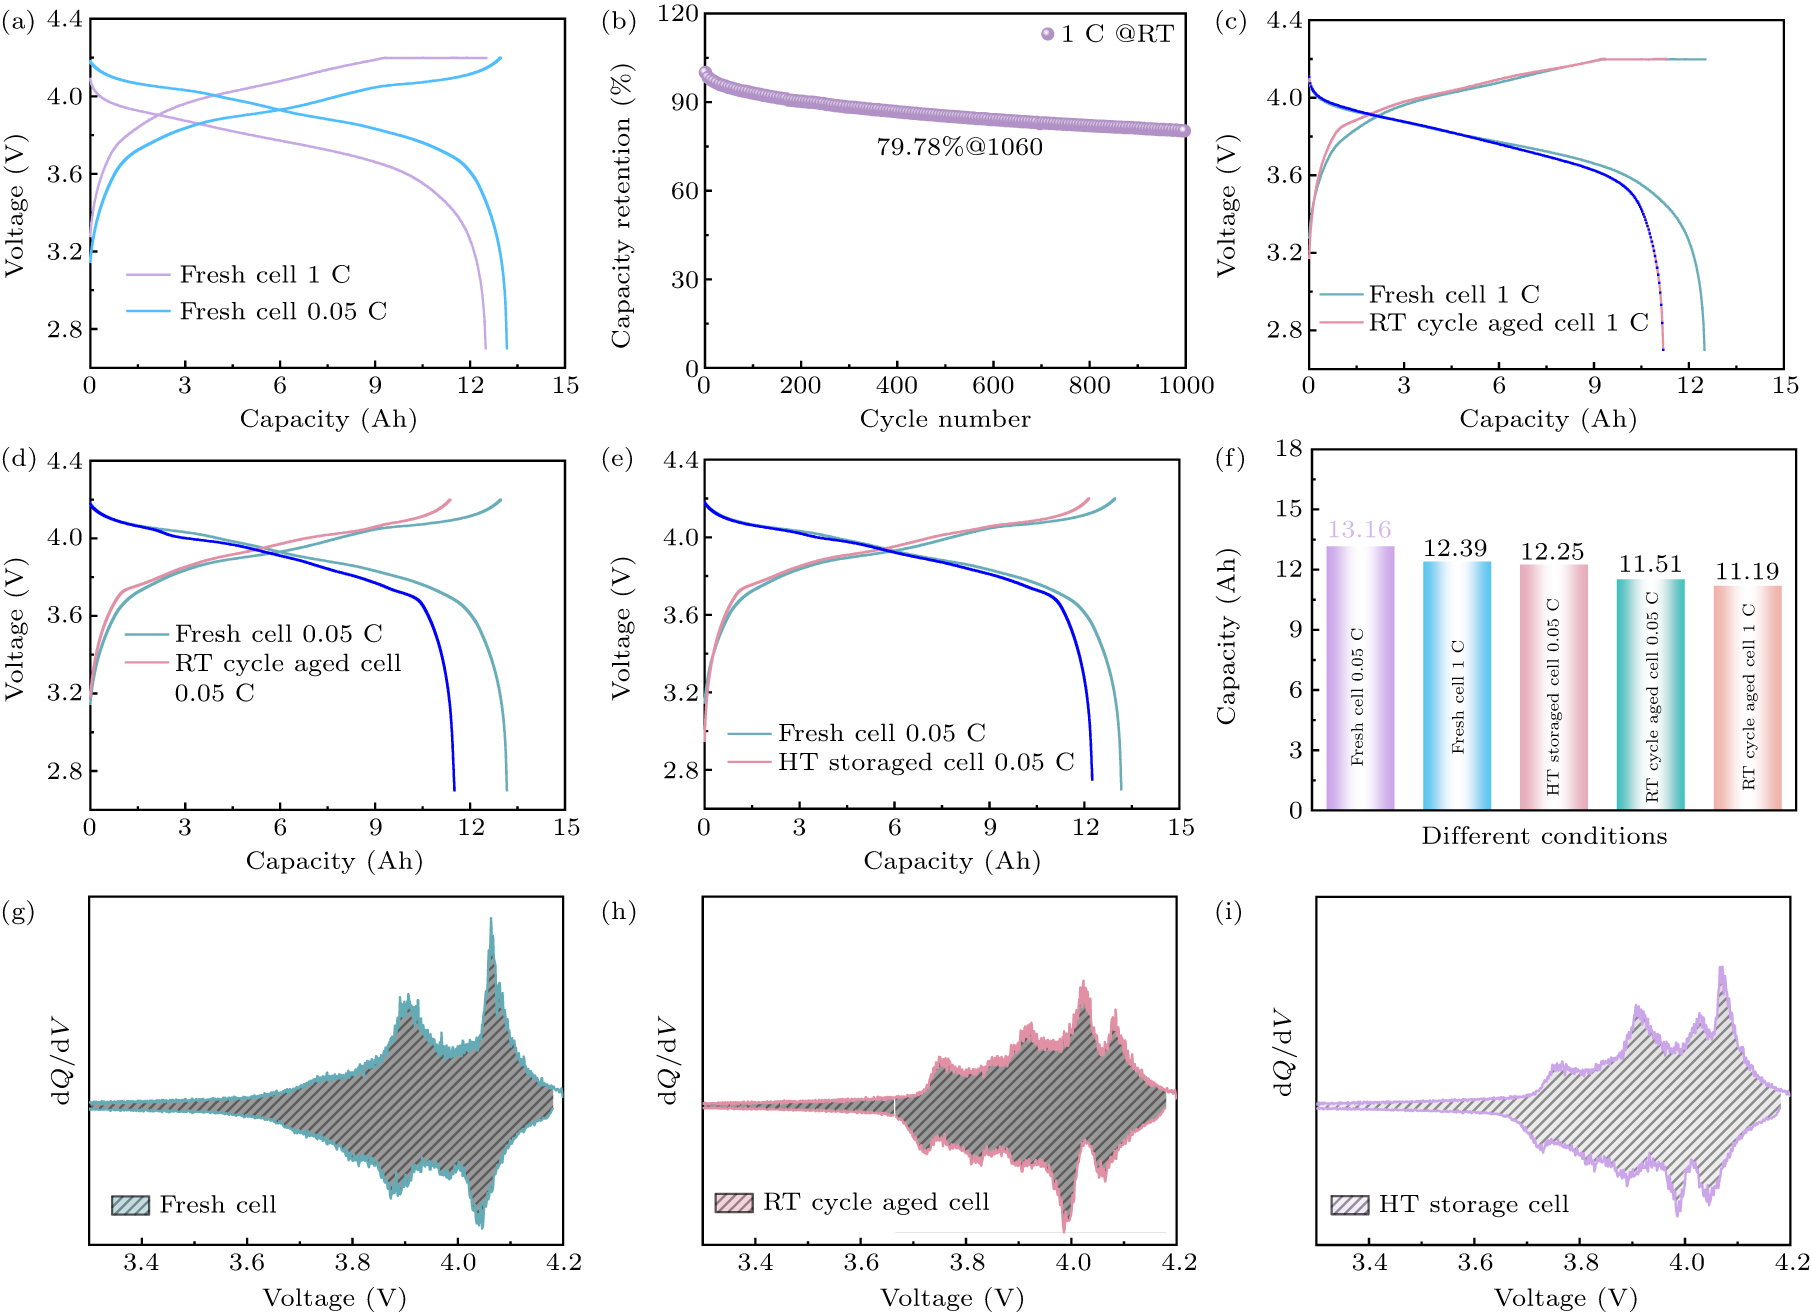
Figure 1. (a) Analysis of electrochemical performance degradation in LMO batteries with typical charge–discharge profiles of fresh cell. (b) Characteristic degradation patterns of the pouch cell at 1 C discharge rate under RT. Comparative charge–discharge profiles at (c) 1 C rate and (d) 0.05 C rate for fresh cell versus RT cycle-aged cell. (e) 0.05 C charge–discharge profiles illustrating the effect of 7 days aging at HT (55 °C). (f) Cell capacity across different conditions. (g)–(i) dQ/dV curves of fresh, RT cycle-aged, and HT storage cells.
-
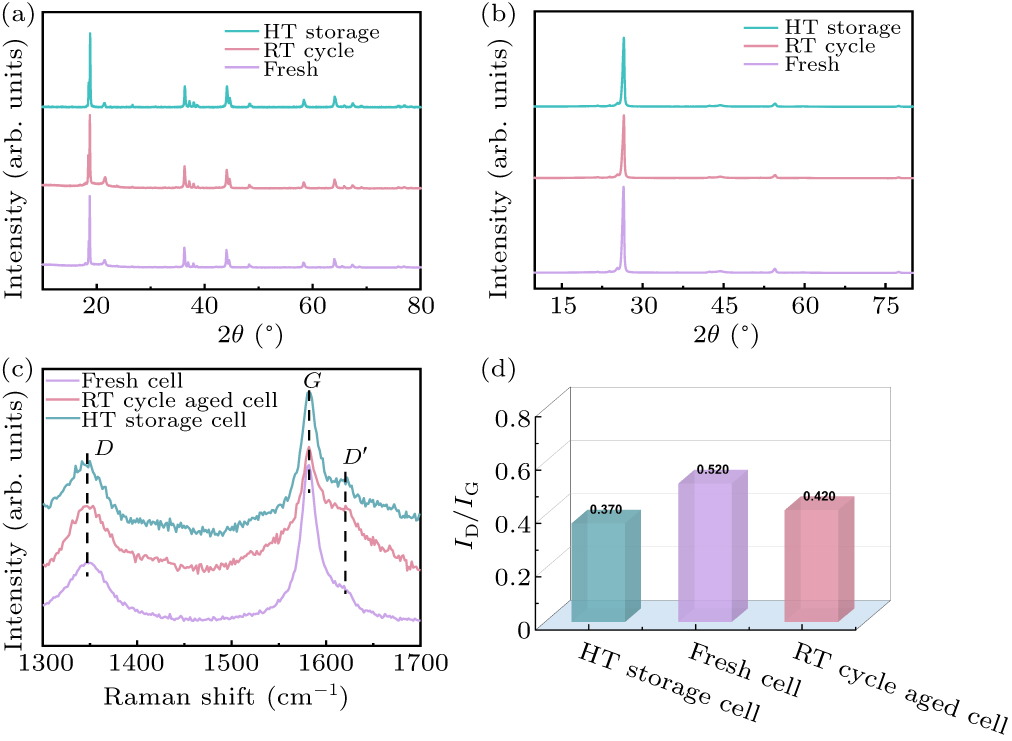
Figure 2. XRD patterns of (a) cathodes and (b) anodes. (c) Raman spectrums of three anodes from fresh, RT cycle-aged, and HT storage cells. (d) ID/IG of three anodes from fresh, RT cycle-aged, and HT storage cells.
-
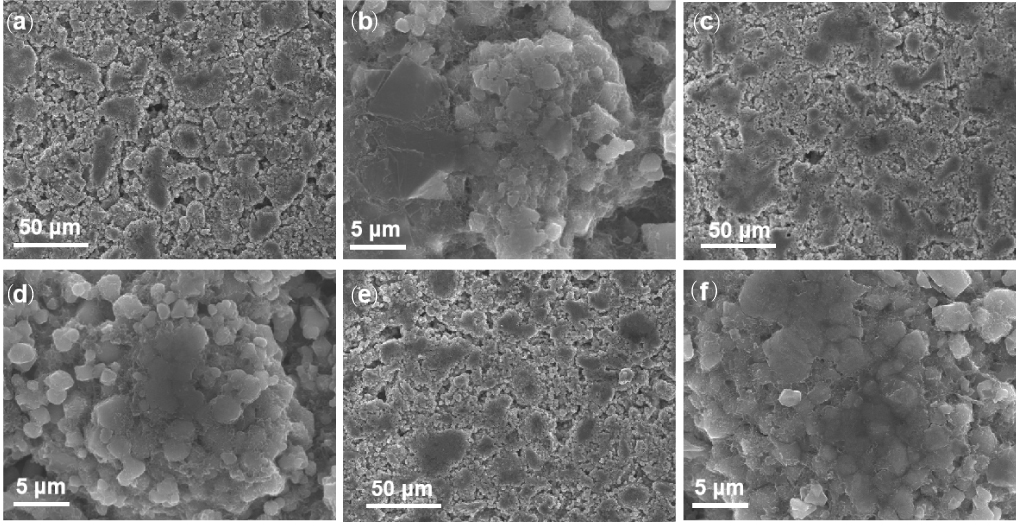
Figure 3. SEM images of cathodes from (a) and (b) fresh cell, (c) and (d) RT cycle-aged cell, and (e) and (f) HT storage cell.
-
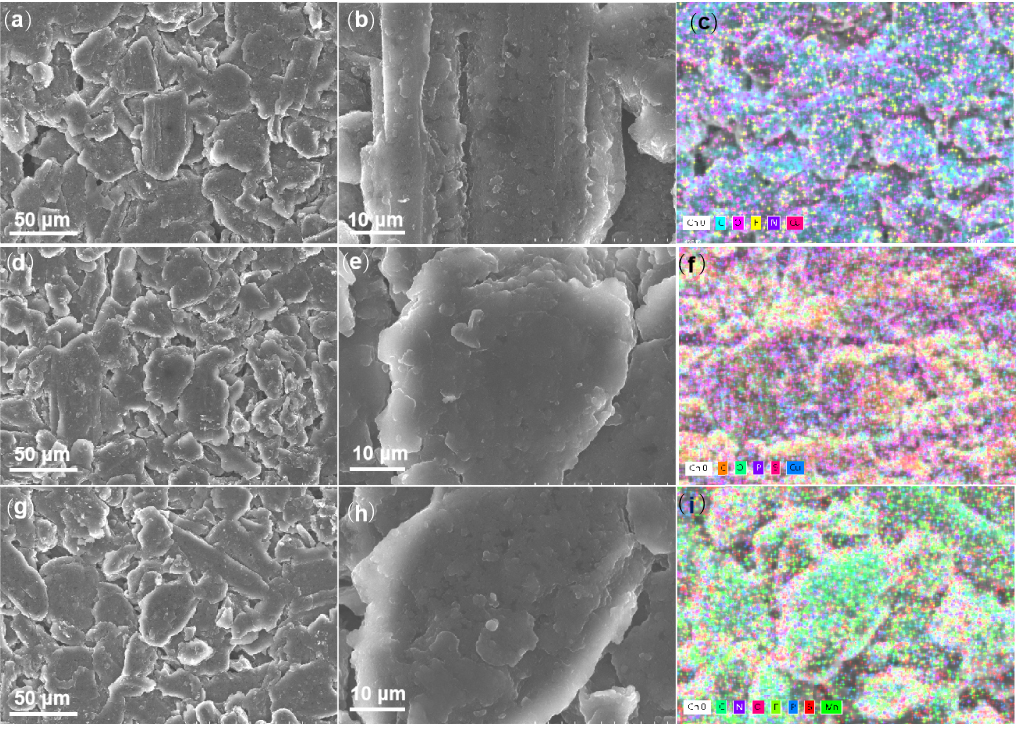
Figure 4. SEM images and EDS mapping of anodes from (a)–(c) fresh cell, (d)–(f) RT cycle-aged cell, and (g)–(i) HT storage cell.
-
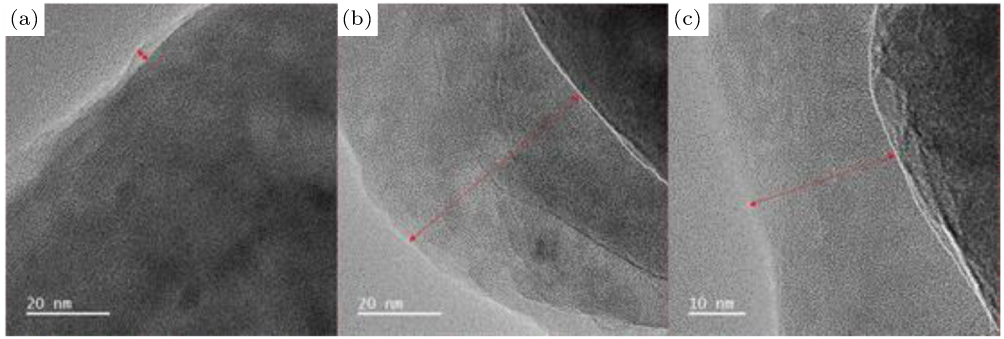
Figure 5. TEM images of anodes from (a) fresh cell, (b) RT cycle-aged cell, and (c) HT storage cell.
-
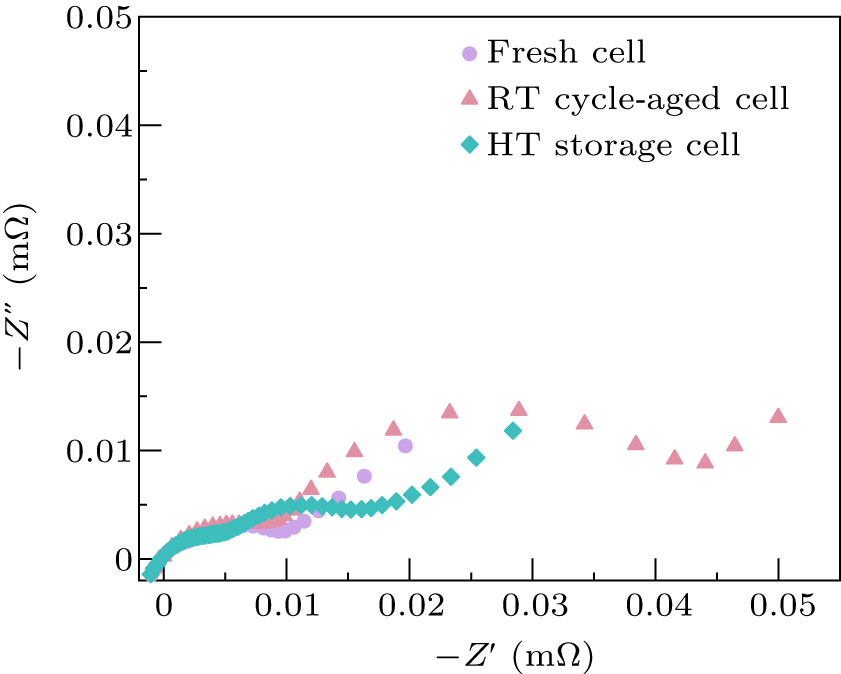
Figure 6. Normalized EIS spectrums of (a) fresh cell, (b) RT cycle-aged cell, and (c) HT storage cell.
-
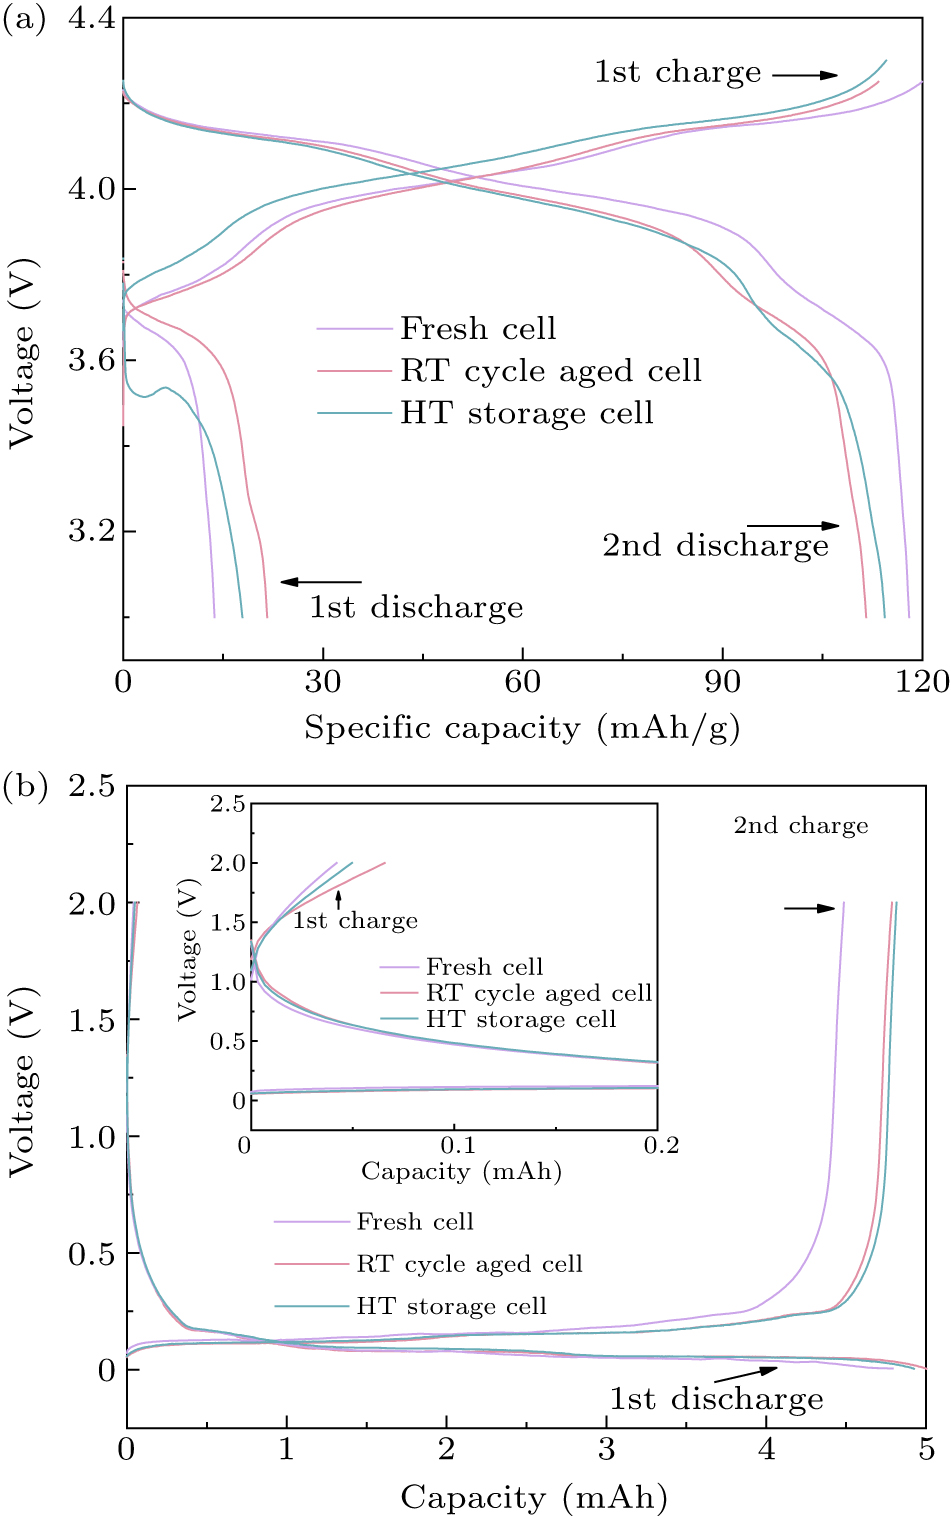
Figure 7. Charge–discharge profiles of coin cells employing (a) cathodes and (b) anodes sourced from disassembled fresh, RT cycle-aged, and HT storage cells. An enlarged view of the initial charge profiles is provided as an inset in (b) for detailed examination.
-
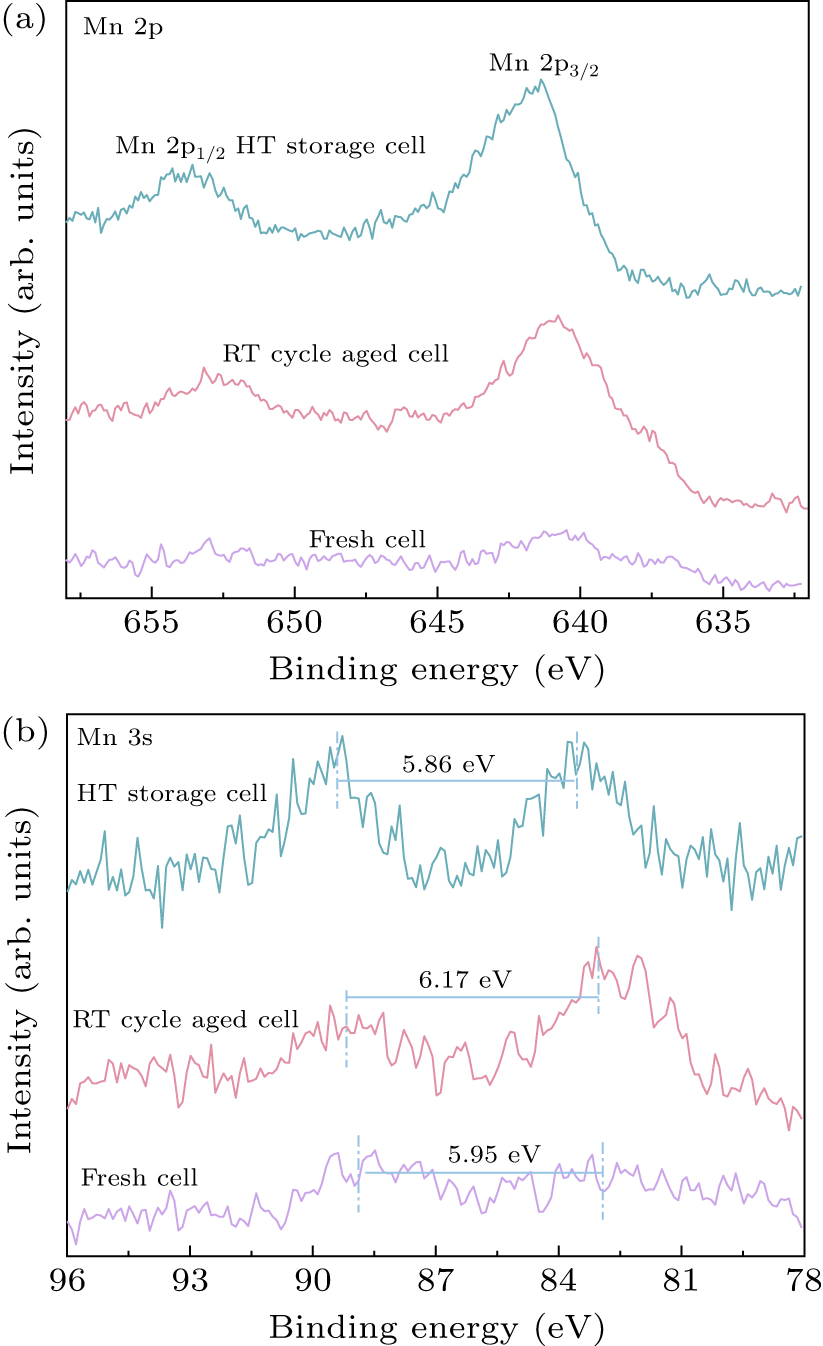
Figure 8. XPS spectra of (a) Mn 2p and (b) Mn 3s for anodes sourced from fresh, RT cycle-aged, and HT storage cells.
Figure
8 ,Table
0 个