-
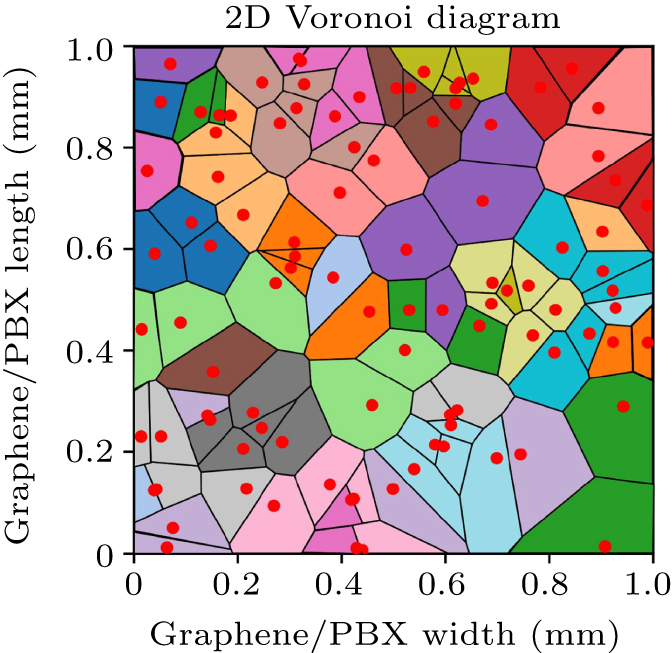
Figure 1. The Voronoi polygons generated from 2D discrete points (the geometric centers of graphene) within a 1 mm×1 mm boundary of the matrix.
-
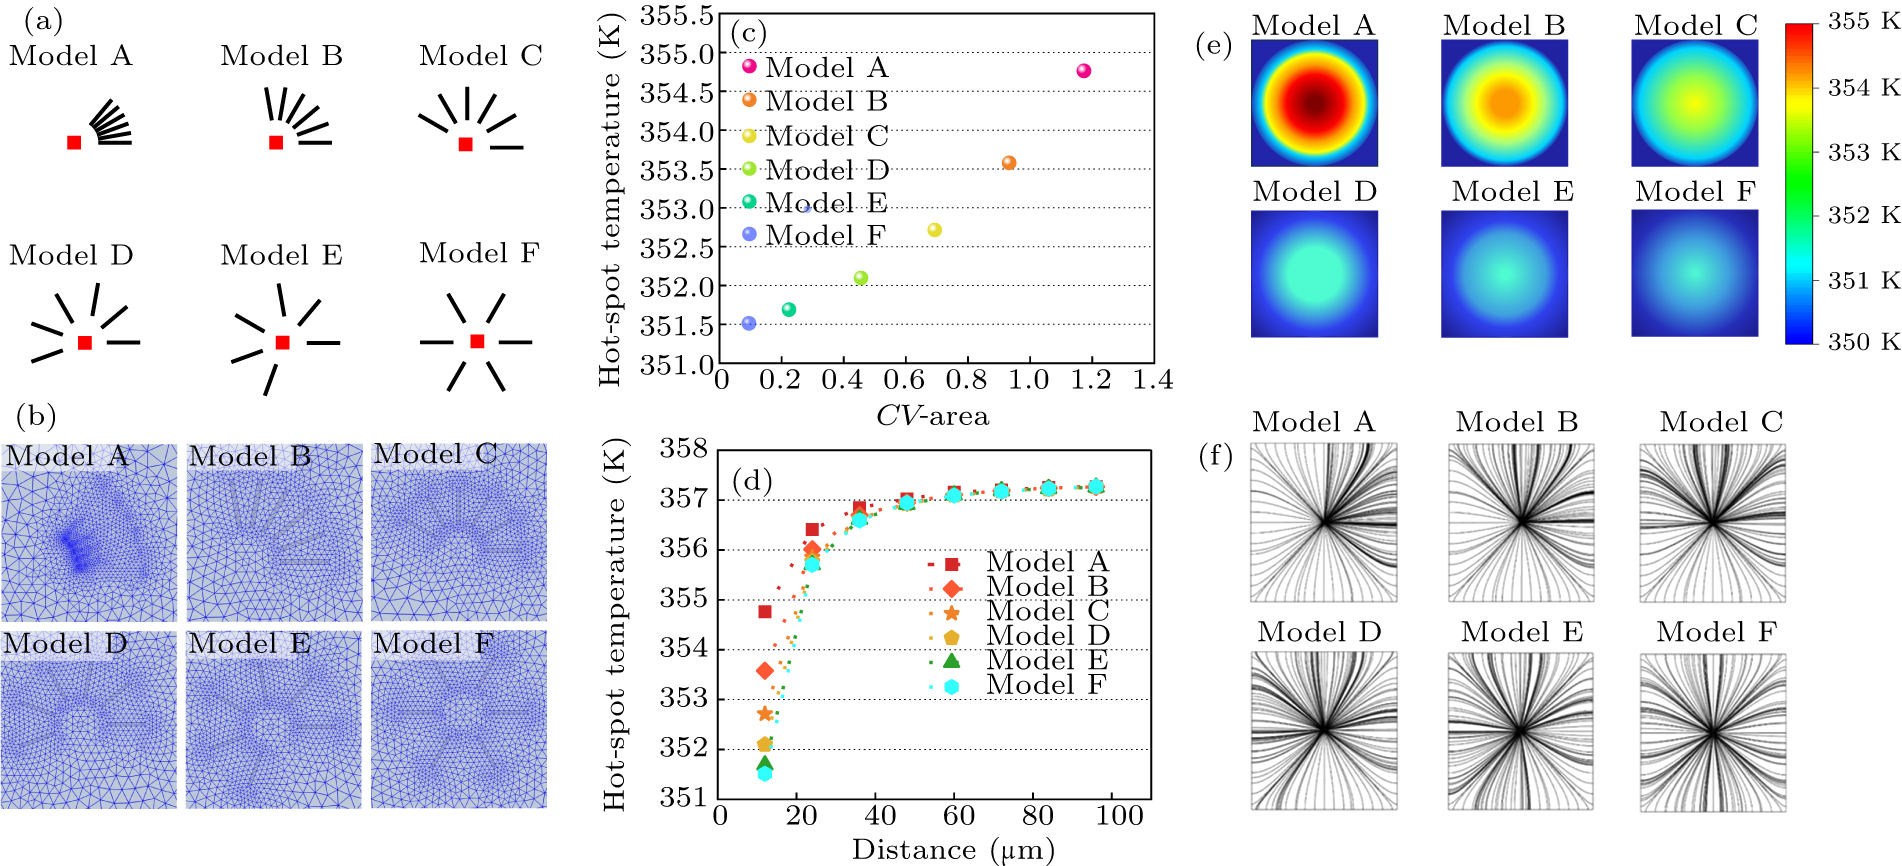
Figure 2. (a) llustration of six models with different spatial configurations of graphene in the composites, the red point represents a hot spot surrounded by graphene fillers. (b) Grid distribution of the models. (c) Relationship between the central hotspot temperature and the degree of graphene spatial aggregation for the six models. (d) The hotspot temperature against the distance between the center of graphene fillers and the hotspot. (e) Temperature distribution in the six models with central hot-spot. (f) Heat flux density of the six models with central hot-spot.
-
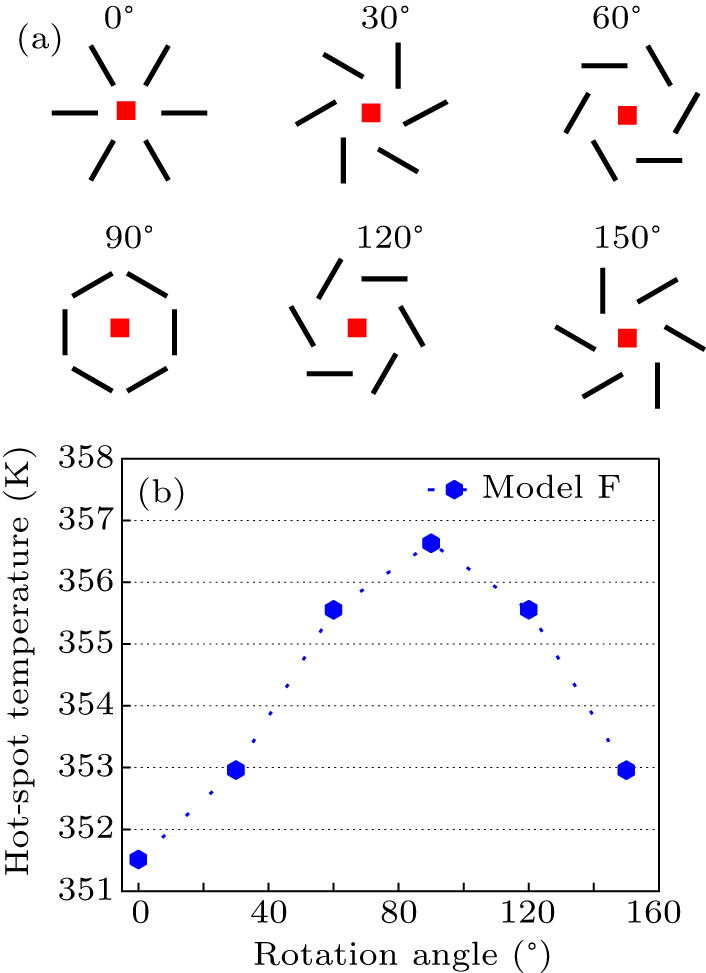
Figure 3. (a) Models in which the graphene filler rotates by specific angles around its geometric center, (b) the central hotspot temperature against the orientation of graphene fillers.
-
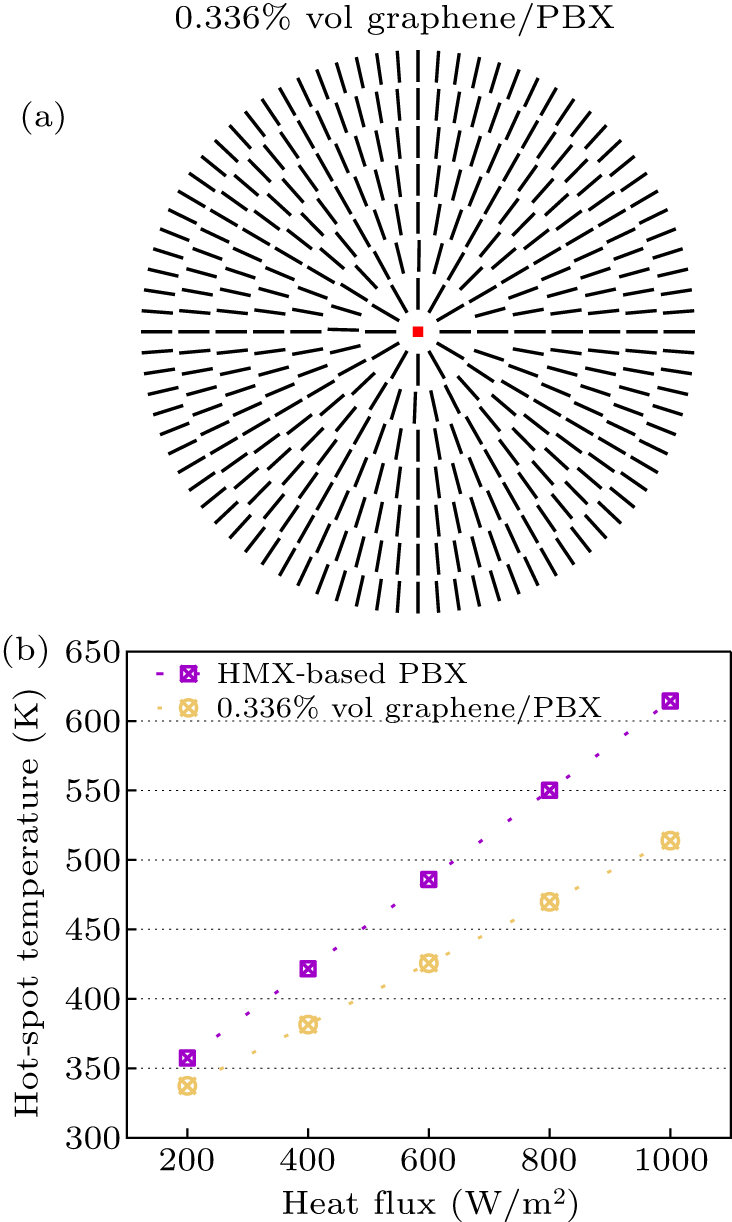
Figure 4. (a) The spatial structure of graphene/PBX with a volume fraction of 0.336%, (b) hotspot temperature of PBX with and without graphene fillers under different heat flux inputs.
-
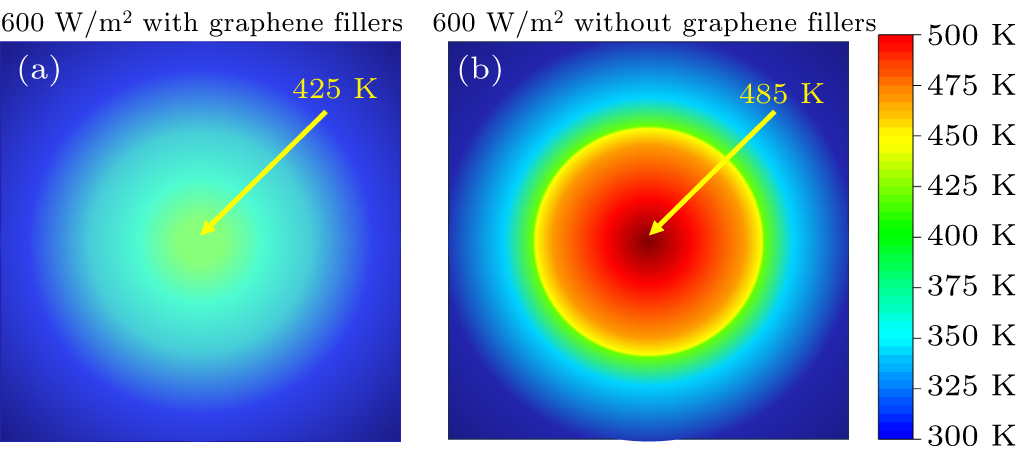
Figure 5. Surface temperature distribution of PBX with (a) and without (b) graphene fillers.
Figure
5 ,Table
1 个