-
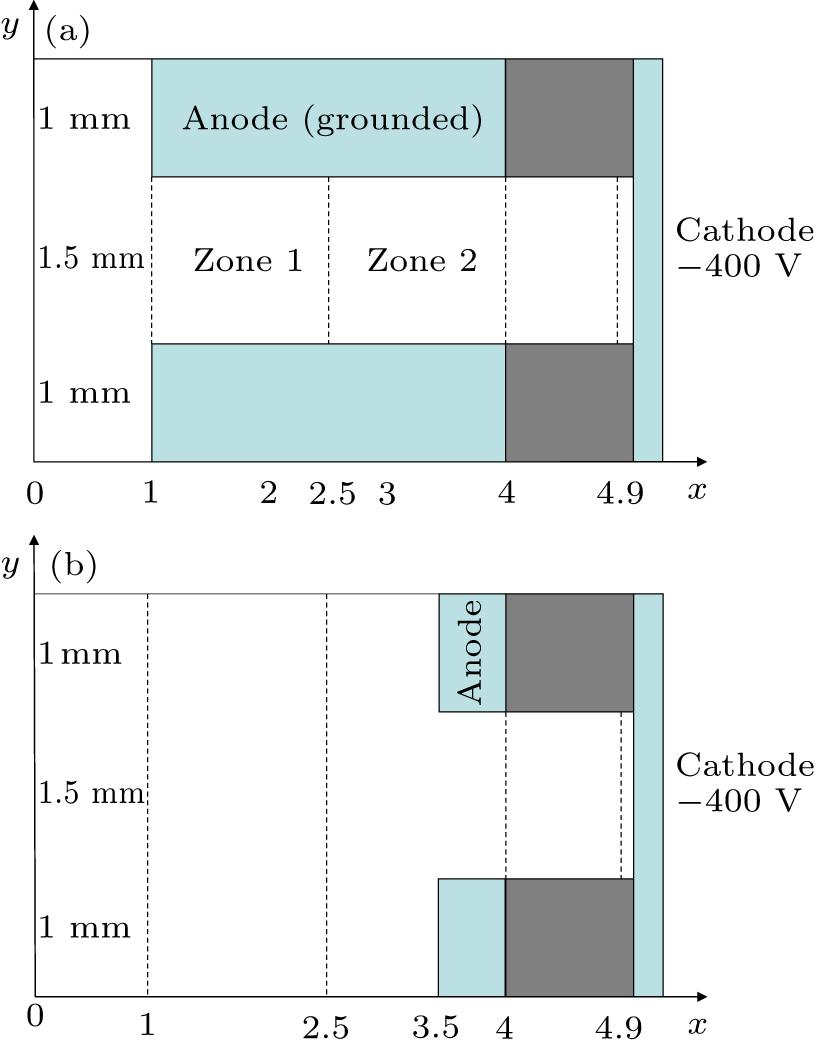
Figure 1. Schematic diagram of the computational models: (a) long anode and (b) short anode. The dashed lines represent four typical locations.
-
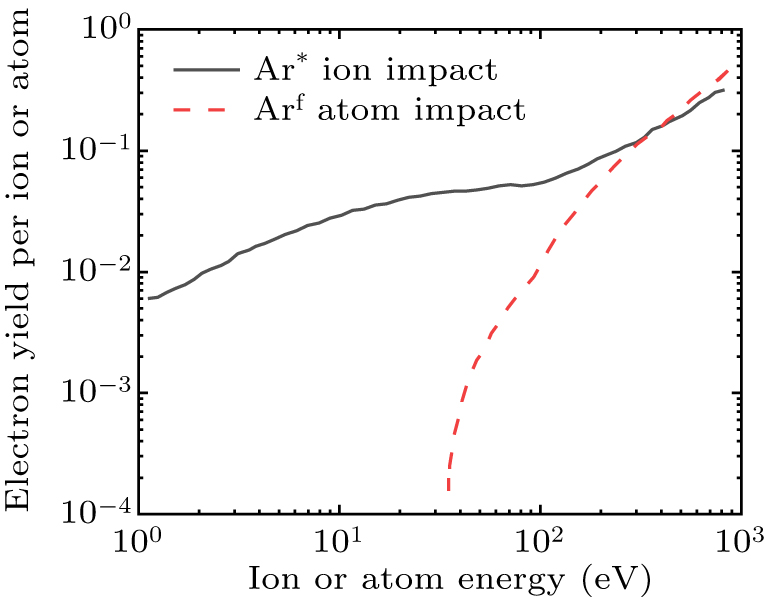
Figure 2. Energy dependence of secondary-electron yield due to Ar* and Arf impact onto copper surface.
-
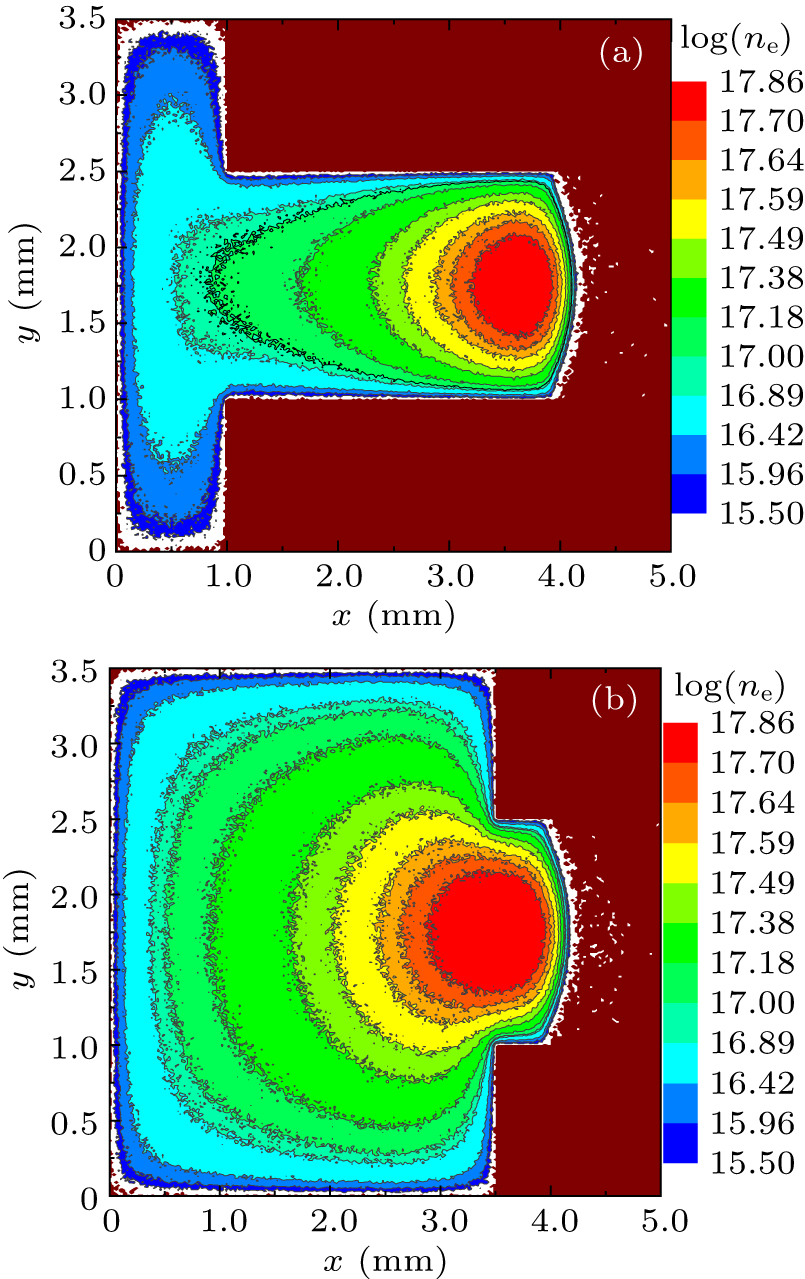
Figure 3. The 2D electron density distributions for (a) long anode and (b) short anode.
-
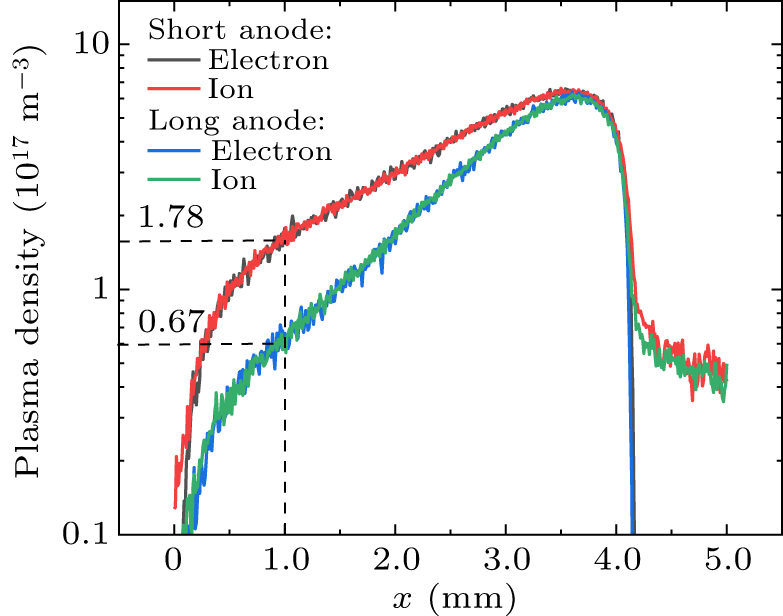
Figure 4. Comparisons of plasma density variation along the x-direction. The plasma density changes logarithmically.
-
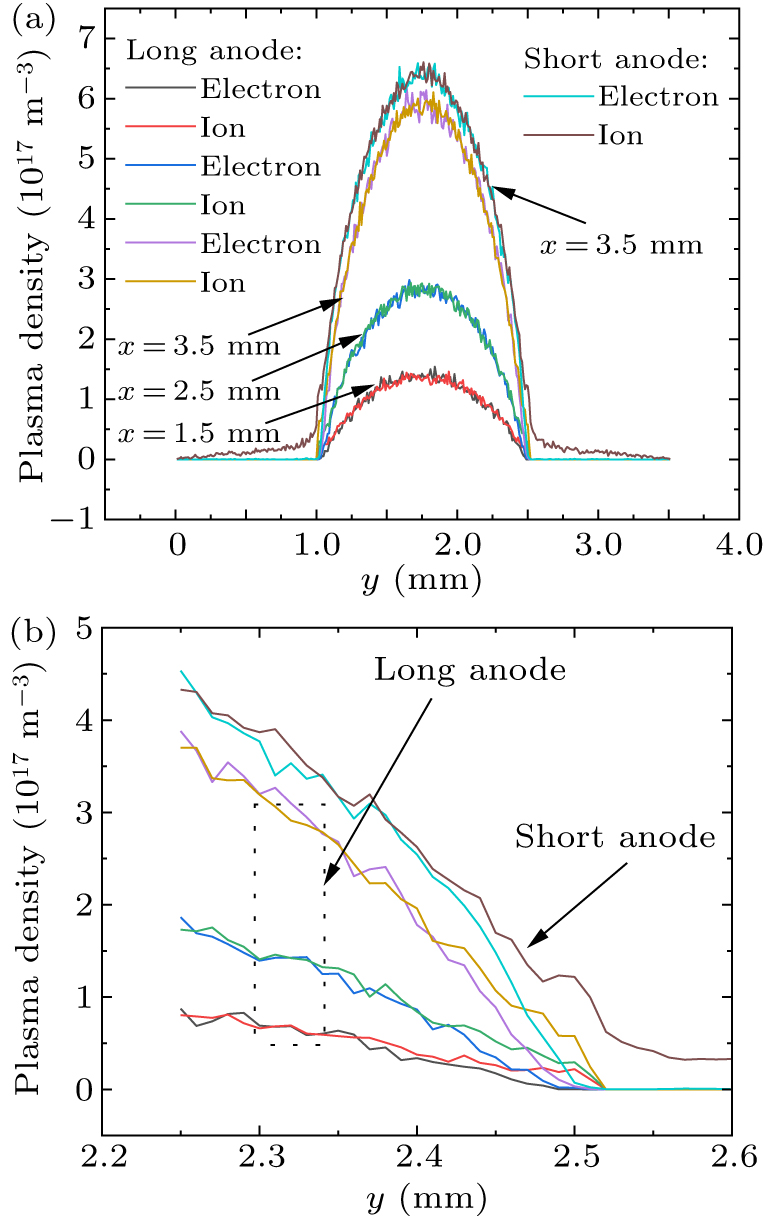
Figure 5. Comparisons of y-direction variation of plasma density inside the channels of (a) the whole channel and (b) near the wall.
-
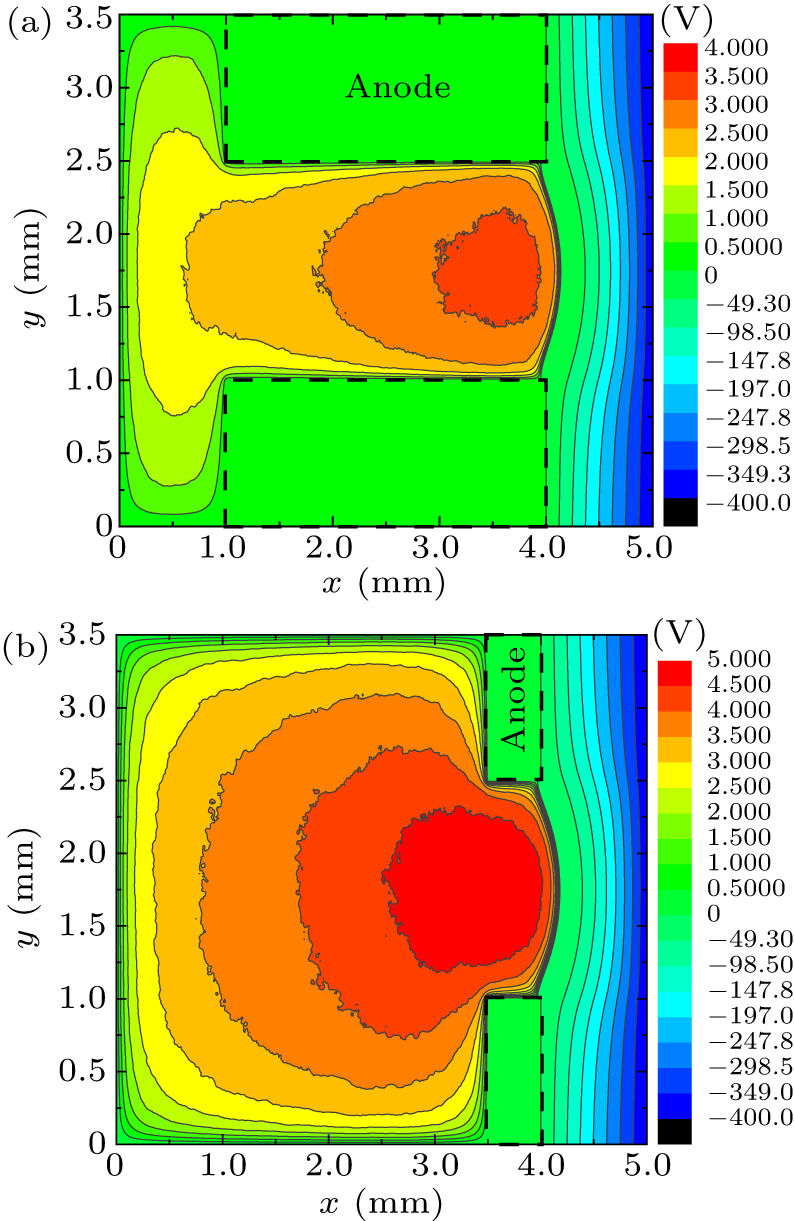
Figure 6. The 2D potential distributions of (a) long anode and (b) short anode.
-
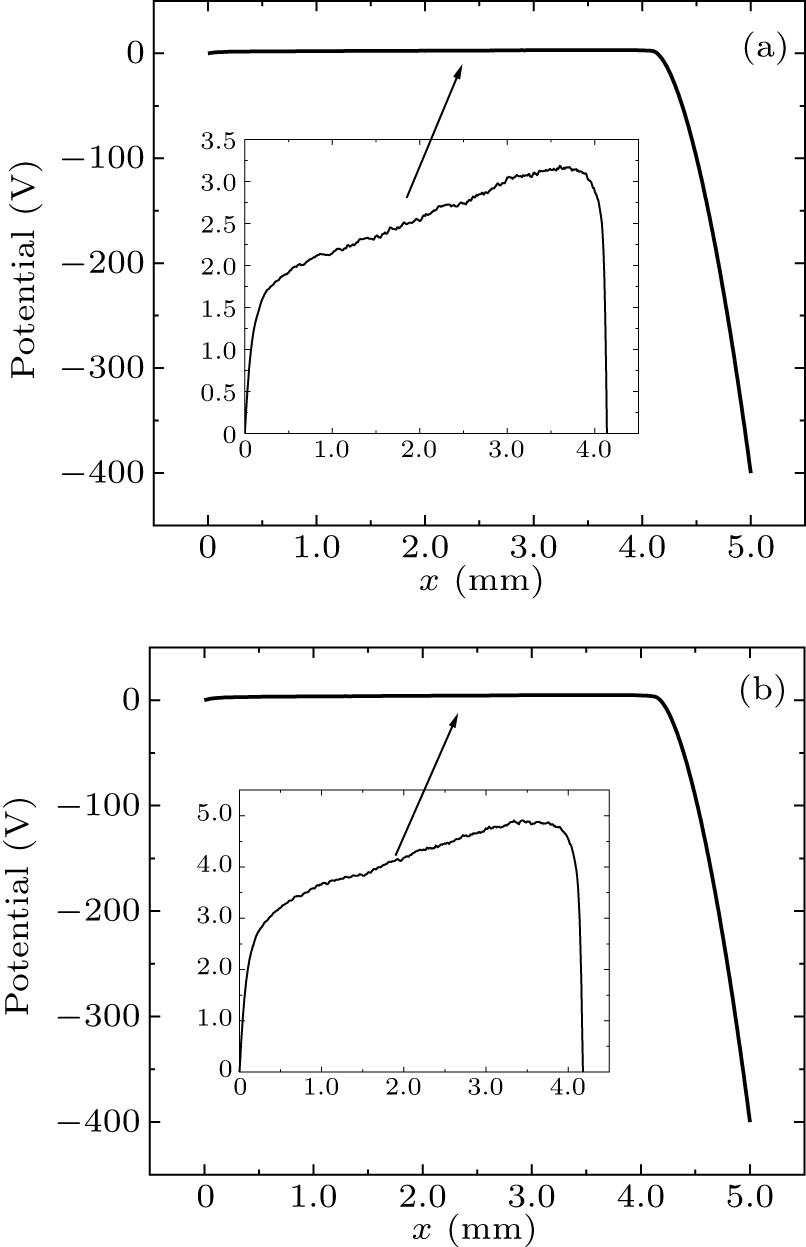
Figure 7. Schematic diagram of the potential variations versus the x-direction position: (a) the long anode and (b) the short anode. The inset shows the potential variation from the anode inlet to the left boundary.
-
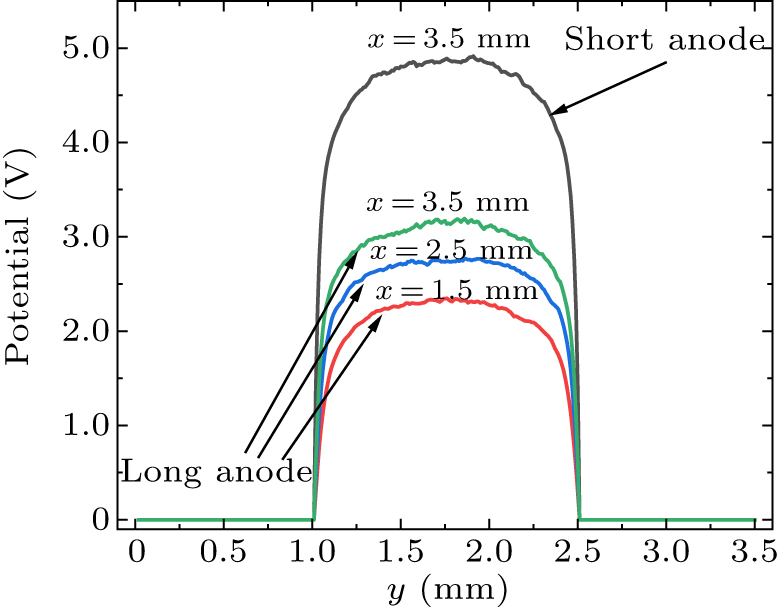
Figure 8. Comparisons of y-direction potential variations inside the long and short channels.
-
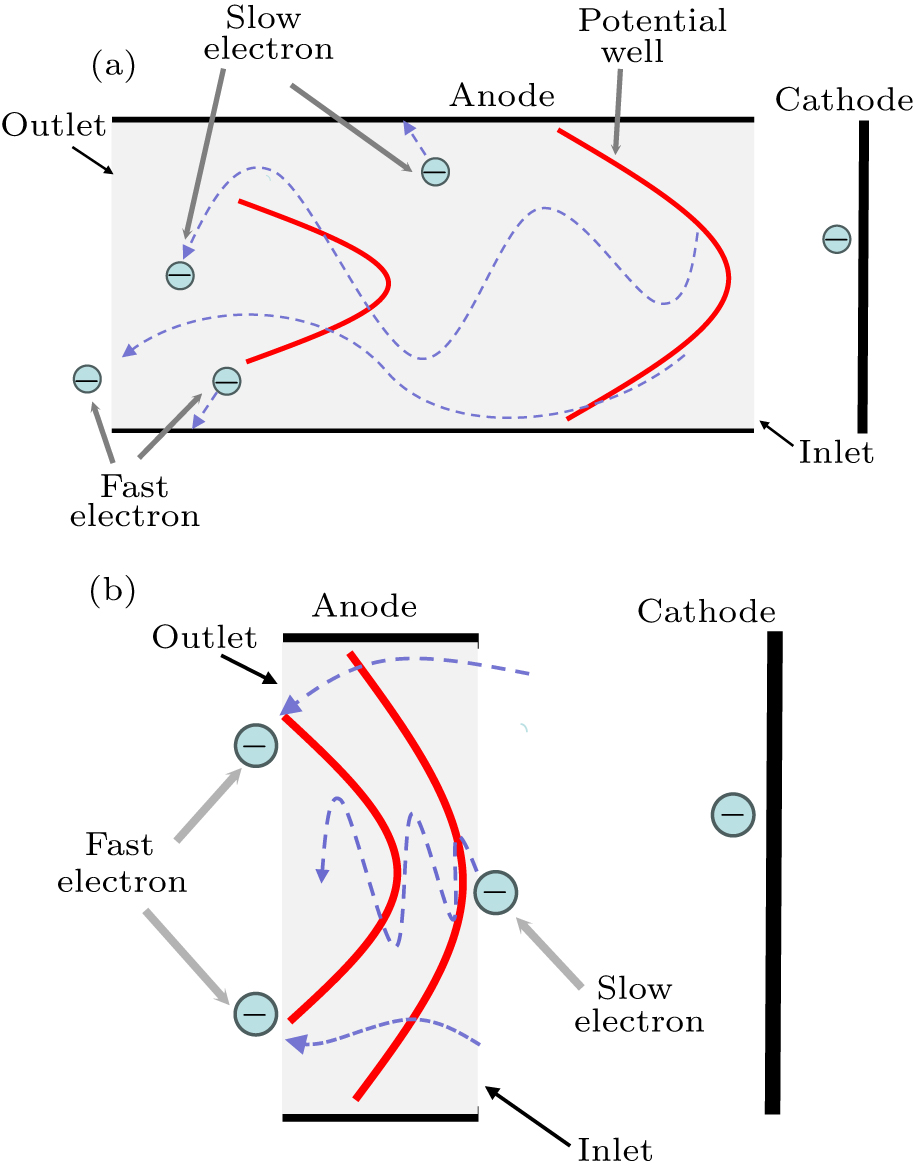
Figure 9. Trajectories of electrons inside the anode channel of (a) long anode and (b) short anode.
-
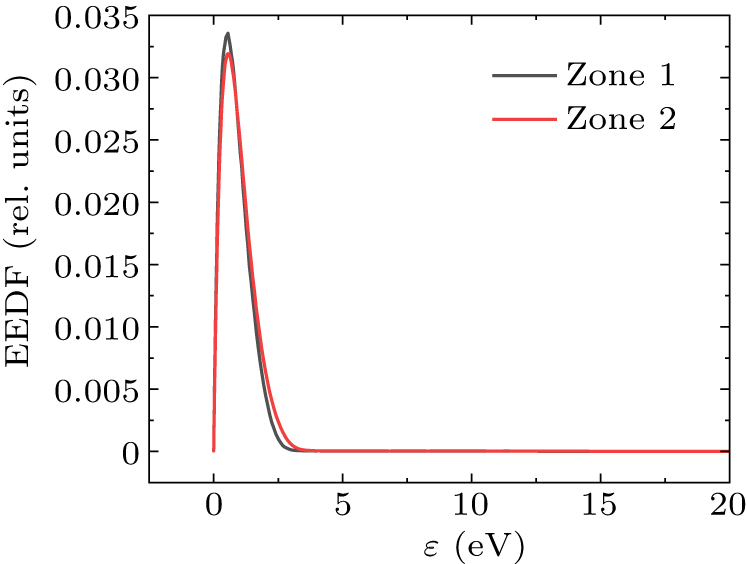
Figure 10. Electron energy distribution functions of zone 1 and zone 2.
-
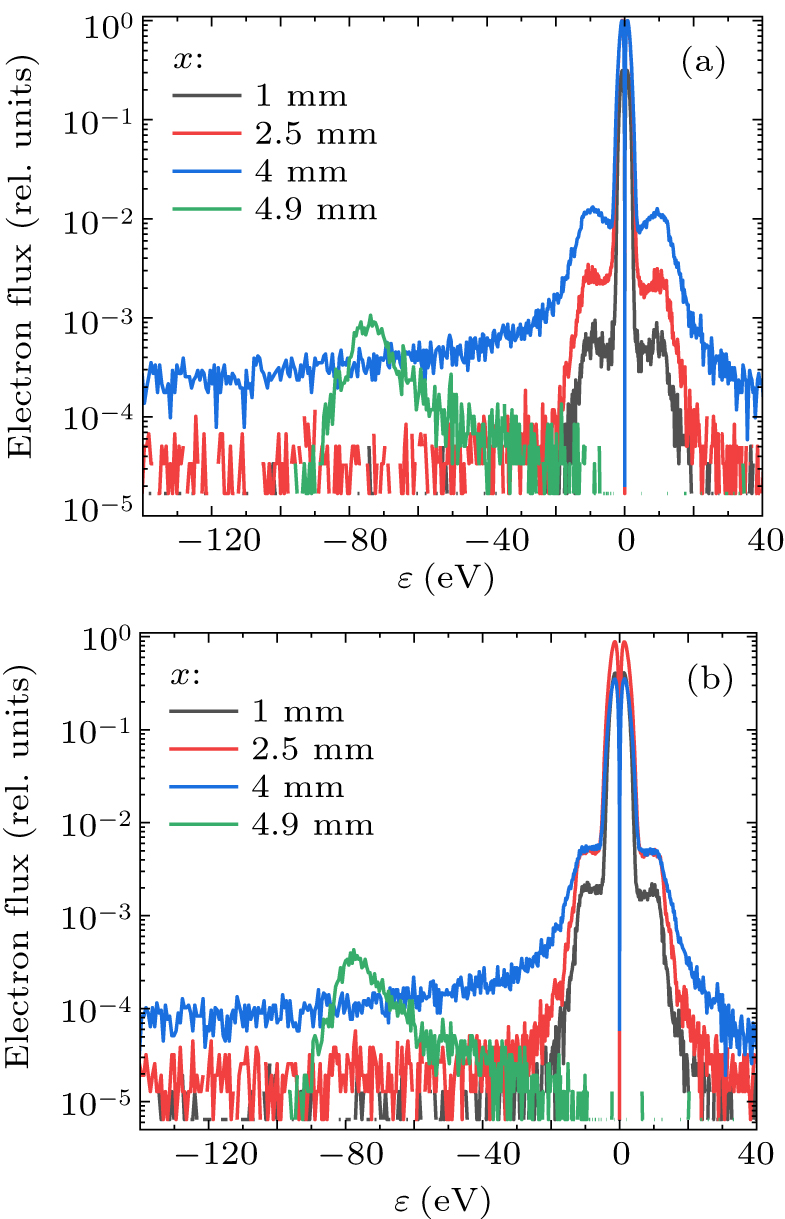
Figure 11. Dependence of electron flux on total kinetic energy: (a) the long anode and (b) the short anode. Negative energy means the electron moves in the negative direction along the x-axis.
-
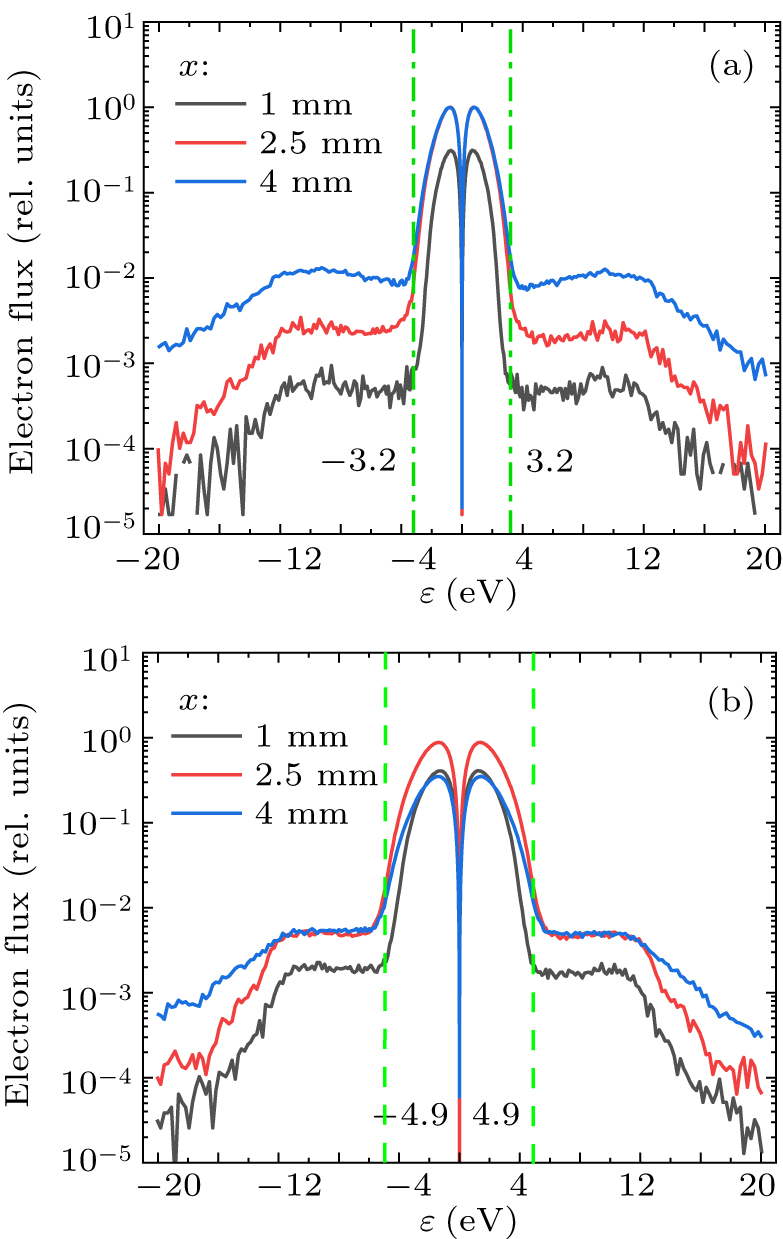
Figure 12. Electron flux distributions below 20 eV: (a) the long anode and (b) the short anode.
Figure
12 ,Table
0 个