
 首页
首页 登录
登录 注册
注册


 下载:
下载:
-
以氘负离子源为核心的中性束注入系统是未来聚变装置的重要组成部件[1–3]. 利用金属铯来提高
$ {{\mathrm{D}}}^{-} $ 密度的负离子源存在易损耗和引入杂质等问题[4]. 无需添加铯的氘负离子源, 如螺旋波氘负离子源[5]和电子回旋共振(electron cyclotron resonance, ECR)氘负离子源[6], 是重要的替代方案. ECR等离子体利用右旋圆偏振微波加热磁场中回旋运动的电子, 具有无电极、低工作气压、高解离率以及易形成负离子的特点, 被广泛用于离子源[7–9]、材料加工处理[10,11]离子推进等领域[12,13]. 目前, 已报道过德国的HOMER[14]、法国的ROSAE-III[1]和Camembert-III[15]等多个ECR负离子源装置[6,16].在氘负离子源的研究中,
$ {{\mathrm{D}}}^{-} $ 密度是一个关键参数, 可靠地诊断这一参数是氘负离子源开发和运行的重要条件.$ {{\mathrm{D}}}^{-} $ 密度一般较低, 且不存在自发辐射过程[17], 目前主要使用激光脱附探针[18]和腔振铃光谱[19]方法来诊断$ {{\mathrm{D}}}^{-} $ 密度. 这些技术基于$ {{\mathrm{D}}}^{-} $ 的光脱附过程来诊断$ {{\mathrm{D}}}^{-} $ 密度, 需要复杂的设备和精细的数据处理[20]. 2006年, Fantz和Wünderlich[21]提出了Yacora氢原子碰撞辐射模型, 利用氢原子$ {{\mathrm{H}}}_{{\mathrm{\alpha }}} $ 与$ {{\mathrm{H}}}_{{\mathrm{\beta }}} $ 谱线强度比值$ {I}_{{{\mathrm{H}}}_{{\mathrm{\alpha }}}}/{I}_{{{\mathrm{H}}}_{{\mathrm{\beta }}}} $ 给出低气压等离子体(<1 Pa)中的$ {{\mathrm{H}}}^{-} $ 密度($ {{\mathrm{D}}}^{-} $ 密度). 其基本思想是$ {{\mathrm{H}}}^{-} $ 与$ {{\mathrm{H}}}^{+} $ 相互中性化过程产生激发态氢原子:其中,
$ {{\mathrm{H}}}^{{\mathrm{*}}}\left(p\right) $ 是激发态氢原子,$ p $ 是能级主量子数;$ {{\mathrm{H}}}^{-} $ 的中性化过程会选择性地增强氢原子谱线, 导致$ {I}_{{{\mathrm{H}}}_{{\mathrm{\alpha }}}}/{I}_{{{\mathrm{H}}}_{{\mathrm{\beta }}}} $ 显著增大. 再结合氢原子谱线绝对强度测量, 即可给出$ {{\mathrm{H}}}^{-} $ 的绝对密度等参数[21]. 这种方法相对简单且对等离子体无扰动, 已经被应用于射频负离子源和螺旋波负离子源的$ {{\mathrm{H}}}^{-} $ 密度($ {{\mathrm{D}}}^{-} $ 密度)的诊断, 其结果与利用激光脱附探针和腔振铃光谱测量得到的结果很好地相符[5,21–24].微波放电ECR源通常由小尺寸的源区和较大的扩散区构成. 等离子体在源区产生, 沿发散位型的磁场向扩散区输运, 两个区域间存在分布式空间电场; 相对于源区, 扩散区空间大, 壁对等离子体影响较小; 这些对ECR等离子体空间特性产生重要影响. 尽管人们在ECR负离子源上进行了大量的研究工作, 但还未见利用发射光谱方法研究
$ {{\mathrm{D}}}^{-} $ 密度及其空间结构特征的报道.本文将Yacora碰撞辐射模型应用于ECR氘等离子体中负离子发射光谱诊断; 利用
$ {I}_{{{\mathrm{D}}}_{{\mathrm{\alpha }}}}/{I}_{{{\mathrm{D}}}_{{\mathrm{\beta }}}} $ 比值, 并结合其他氘原子分子谱线的相对强度来估算$ {{\mathrm{D}}}^{-} $ 密度; 这样就不再需要对谱仪进行复杂的绝对强度标定. 对源区、扩散区不同位置等离子体的多道发射光谱进行诊断, 研究了$ {{\mathrm{D}}}^{-} $ 密度及其空间结构特征, 对其中的物理机制进行了讨论. -
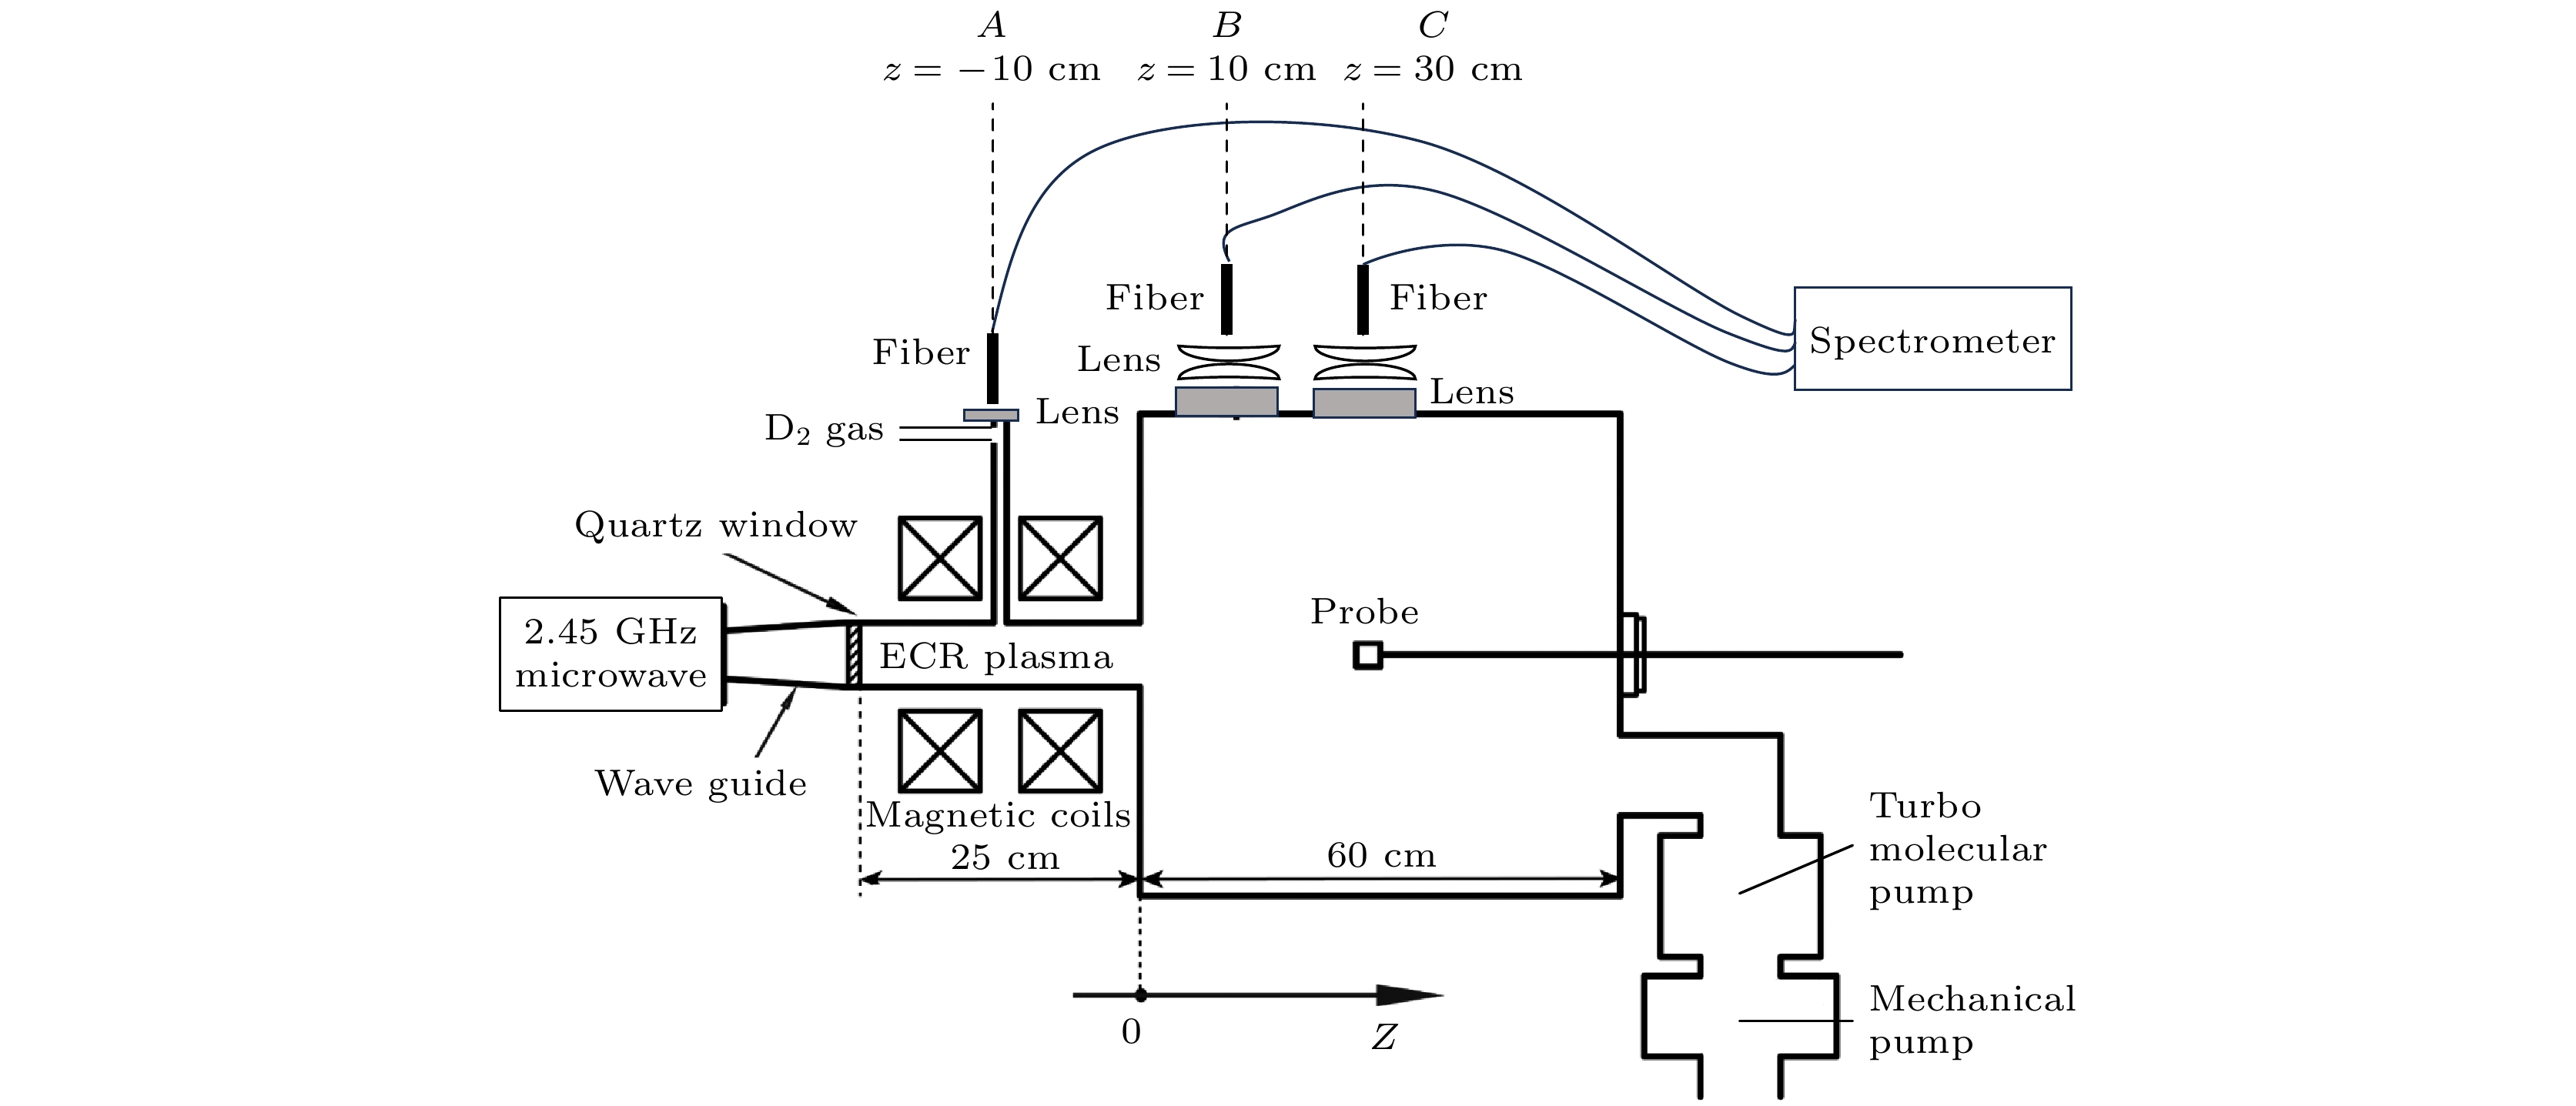
实验中使用的ECR等离子体源见图1 [25]. ECR源由2.45 GHz微波源、波导管、磁场线圈、不锈钢真空腔体和真空维持系统组成. 微波源功率最高为2000 W. 实验气体为氘气, 通过质量流量计控制其流量. 真空由机械泵和分子泵维持, 本底气压可抽至
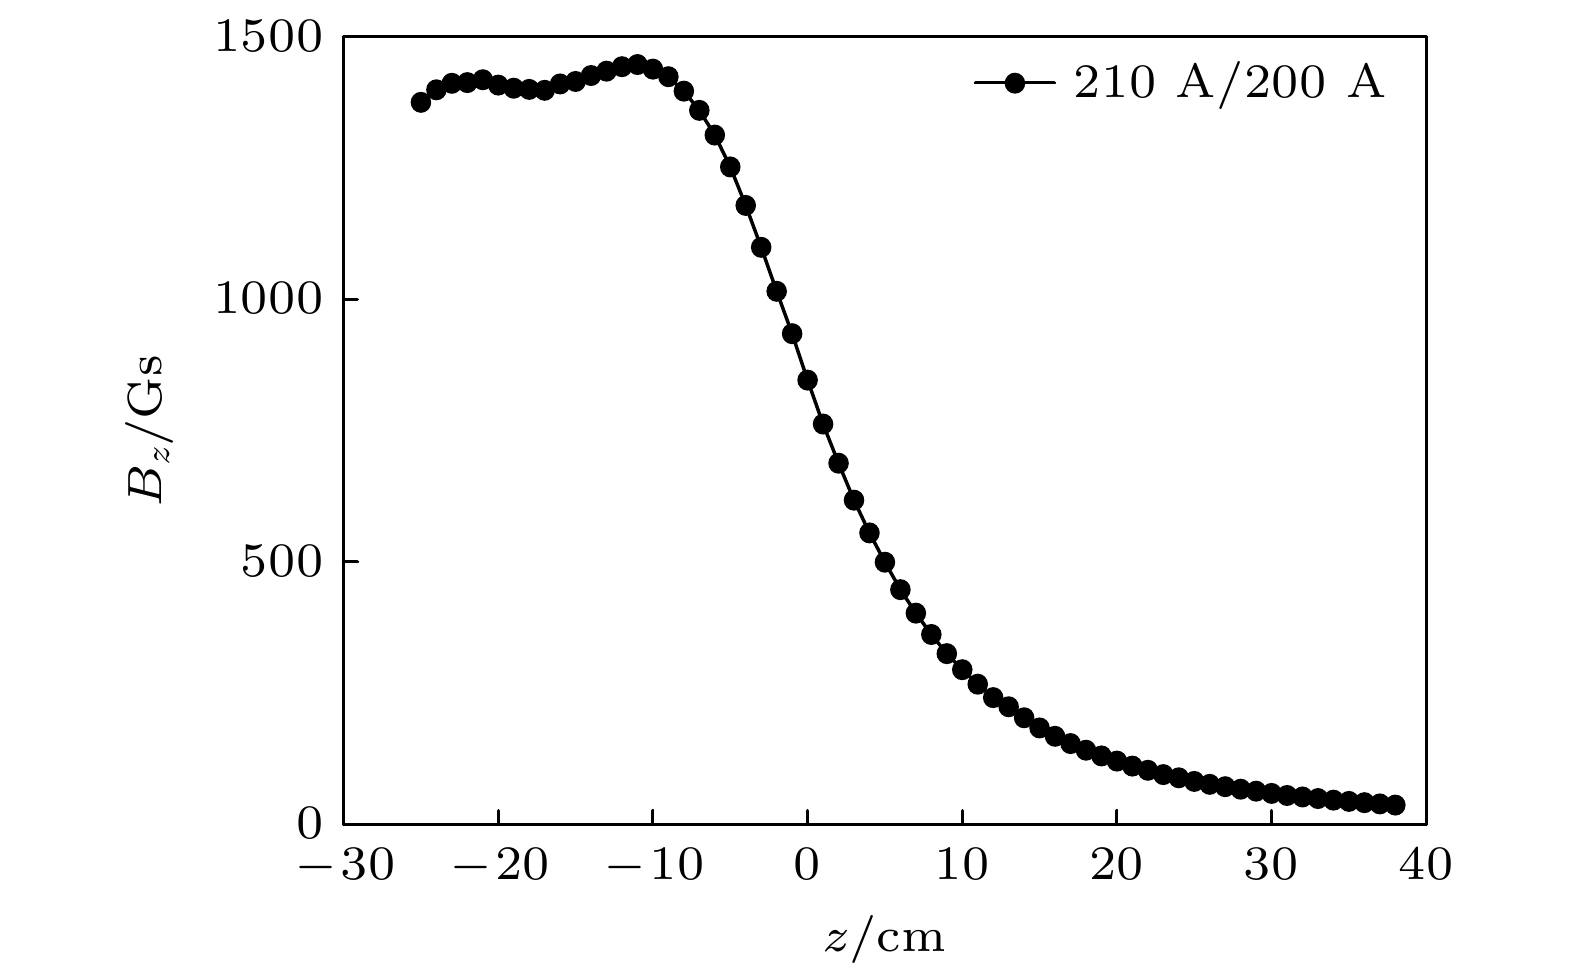
$ 5\times {10}^{-4}~{\mathrm{Pa}} $ . 真空腔体分为源区和扩散区两个部分, 源区为水平放置的圆柱, 内径8 cm, 长25 cm; 扩散区为竖直放置的圆柱, 内径和高度均为60 cm. 为了方便讨论, 使用A, B, C位置来分别代表源区$ z=-10\;{\mathrm{c}}{\mathrm{m}} $ 、扩散区上游$ z=10\;{\mathrm{c}}{\mathrm{m}} $ 和下游$ z=30\;{\mathrm{c}}{\mathrm{m}} $ 这3个位置, 其中$ z $ 为轴向坐标. 将多道高分辨率光谱仪安装在了ECR装置的A, B, C位置, 来测量等离子体的发射光谱. 工作时, 2.45 GHz微波源产生的微波沿着波导传输, 通过石英窗口注入到源区.在开始放电实验之前, 将左右两个磁场线圈电流分别设置为210 A和200 A, 用高斯计测量了磁感应强度轴向分量沿z轴的分布
$ {B}_{z}\left(z\right) $ , 结果见图2. 线圈产生发散位型的磁场, 共振点在$z = 0 $ cm位置附近, 对应的磁感应强度为875 Gs (1 Gs = 10–4 T). -
实验中的ECR氘等离子体源的工作气压较低(~1 Pa), 电子温度约几个eV, 电子密度在
$ {10}^{16}\;{{\mathrm{m}}}^{-3} $ 量级[25–28]. Yacora模型的计算结果表明, 当电子温度为$ 1—5\;{\mathrm{e}}{\mathrm{V}} $ , 电子密度为$ 1\times {10}^{16}— 5\times {10}^{18}\;{{\mathrm{m}}}^{-3} $ 时,$ {I}_{{{\mathrm{H}}}_{{\mathrm{\alpha }}}}/{I}_{{{\mathrm{H}}}_{{\mathrm{\beta }}}} $ 对$ {{\mathrm{H}}}^{-} $ 密度较为敏感, 为诊断ECR中$ {{\mathrm{H}}}^{-} $ 密度($ {{\mathrm{D}}}^{-} $ 密度)提供了一种可能性[21,29]. 根据Yacora模型, 氘原子谱线由6种机制产生, 分别为$ {{\mathrm{D}}}^{+} $ 复合,$ {\mathrm{D}} $ 激发,$ {{\mathrm{D}}}_{2}^{+} $ 激发,$ {{\mathrm{D}}}_{3}^{+} $ 解离复合,$ {{\mathrm{D}}}_{2} $ 激发以及$ {{\mathrm{D}}}^{-} $ 中性化机制, 故特征谱线强度与等离子体中6种粒子$ {{\mathrm{D}}}^{+} $ ,$ {\mathrm{D}} $ ,$ {{\mathrm{D}}}_{2}^{+} $ ,$ {{\mathrm{D}}}_{3}^{+} $ ,$ {{\mathrm{D}}}_{2} $ 和$ {{\mathrm{D}}}^{-} $ 的密度相关[21,29,30].$ {{\mathrm{D}}}^{+} $ 复合机制在电子温度大于1 eV, 电子密度小于$ {10}^{19}\;{{\mathrm{m}}}^{-3} $ 时可以忽略[21]. ECR氘等离子体解离率较高, Wünderlich等[29]测得ECR等离子体解离率大于5%, 通过Langmuir探针测得实验中的ECR氘等离子体电离率约为万分之一[27], 比解离率低两个数量级以上; 由Yacora模型计算结果可知,$ {{\mathrm{D}}}_{2} $ 激发机制、$ {{\mathrm{D}}}_{2}^{+} $ 激发机制和$ {{\mathrm{D}}}_{3}^{+} $ 解离复合机制均可以忽略[21]. 故在上述ECR氘等离子体参数区间内,$ {{\mathrm{D}}}_{{\mathrm{\alpha }}} $ ,$ {{\mathrm{D}}}_{{\mathrm{\beta }}} $ ,$ {{\mathrm{D}}}_{{\mathrm{\gamma }}} $ ,$ {{\mathrm{D}}}_{{\mathrm{\delta }}} $ 谱线的主要激发机制为$ {\mathrm{D}} $ 激发机制和$ {{\mathrm{D}}}^{-} $ 中性化机制[21,29]. 于是,$ {I}_{{{\mathrm{D}}}_{{\mathrm{\alpha }}}}/{I}_{{{\mathrm{D}}}_{{\mathrm{\beta }}}} $ 与$ {{\mathrm{D}}}^{-} $ 密度和$ {\mathrm{D}} $ 密度之比$ {n}_{{{\mathrm{D}}}^{-}}/{n}_{{\mathrm{D}}} $ 、电子温度和电子密度参数有关[21]:其中,
$ {X}_{{{\mathrm{D}}}_{{\mathrm{\alpha }}}}^{{\mathrm{e}}{\mathrm{f}}{\mathrm{f}}, {\mathrm{ }}{\mathrm{D}}}({T}_{{\mathrm{e}}}, {n}_{{\mathrm{e}}}) $ 和$ {X}_{{{\mathrm{D}}}_{{\mathrm{\alpha }}}}^{{\mathrm{e}}{\mathrm{f}}{\mathrm{f}}, {{\mathrm{D}}}^{-}}({T}_{{\mathrm{e}}}, {n}_{{\mathrm{e}}}) $ 分别代表$ {{\mathrm{D}}}_{{\mathrm{\alpha }}} $ 谱线的$ {\mathrm{D}} $ 激发机制和$ {{\mathrm{D}}}^{-} $ 中性化机制的有效激发系数,$ {X}_{{{\mathrm{D}}}_{{\mathrm{\beta }}}}^{{\mathrm{e}}{\mathrm{f}}{\mathrm{f}}, {\mathrm{ }}{\mathrm{D}}}({T}_{{\mathrm{e}}}, {n}_{{\mathrm{e}}}) $ 和$ {X}_{{{\mathrm{D}}}_{{\mathrm{\beta }}}}^{{\mathrm{e}}{\mathrm{f}}{\mathrm{f}}, {{\mathrm{D}}}^{-}}({T}_{{\mathrm{e}}}, {n}_{{\mathrm{e}}}) $ 分别代表$ {{\mathrm{D}}}_{{\mathrm{\beta }}} $ 谱线的$ {\mathrm{D}} $ 激发机制和$ {{\mathrm{D}}}^{-} $ 中性化机制的有效激发系数. 类似(2)式,$ {I}_{{{\mathrm{D}}}_{{\mathrm{\beta }}}}/{I}_{{{\mathrm{D}}}_{{\mathrm{\gamma }}}} $ ,$ {I}_{{{\mathrm{D}}}_{{\mathrm{\beta }}}}/{I}_{{{\mathrm{D}}}_{{\mathrm{\delta }}}} $ 也与$ {n}_{{{\mathrm{D}}}^{-}}/{n}_{{\mathrm{D}}} $ 、电子温度和电子密度有关. 故使用$ {I}_{{{\mathrm{D}}}_{{\mathrm{\alpha }}}}/{I}_{{{\mathrm{D}}}_{{\mathrm{\beta }}}} $ ,$ {I}_{{{\mathrm{D}}}_{{\mathrm{\beta }}}}/{I}_{{{\mathrm{D}}}_{{\mathrm{\gamma }}}} $ ,$ {I}_{{{\mathrm{D}}}_{{\mathrm{\beta }}}}/{I}_{{{\mathrm{D}}}_{{\mathrm{\delta }}}} $ 这3个比值可以求解$ {n}_{{{\mathrm{D}}}^{-}}/{n}_{{\mathrm{D}}} $ 、电子温度和电子密度[21].要进一步得到
$ {{\mathrm{D}}}^{-} $ 的密度, 还需要诊断$ {\mathrm{D}} $ 的密度. Fantz和Wünderlich [21]通过测量$ {{\mathrm{D}}}_{{\mathrm{\gamma }}} $ 的绝对强度来确定$ {\mathrm{D}} $ 密度, 进而给出$ {{\mathrm{D}}}^{-} $ 密度, 但测量谱线的绝对强度需要对光谱仪进行复杂的标定. 在低气压氘等离子体中, 使用氘原子和氘分子的谱线相对强度来诊断解离率(氘原子与氘分子密度比值$ {n}_{{\mathrm{D}}}/{n}_{{{\mathrm{D}}}_{2}} $ )是一种被广泛使用的方法[1,26,28–37].$ {{\mathrm{D}}}_{2} $ 密度一般可以由理想气体状态方程估算, 故可以给出$ {\mathrm{D}} $ 密度, 进而可以估算$ {{\mathrm{D}}}^{-} $ 密度. 这种方法只需要测量氘原子分子谱线相对强度, 而无需测量谱线的绝对强度及标定. 记氘分子Fulcher band ($ {{\mathrm{d}}}^{3}{{{\Pi }}}_{{\mathrm{u}}}\to {{\mathrm{a}}}^{3}{{{\Sigma }}}_{{\mathrm{g}}}^{+} $ )的(2-2)Q1谱线为$ {{\mathrm{F}}}_{(2\text{-}2){{\mathrm{Q}}}_{1}} $ , 氘原子$ {{\mathrm{D}}}_{{\mathrm{\alpha }}} $ 和氘分子$ {{\mathrm{F}}}_{(2\text{-}2){{\mathrm{Q}}}_{1}} $ 的相对强度$ {{\mathrm{D}}}_{{\mathrm{\alpha }}}/{{\mathrm{F}}}_{(2\text{-}2){{\mathrm{Q}}}_{1}} $ 与$ {n}_{{\mathrm{D}}}/{n}_{{{\mathrm{D}}}_{2}} $ 直接相关[1,26,28–37]:其中,
$ {K}_{{\mathrm{d}}{\mathrm{i}}{\mathrm{r}}}^{{\mathrm{e}}{\mathrm{m}}} $ 是氘原子的电子碰撞激发速率系数,$ \eta \left({T}_{{\mathrm{g}}}\right)={n}_{{\mathrm{X}}01}/{n}_{{{\mathrm{D}}}_{2}} $ , 与气体温度$ {T}_{{\mathrm{g}}} $ 有关,$ {n}_{{\mathrm{X}}01} $ 是$ {{\mathrm{d}}}^{3}{{{\Pi }}}_{{\mathrm{u}}}^{-} $ ,$ \nu =2 $ ,$ J=1 $ 能级的密度,$ {\tau }_{{{\mathrm{d}}}^{-}21} $ 是$ {{\mathrm{d}}}^{3}{{{\Pi }}}_{{\mathrm{u}}}^{-} $ ,$ \nu = 2 $ ,$ J = 1 $ 能级的辐射寿命,$ {A}_{{\mathrm{a}}21}^{{{\mathrm{d}}}^{-}21} $ 是$ {{\mathrm{d}}}^{3}{{{\Pi }}}_{{\mathrm{u}}}^{-} $ ,$ \nu = 2 $ ,$ J=1\to {{\mathrm{a}}}^{3}{{{\Sigma }}}_{{\mathrm{g}}}^{+} $ ,$ \nu =2 $ ,$ J=1 $ 跃迁的自发辐射系数,$ {K}_{{\mathrm{m}}{\mathrm{o}}{\mathrm{l}}}^{{\mathrm{e}}{\mathrm{x}}} $ 是$ {\mathrm{X}} $ ,$ \nu =0 $ ,$ J=1\to {{\mathrm{d}}}^{3}{{{\Pi }}}_{{\mathrm{u}}}^{-} $ ,$ \nu =2 $ ,$ J = 1 $ 的电子碰撞激发过程的速率系数. 在实验中,$ {{\mathrm{D}}}_{2} $ 密度可由$ {{\mathrm{D}}}_{2} $ 气压和理想气体状态方程给出. 这样, 将(3)式与Fantz等的$ {I}_{{{\mathrm{D}}}_{{\mathrm{\alpha }}}}/{I}_{{{\mathrm{D}}}_{{\mathrm{\beta }}}} $ 的比值方法结合, 可以进一步估算出$ {{\mathrm{D}}}^{-} $ 密度. 利用发射光谱数据诊断$ {{\mathrm{D}}}^{-} $ 密度方法的误差主要来源于谱线测量数据和碰撞辐射模型截面数据的不确定性. 根据Fantz等[5,21]的估计, 这两类不确定性引起的$ {{\mathrm{D}}}^{-} $ 密度测量的相对误差低于40%. -
在ECR氘气放电实验中, 设置
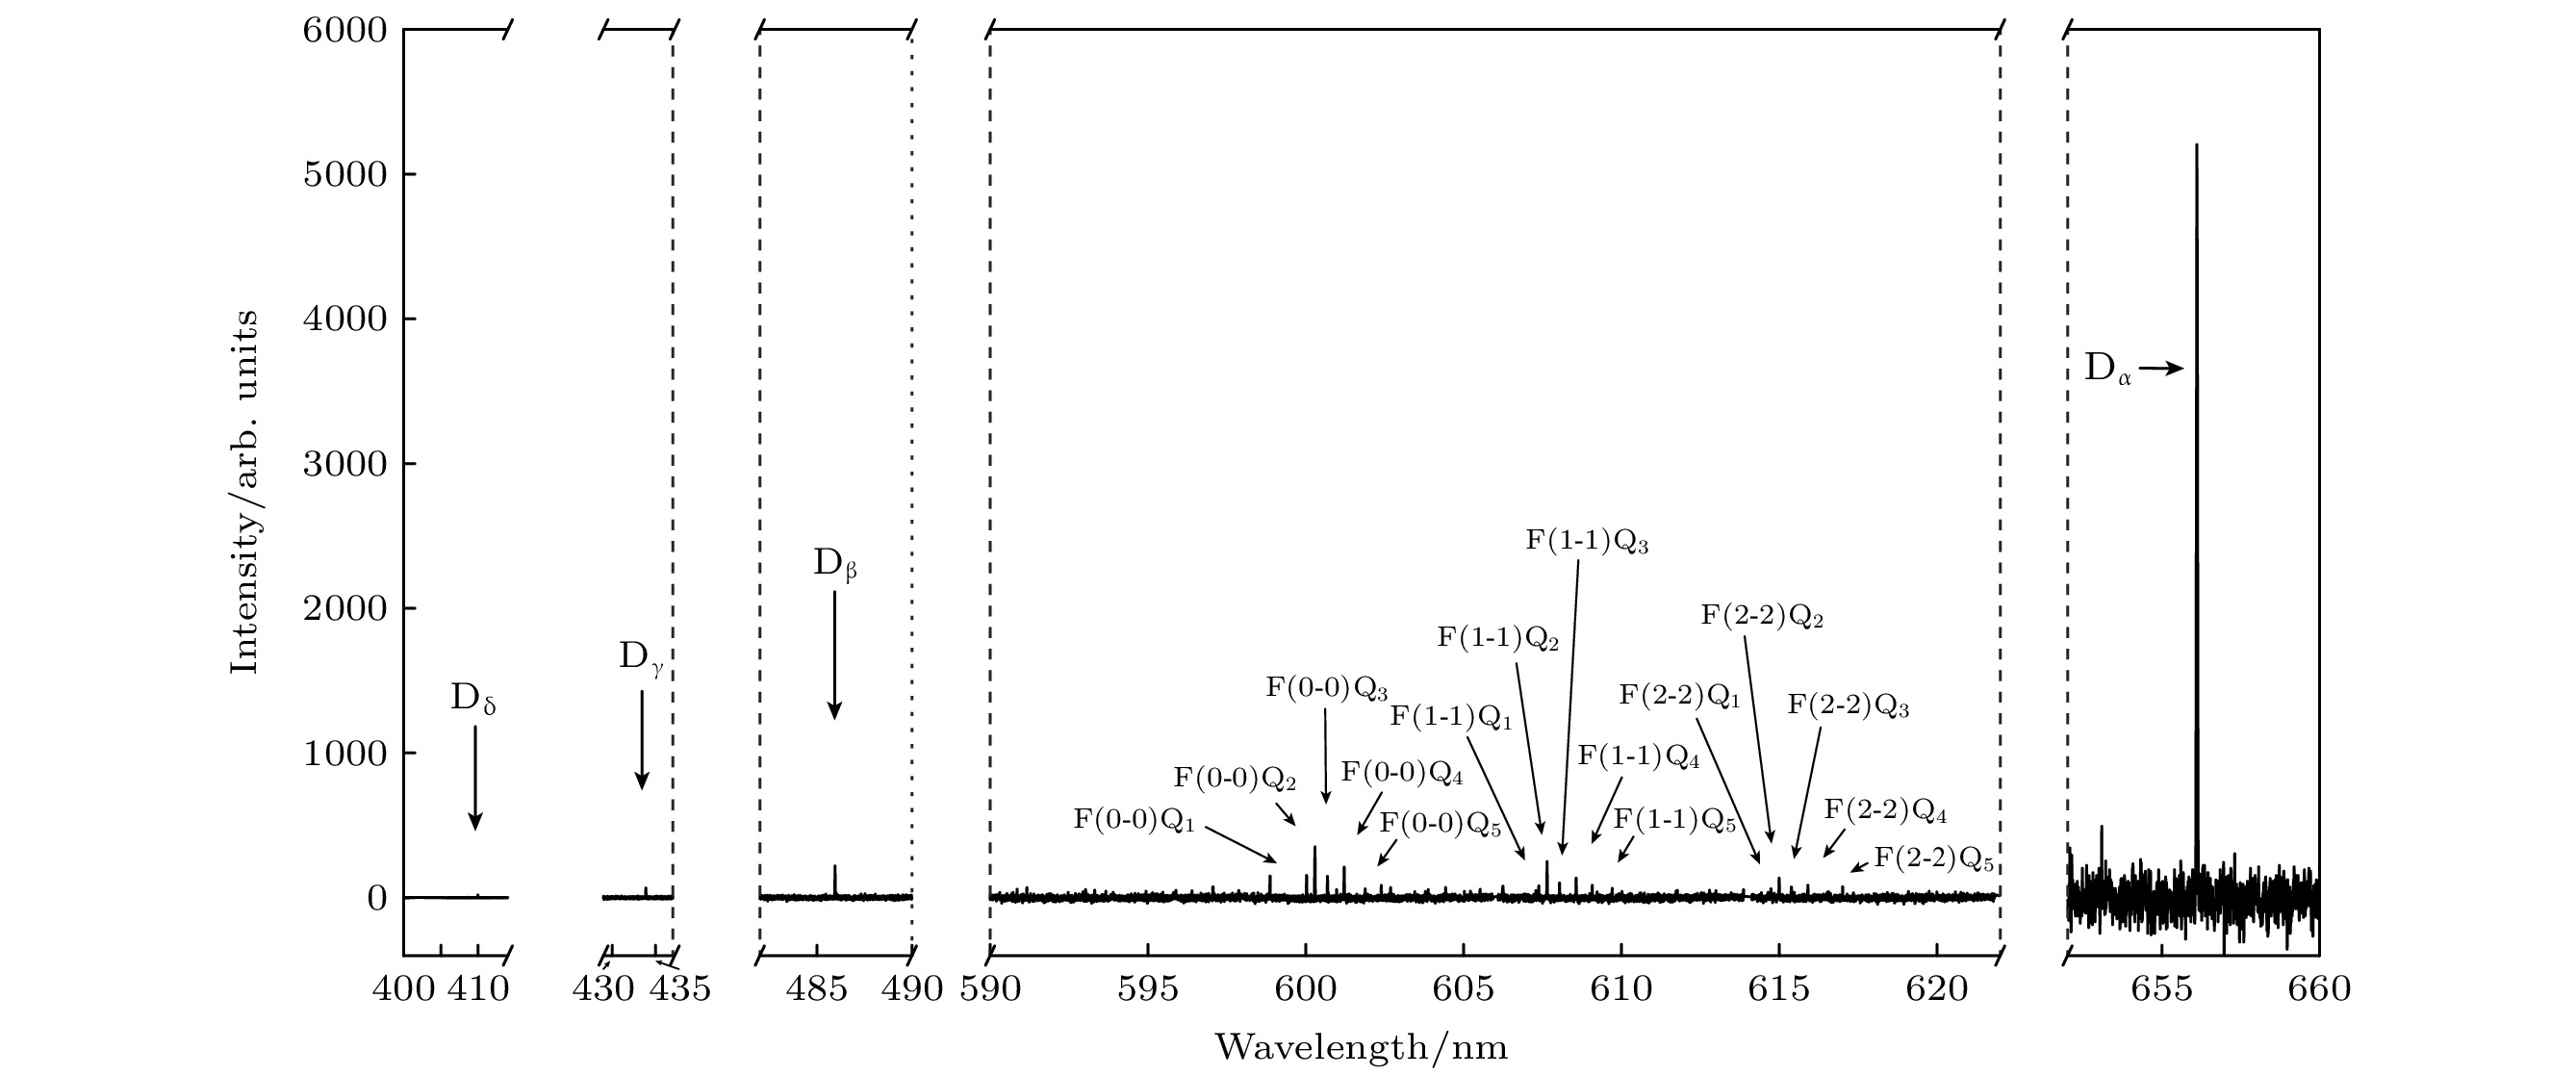
$ {{\mathrm{D}}}_{2} $ 气压为1 Pa, 微波功率为660 W. 使用高分辨率光谱仪采集了源区A位置、扩散区上游B位置、扩散区下游C位置处的氘原子和氘分子的谱线. 以A位置的光谱为例来说明ECR氘等离子体发射光谱特征, 见图3. 图3可以看到氘原子$ {{\mathrm{D}}}_{{\mathrm{\alpha }}} $ ,$ {{\mathrm{D}}}_{{\mathrm{\beta }}} $ ,$ {{\mathrm{D}}}_{{\mathrm{\gamma }}} $ ,$ {{\mathrm{D}}}_{{\mathrm{\delta }}} $ 以及氘分子Fulcher band一系列振动转动谱线, 并标出了$ {{\mathrm{F}}}_{(0-0){{\mathrm{Q}}}_{1}}—{{\mathrm{F}}}_{(2-2){{\mathrm{Q}}}_{5}} $ 共15条Q支谱线.从图3的氘原子特征谱线可以看出, 源区A位置处的
$ {I}_{{{\mathrm{D}}}_{{\mathrm{\alpha }}}}/{I}_{{{\mathrm{D}}}_{{\mathrm{\beta }}}} $ 较高, 约为23.2. Yacora模型的计算结果表明, 在电子温度1—5 eV、电子密度$ 1\times {10}^{16}—5\times {10}^{18}\;{{\mathrm{m}}}^{-3} $ 的参数范围内,$ {{\mathrm{D}}}^{-} $ 中性化机制激发的$ {I}_{{{\mathrm{D}}}_{{\mathrm{\alpha }}}}/{I}_{{{\mathrm{D}}}_{{\mathrm{\beta }}}} $ 显著高于其他5种机制激发的$ {I}_{{{\mathrm{D}}}_{{\mathrm{\alpha }}}}/{I}_{{{\mathrm{D}}}_{{\mathrm{\beta }}}} $ [21]. 这表明源区的$ {I}_{{{\mathrm{D}}}_{{\mathrm{\alpha }}}}/{I}_{{{\mathrm{D}}}_{{\mathrm{\beta }}}} $ 包含有$ {{\mathrm{D}}}^{-} $ 布居机制的贡献, 即存在着氘负离子. 类似地, 在射频负离子源MANITU中, 观察到$ {I}_{{{\mathrm{H}}}_{{\mathrm{\alpha }}}}/{I}_{{{\mathrm{H}}}_{{\mathrm{\beta }}}} $ 约为14.1, 对应的$ {{\mathrm{H}}}^{-} $ 密度约$ 1.2\times {10}^{17}{{\mathrm{m}}}^{-3} $ [21]. 此外, 在ECR扩散区B, C位置,$ {I}_{{{\mathrm{D}}}_{{\mathrm{\alpha }}}}/{I}_{{{\mathrm{D}}}_{{\mathrm{\beta }}}} $ 的值分别为7.4和6.9, 相比源区A位置更低. 这可能是由于扩散区的$ {{\mathrm{D}}}^{-} $ 密度较低,$ {{\mathrm{D}}}^{-} $ 中性化机制在谱线的激发机制中占比较小, 导致$ {I}_{{{\mathrm{D}}}_{{\mathrm{\alpha }}}}/{I}_{{{\mathrm{D}}}_{{\mathrm{\beta }}}} $ 的比值降低.利用A, B, C位置的
$ {{\mathrm{D}}}_{{\mathrm{\alpha }}} $ ,$ {{\mathrm{D}}}_{{\mathrm{\beta }}} $ ,$ {{\mathrm{D}}}_{{\mathrm{\gamma }}} $ ,$ {{\mathrm{D}}}_{{\mathrm{\delta }}} $ ,$ {{\mathrm{F}}}_{\left(2\text{-}2\right){{\mathrm{Q}}}_{1}} $ 特征谱线, 根据模型拟合估算$ {{\mathrm{D}}}^{-} $ 密度等参数值, 计算结果见图4(a)—(c). 图中空心圆圈是实验测量到的3个位置的$ {{\mathrm{D}}}_{{\mathrm{\alpha }}}/{{\mathrm{D}}}_{{\mathrm{\beta }}} $ ,$ {{\mathrm{D}}}_{{\mathrm{\beta }}}/{{\mathrm{D}}}_{{\mathrm{\gamma }}} $ ,$ {{{\mathrm{D}}}_{{\mathrm{\beta }}}/{\mathrm{D}}}_{{\mathrm{\delta }}} $ ,$ {{\mathrm{D}}}_{{\mathrm{\alpha }}}/{{\mathrm{F}}}_{\left(2\text{-}2\right){{\mathrm{Q}}}_{1}} $ 谱线相对强度的实验值, 实心圆点表示模型计算得到的谱线相对强度的拟合值. 横轴是序号, 1—4分别对应$ {{\mathrm{D}}}_{{\mathrm{\alpha }}}/{{\mathrm{D}}}_{{\mathrm{\beta }}} $ ,$ {{\mathrm{D}}}_{{\mathrm{\beta }}}/{{\mathrm{D}}}_{{\mathrm{\gamma }}} $ ,$ {{{\mathrm{D}}}_{{\mathrm{\beta }}}/{\mathrm{D}}}_{{\mathrm{\delta }}} $ ,$ {{\mathrm{D}}}_{{\mathrm{\alpha }}}/{{\mathrm{F}}}_{\left(2\text{-}2\right){{\mathrm{Q}}}_{1}} $ , 纵轴是对数化的谱线相对强度$ {\mathrm{l}}{\mathrm{g}}\left({\mathrm{l}}{\mathrm{i}}{\mathrm{n}}{\mathrm{e}}{\mathrm{r}}{\mathrm{a}}{\mathrm{t}}{\mathrm{i}}{\mathrm{o}}\right) $ .源区A位置处的
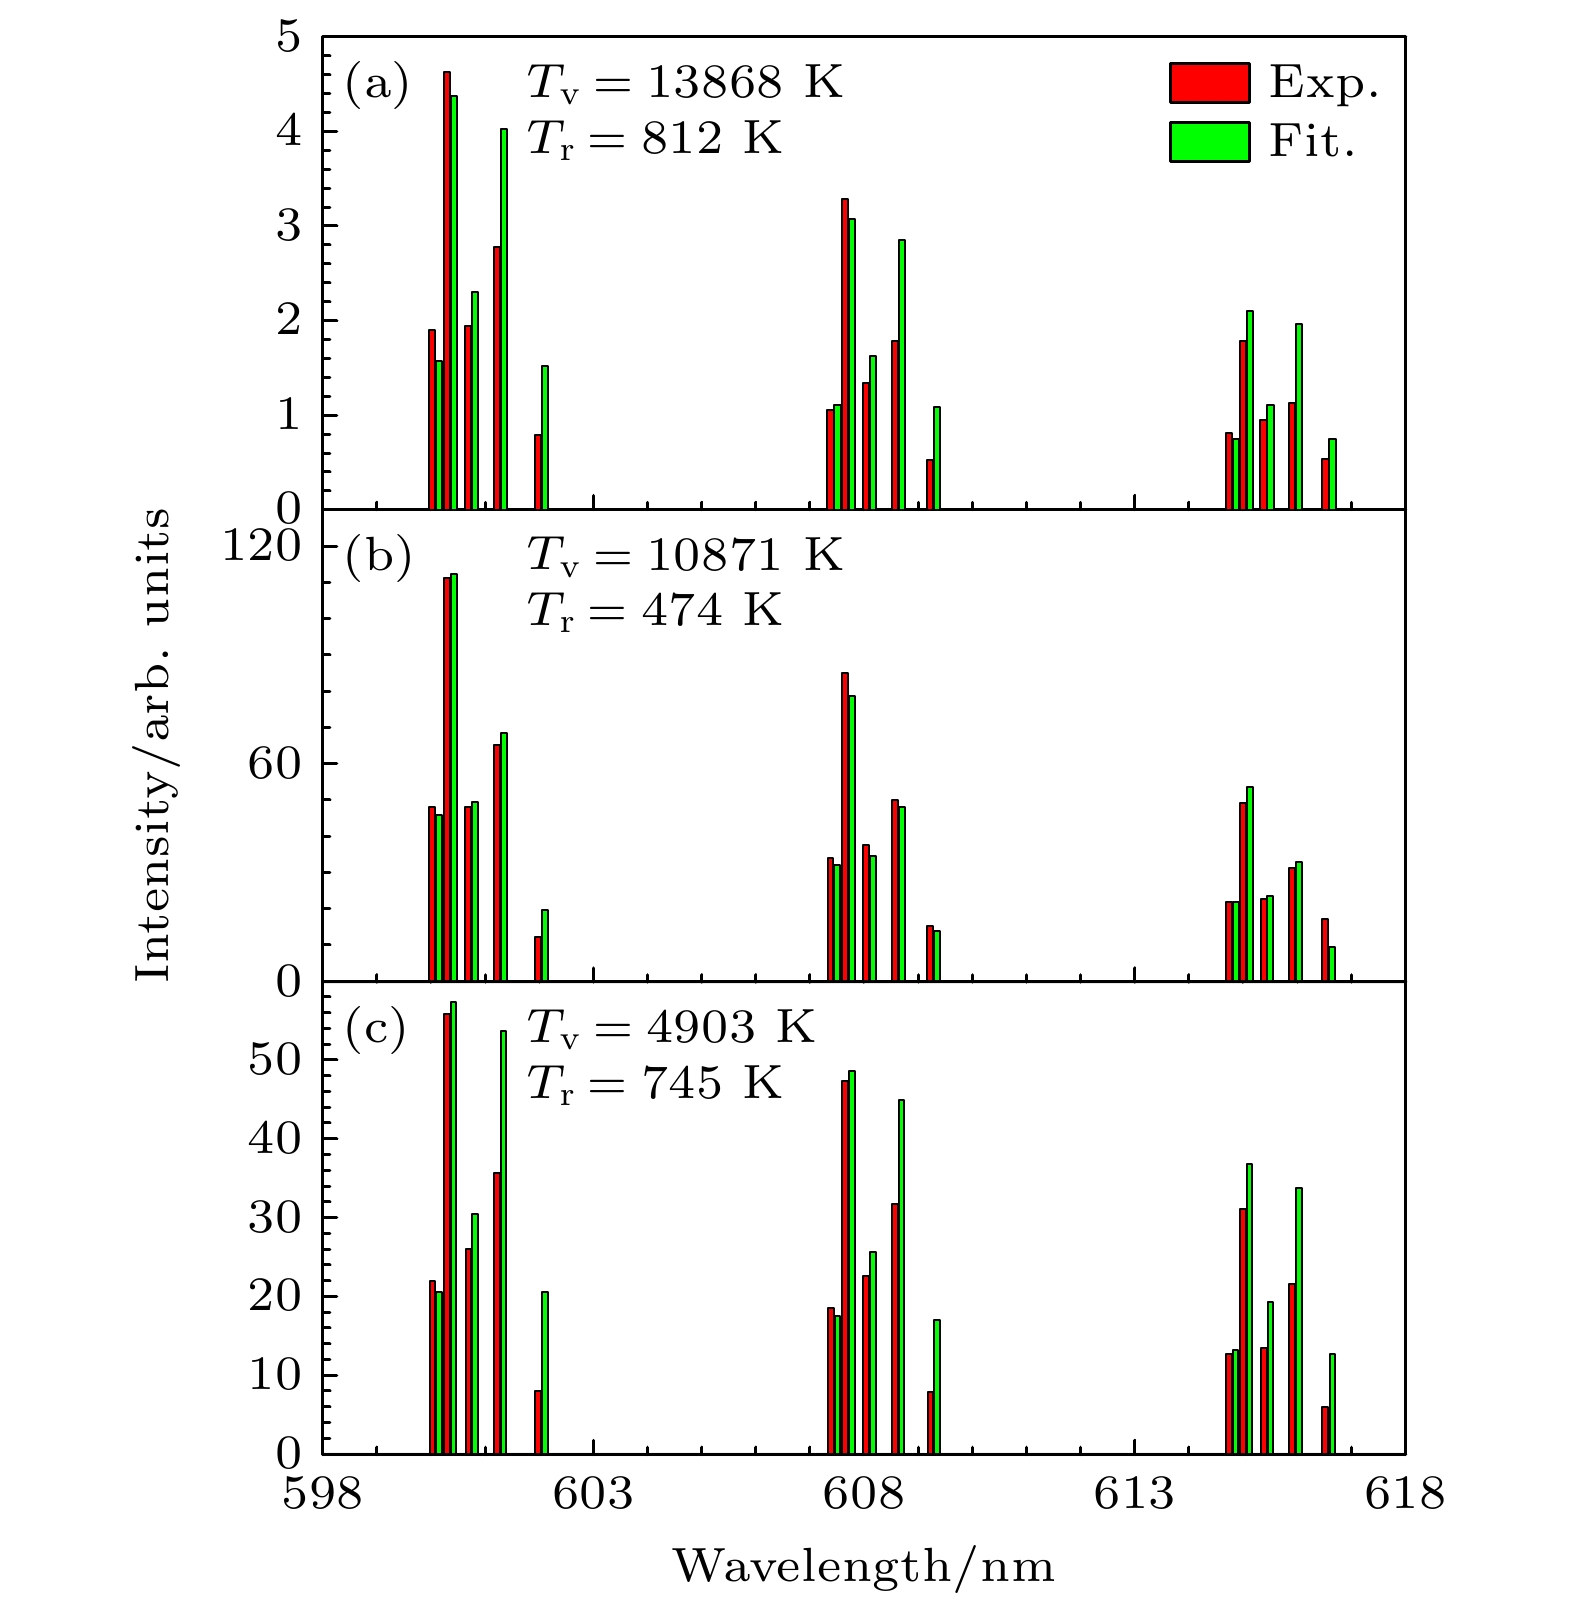
$ {{\mathrm{D}}}^{-} $ 密度较高, 其估算值约为$ 3.6 \times {10}^{15}~{{\mathrm{m}}}^{-3} $ . 相比A位置, B位置和C位置的$ {{\mathrm{D}}}^{-} $ 密度大幅下降, 分别为$ 3.9 \times {10}^{14}~{{\mathrm{m}}}^{-3} $ ,$ 9.7 \times {10}^{13}~{{\mathrm{m}}}^{-3} $ . 源区A位置的$ {{\mathrm{D}}}^{-} $ 密度显著高于扩散区B, C位置;$ {\mathrm{D}} $ 密度和电子密度沿A, B, C位置依次下降, 电子温度则是先增大后减小. 源区产生的等离子体会沿着磁力线进入扩散区, 电子密度在此扩散过程中不断衰减[38,39]. 本工作中, A位置诊断窗口与送气口是重合的, 我们认为A位置电子温度略低于扩散区上游可能是由于通入的冷气体与等离子体相互作用导致的.基于振动转动谱线的日冕模型, 对测量到的氘分子Fulcher band (0-0)Q1—(2-2)Q5这15条Q支谱线强度进行拟合, 诊断了A, B, C三个空间位置的振动温度
$ {T}_{{\mathrm{v}}} $ 和转动温度$ {T}_{{\mathrm{r}}} $ [2,40]. 图5(a)—(c)给出了A, B, C三个位置的Fulcher band Q支谱线强度的实验值和相应的模拟值, 分别用实线柱和虚线柱表示. 横轴是谱线的波长, 纵轴是谱线的强度. 通过拟合结果可知, 振动温度沿A, B, C三个位置依次下降, 转动温度则是先降低再升高. 源区的高振动温度说明存在更多高振动激发态氘分子.氘负离子的产生和损失机制对理解和优化负离子源性能至关重要. 在ECR等离子体中, 氘负离子主要是通过体过程生成, 即低能量的冷电子与高振动激发态的氘分子
$ {{\mathrm{D}}}_{2}^{*}\left({\mathrm{\nu }}\right) $ 之间的解离附着(dissociative attachment, DA)反应[16]:DA反应对电子能量和氘分子振动激发态密度非常敏感, 电子能量降低或者氘分子振动激发态密度升高时, DA反应速率会快速增大.
实验中观察到源区的
$ {{\mathrm{D}}}^{-} $ 密度显著高于扩散区. 我们认为这与ECR等离子体源特征有关. ECR等离子体源区腔体小, 等离子体与壁相互作用较强, 这会导致重组脱附(recombination desorption, RD)[1,3,14]:其中,
$ {\mathrm{D}}\left({\mathrm{w}}{\mathrm{a}}{\mathrm{l}}{\mathrm{l}}\right) $ 指吸附在壁上的氘原子,$ {\mathrm{D}}\left({\mathrm{w}}{\mathrm{a}}{\mathrm{l}}{\mathrm{l}}/{\mathrm{g}}{\mathrm{a}}{\mathrm{s}}\right) $ 是吸附在壁上的氘原子或等离子体中的氘原子. 源区的RD过程会产生更多高振动激发态氘分子, 与观察到的源区振动温度较高现象一致. 这会增强解离附着反应, 有利于氘负离子的产生. 另一方面, 氘负离子的形成和损失通常还与空间输运过程有关. ECR等离子体的源区和扩散区电子密度差异形成的空间电场[25,27], 亦对氘负离子的轴向输运起阻碍作用, 氘负离子的产生和损失是局域性的. 这些导致了ECR源区的$ {{\mathrm{D}}}^{-} $ 密度明显高于扩散区, 存在较大的密度梯度. 因此, 在设计ECR氘负离子源的负离子引出位置时, 应尽可能地将其靠近源区, 以获得较高的$ {{\mathrm{D}}}^{-} $ 密度. -
本文利用发射光谱对电子回旋共振激发的氘负离子密度进行了研究. 对ECR等离子体源区和扩散区不同位置的氘原子及氘分子特征谱线进行测量, 根据Yacora氘原子碰撞辐射模型, 结合
$ {I}_{{{\mathrm{D}}}_{{\mathrm{\alpha }}}}/{I}_{{{\mathrm{D}}}_{{\mathrm{\beta }}}} $ 比值和其他氘原子分子谱线的相对强度估算了$ {{\mathrm{D}}}^{-} $ 密度. 研究发现, 源区的$ {I}_{{{\mathrm{D}}}_{{\mathrm{\alpha }}}}/{I}_{{{\mathrm{D}}}_{{\mathrm{\beta }}}} $ 比值较大, 说明存在$ {{\mathrm{D}}}^{-} $ 中性化机制对特征谱线的选择性增强; 进一步的数据拟合估算了源区的$ {{\mathrm{D}}}^{-} $ 密度, 约为$ 3.6\times {10}^{15}~{{\mathrm{m}}}^{-3} $ . 相对于源区, 扩散区的$ {{\mathrm{D}}}^{-} $ 密度大幅下降. 我们认为这与ECR等离子体源特征有关. ECR源区腔体小, 等离子体和壁的相互作用较强, 重组脱附过程产生更多振动激发态氘分子, 增强了解离附着反应, 有利于氘负离子的产生; 另一方面, ECR等离子体中存在沿轴向的空间电场, 对氘负离子的轴向输运起阻碍作用, 氘负离子的产生和损失是局域性的, 这些导致了源区与扩散区间较大的$ {{\mathrm{D}}}^{-} $ 密度梯度.
电子回旋共振激发氘负离子数密度的光发射谱诊断
Diagnosis of number density of negative deuterium ions excited by electron cyclotron resonance by optical emission spectroscopy
-
摘要: 本文利用多道高分辨发射光谱对电子回旋共振(ECR)激发氘负离子数密度进行研究. 基于Yacora氘原子碰撞辐射模型, 结合氘原子分子谱线相对强度测量, 估算电子回旋共振激发的氘负离子密度. 对ECR源区和扩散区不同位置的氘原子及氘分子特征谱线进行测量, 发现源区的$ {{\mathrm{D}}}_{{\mathrm{\alpha }}} $特征谱线强度远高于$ {{\mathrm{D}}}_{{\mathrm{\beta }}} $的强度, $ {I}_{{{\mathrm{D}}}_{{\mathrm{\alpha }}}}/{I}_{{{\mathrm{D}}}_{{\mathrm{\beta }}}} $比高达23, 表明存在着$ {{\mathrm{D}}}^{-} $中性化机制, 选择性地增强了特征谱线强度; 进一步拟合估算了源区的$ {{\mathrm{D}}}^{-} $密度, 约为$ 3.6\times {10}^{15}\;{{\mathrm{m}}}^{-3} $; 相对于源区, 扩散区的$ {{\mathrm{D}}}^{-} $密度大幅下降. 由于ECR源区腔体小, 等离子体和壁的相互作用较强, 重组脱附过程会产生更多振动激发态氘分子, 增强了解离附着反应, 有利于氘负离子的产生; 另一方面, ECR等离子体中源区与扩散区间存在的空间电场阻碍了氘负离子的轴向输运, 氘负离子的产生和损失是局域性的; 这些使源区与扩散区间存在较大的$ {{\mathrm{D}}}^{-} $密度梯度.
-
关键词:
- 氘负离子源 /
- 发射光谱 /
- 电子回旋共振等离子体
Abstract:The electron cyclotron resonance (ECR) plasma is characterized by low working pressure and high dissociation rate, and it has important applications in the deuterium negative ion $ {{\mathrm{D}}}^{-} $ source technology. In this paper, the Yacora collisional-radiative model is applied to the emission spectrum diagnosis of $ {{\mathrm{D}}}^{-} $ in ECR deuterium plasma. The $ {{\mathrm{D}}}^{-} $ density is estimated by using the $ {I}_{{{\mathrm{D}}}_{{\mathrm{\alpha }}}}/{I}_{{{\mathrm{D}}}_{{\mathrm{\beta }}}} $ ratio and the relative intensity of other deuterium molecular lines, thereby avoiding complex calibration procedure of absolute intensity. The spatial structure of $ {{\mathrm{D}}}^{-} $ is studied by the multichannel emission spectrum measured in the source region and diffusion region. The experiments are conducted on a 2.45-GHz ECR plasma source at a deuterium gas pressure of 1 Pa and microwave power of 660 W. The Balmer series of atomic deuterium ($ {{\mathrm{D}}}_{{\mathrm{\alpha }}} $, $ {{\mathrm{D}}}_{{\mathrm{\beta }}} $, $ {{\mathrm{D}}}_{{\mathrm{\gamma }}} $, $ {{\mathrm{D}}}_{{\mathrm{\delta }}} $) and the Fulcher band Q-branches of molecular deuterium are measured in the source region and expanding region of the ECR plasma. It is found that the intensity of $ {{\mathrm{D}}}_{{\mathrm{\alpha }}} $ in the source region is much higher than that of $ {{\mathrm{D}}}_{{\mathrm{\beta }}} $, specifically, the $ {I}_{{{\mathrm{D}}}_{{\mathrm{\alpha }}}}/{I}_{{{\mathrm{D}}}_{{\mathrm{\beta }}}} $ ratio reaches as high as 23, indicating a selective enhancement of Balmer lines due to the mutual neutralization process of $ {{\mathrm{D}}}^{-} $. Furthermore, $ {{\mathrm{D}}}^{-} $ density in the source region is estimated to be about $ 3.6\times {10}^{15}\;{{\mathrm{m}}}^{-3} $, and the $ {{\mathrm{D}}}^{-} $ density in the expanding region decreases significantly. In the ECR plasma source region, the plasma-wall interaction is strong due to the small volume of the cavity. The recombination desorption process produces more vibrationally excited molecules, thereby further enhancing the dissociation attachment reaction, which is beneficial to the generation of deuterium negative ions. On the other hand, the axial electric field within the ECR plasma inhibits the axial transport of $ {{\mathrm{D}}}^{-} $, suggesting that the production and loss of $ {{\mathrm{D}}}^{-} $ are both localized. These characteristics of the ECR plasma source contribute to the formation of a large gradient of $ {{\mathrm{D}}}^{-} $ density between the source region and the expanding region. -

-
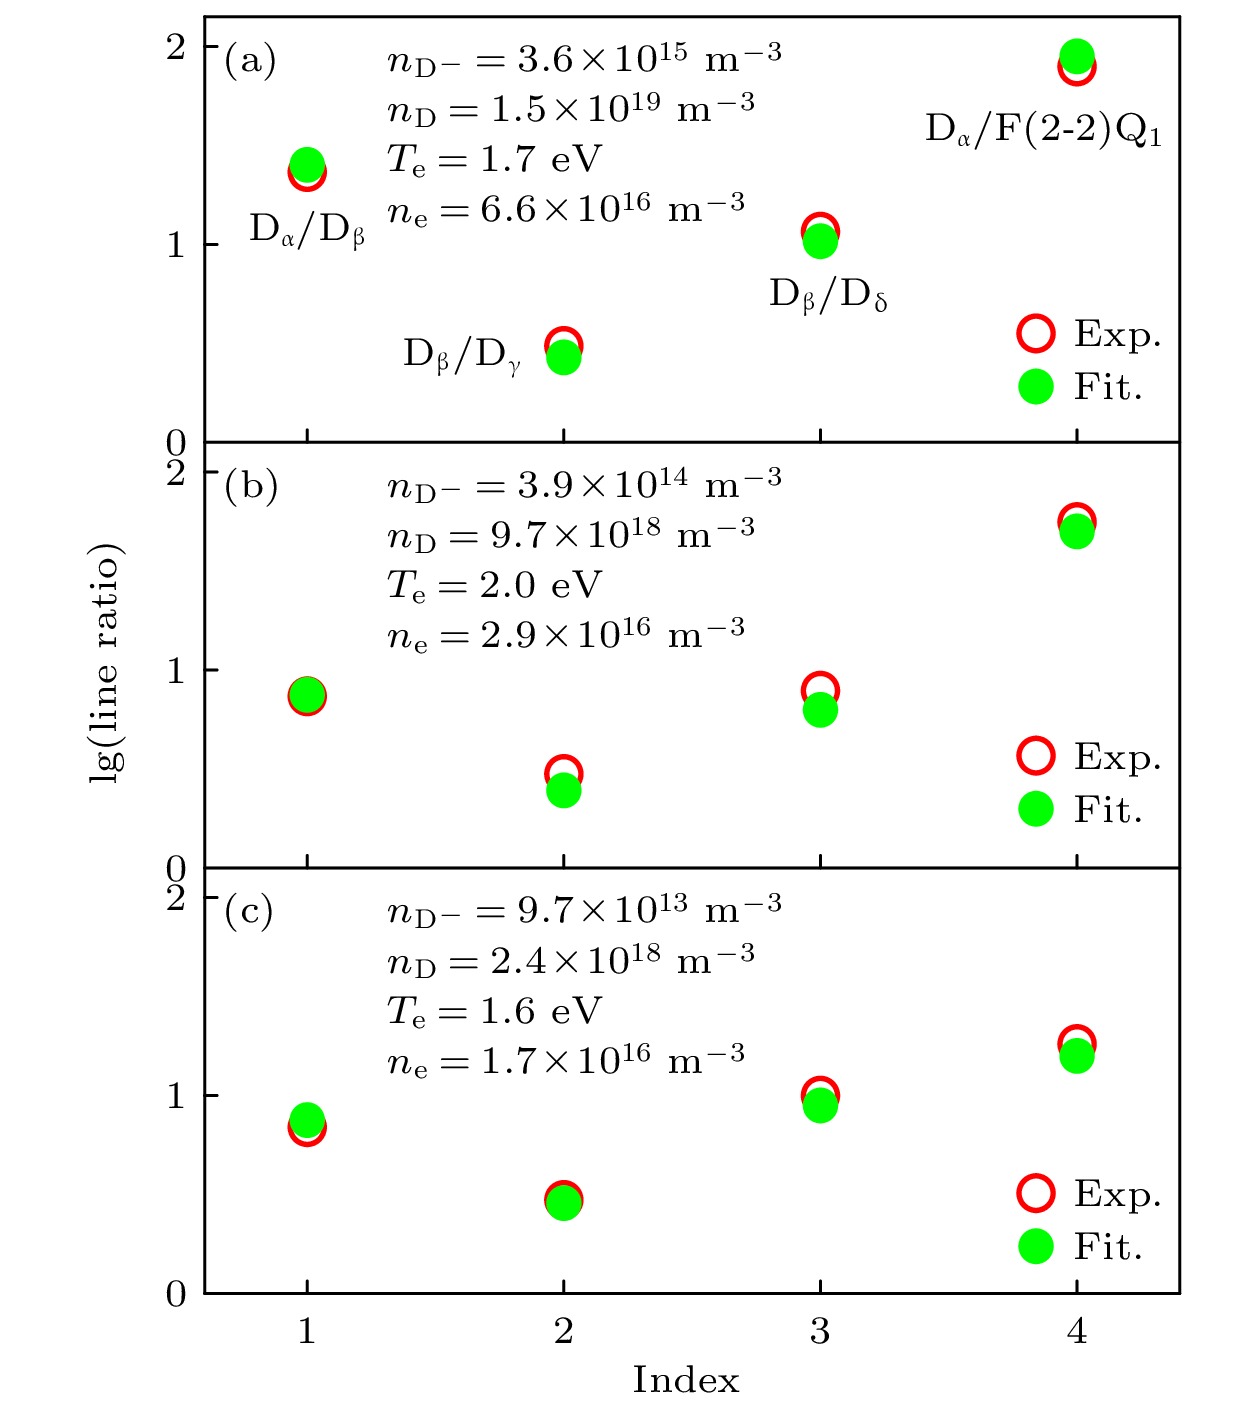
图 4 A, B, C位置谱线相对强度的实验值与模型拟合值
Figure 4. The experimental and fitted line ratios at A, B, C positions.
-
[1] Bentounes J, Béchu S, Biggins F, Michau A, Gavilan L, Menu J, Bonny L, Fombaron D, Bès A, Lebedev Y A, Shakhatov V A, Svarnas P, Hassaine T, Lemaire J L, Lacoste A 2018 Plasma Sources Sci. Technol. 27 055015 doi: 10.1088/1361-6595/aac0ed [2] Fantz U, Heger B 1998 Plasma Phys. Controlled Fusion 40 2023 doi: 10.1088/0741-3335/40/12/003 [3] Averkin S N, Gatsonis N A, Olson L 2015 IEEE Trans. Plasma Sci. 43 1926 doi: 10.1109/TPS.2015.2429313 [4] Fantz U, Franzen P, Kraus W, Falter H D, Berger M, Christ K S, Froschle M, Gutser R, Heinemann B, Martens C, McNeely P, Riedl R, Speth E, Wunderlich D 2008 Rev. Sci. Instrum. 79 02A511 doi: 10.1063/1.2805629 [5] Marini C, Agnello R, Duval B P, Furno I, Howling A A, Jacquier R, Karpushov A N, Plyushchev G, Verhaegh K, Guittienne P, Fantz U, Wünderlich D, Béchu S, Simonin A 2017 Nucl. Fusion 57 036024 doi: 10.1088/1741-4326/aa53eb [6] Sharma S, Sahu D, Narayanan R, Kar S, Bandyopadhyay M, Chakraborty A, Singh M J, Tarey R D, Ganguli A 2022 J. Phys. Conf. Ser. 2244 012055 doi: 10.1088/1742-6596/2244/1/012055 [7] Alton G, Smithe D 1994 Rev. Sci. Instrum. 65 775 doi: 10.1063/1.1144954 [8] Zhao H, Sun L, Guo J, Lu W, Xie D, Hitz D, Zhang X, Yang Y 2017 Phys. Rev. Accel. Beams 20 094801 doi: 10.1103/PhysRevAccelBeams.20.094801 [9] Ren H T, Peng S X, Xu Y, Zhao J, Lu P N, Chen J, Zhang A L, Zhang T, Guo Z Y, Chen J E 2014 Rev. Sci. Instrum. 85 02A927 doi: 10.1063/1.4832065 [10] Torii H, Matsui S 2024 J. Vac. Sci. Technol. A 42 062701 doi: 10.1116/6.0003837 [11] Seker Z, Ozdamar H, Esen M, Esen R, Kavak H 2014 Appl. Surf. Sci. 314 46 doi: 10.1016/j.apsusc.2014.06.137 [12] Ke Y J, Sun X F, Chen X K, Tian L C, Zhang T P, Zheng M F, Jia Y H, Jiang H C 2017 Plasma Sci. Technol 19 095503 doi: 10.1088/2058-6272/aa6d4c [13] 李鑫, 曾明, 刘辉, 宁中喜, 于达仁 2023 物理学报 72 225202 doi: 10.7498/aps.72.20230785 Li X, Zeng M, Liu H, Ning Z X, Yu D R 2023 Acta Phys. Sin. 72 225202 doi: 10.7498/aps.72.20230785 [14] Kurutz U, Friedl R, Fantz U 2017 Plasma Phys. Controlled Fusion 59 075008 doi: 10.1088/1361-6587/aa7120 [15] Svarnas P, Breton J, Bacal M, Mosbach T 2006 Rev. Sci. Instrum. 77 532 [16] Aleiferis S, Tarvainen O, Svarnas P, Bacal M, Béchu S 2016 J. Phys. D: Appl. Phys. 49 095203 doi: 10.1088/0022-3727/49/9/095203 [17] Hill R N 1977 Phys. Rev. Lett. 38 643 doi: 10.1103/PhysRevLett.38.643 [18] Bacal M, Hamilton G W, Bruneteau A M, Doucet H J, Taillet J 1979 Rev Sci Instrum 50 719 doi: 10.1063/1.1135906 [19] O’Keefe A, Deacon D A G 1988 Rev. Sci. Instrum. 59 2544 doi: 10.1063/1.1139895 [20] Lee H, Kim W, Lee J, Park K S, Yoo J J, Atala A, Kim G H, Lee S J 2021 Appl Phys Rev 8 021405 doi: 10.1063/5.0039639 [21] Fantz U, Wünderlich D 2006 New J. Phys. 8 301 doi: 10.1088/1367-2630/8/12/301 [22] Heinemann B, Fantz U, Kraus W, Schiesko L, Wimmer C, Wünderlich D, Bonomo F, Fröschle M, Nocentini R, Riedl R 2017 New J. Phys. 19 015001 doi: 10.1088/1367-2630/aa520c [23] Furno I, Agnello R, Guittienne P, Howling A, Jacquier R, Plyushchev G, Stollberg C, Bechu S, Barbisan M, Fadone M 2020 EURO Fusion Consortium [24] Berger M, Fantz U, Christ K S, Team N 2009 Plasma Sources Sci. Technol. 18 025004 doi: 10.1088/0963-0252/18/2/025004 [25] Zhu B L, Yi K Y, Yang K, Ke W, Ma J X, Zhu X D 2019 Phys. Plasma 26 082107 doi: 10.1063/1.5096241 [26] Schulz-Von D G V, Dbele H F 1996 Plasma Chem. Plasma Process. 16 461 doi: 10.1007/BF01447004 [27] Zhou H Y, Wang L, Zhu X D, Ke B, Ding F, Wen X H, Wang Y N 2010 Rev. Sci. Instrum. 81 033501 doi: 10.1063/1.3302534 [28] Aleiferis S, Svarnas P, Béchu S, Tarvainen O, Bacal M 2018 Plasma Sources Sci. Technol. 27 075015 doi: 10.1088/1361-6595/aabf1b [29] Wünderlich D, Dietrich S, Fantz U 2009 J. Quant. Spectrosc. Radiat. Transfer 110 62 doi: 10.1016/j.jqsrt.2008.09.015 [30] Wünderlich D, Fantz U 2016 Atoms 4 26 doi: 10.3390/atoms4040026 [31] Hollmann E M, Brezinsek S, Brooks N H, Groth M, McLean A G, Pigarov A Y, Rudakov D L 2006 Plasma Phys. Controlled Fusion 48 1165 doi: 10.1088/0741-3335/48/8/009 [32] Lavrov B P, Pipa A V, Röpcke J 2006 Plasma Sources Sci. Technol. 15 135 doi: 10.1088/0963-0252/15/1/020 [33] Rayar M, Le Quoc H, Lacoste A, Latrasse L, Pelletier J 2009 Plasma Sources Sci. Technol. 18 025013 doi: 10.1088/0963-0252/18/2/025013 [34] McNeely P, Wünderlich D 2011 Plasma Sources Sci. Technol. 20 045005 doi: 10.1088/0963-0252/20/4/045005 [35] Dang J J, Chung K J, Hwang Y S 2016 Rev Sci Instrum 87 053503 doi: 10.1063/1.4948919 [36] Yoon J S, Kim Y W, Kwon D C, Song M Y, Chang W S, Kim C G, Kumar V, Lee B 2010 Rep. Prog. Phys. 73 116401 doi: 10.1088/0034-4885/73/11/116401 [37] Méndez I, Gordillo-Vázquez F J, Herrero V J, Tanarro I 2006 J. Phys. Chem. A 110 6060 doi: 10.1021/jp057182+ [38] Wu H M, Graves D B, Porteous R K 1995 Plasma Sources Sci. Technol. 4 22 doi: 10.1088/0963-0252/4/1/003 [39] Fu S L, Chen J F, Hu S J, Wu X Q, Lee Y, Fan S L 2006 Plasma Sources Sci. Technol. 15 187 doi: 10.1088/0963-0252/15/2/003 [40] Majstorović G L, Šišović N M 2015 J. Res. Phys. 38–39 11 doi: 10.1515/jrp-2015-0002 -
图( 5)
计量
- 文章访问数: 302
- HTML全文浏览数: 302
- PDF下载数: 3
- 施引文献: 0