
 首页
首页 登录
登录 注册
注册


-
Chirality, both at the molecular and supramolecular levels, plays a significant role in disciplines such as biology and materials science [1], gaining extensive interest from scientific community, particularly with the advancement of self-assembled nanomaterials. At the biological scale, the proteins, nucleic acids, and other macromolecules making up the human body all have distinctive, singular configurations [2], underlining the profound asymmetry inherent in the molecules of life.
In the context of chemical molecules, the concept of chirality can be likened to that of hands. When two mirror-symmetric molecules cannot be superimposed on each other, they are referred to as a pair of chiral molecules. The simplest form of a chiral molecule features a carbon atom bonded to four distinct groups, with the carbon atom acting as the center of chirality, thus exhibiting central chirality. Distortions within a plane can give rise to linear and planar chirality, whereas more intricate molecular configurations may lead to helical chirality [3]. Additionally, molecules lacking of a chiral structure can still exhibit chirality through interaction with external chiral molecules or fields. The exploration of chirality in supramolecules, which self-assemble from numerous foundational molecules through non-covalent interactions, has also been extensive [4−6]. The processes involved in the generation, transmission, and even amplification of chirality have garnered significant attention [7].
Molecules with different symmetries exhibit different spectra. Furthermore, this characteristics is applicable for chiral molecules. In 1848, Bastein linked chiral structures to optical activity by analyzing crystals of tartaric acid [8]. A pair of chiral molecules interact differently with circularly polarized light, making circular dichroism (CD) spectroscopy a prevalent method for detecting and characterizing the structures of chiral molecules in chemistry, biology, and nanomaterials [9]. Combining with the circularly polarized luminescence spectroscopy, and analyzing from the perspective of energy levels, this spectroscopy enables the detection of chiral information from the ground state to the lowest excited state of molecules. The observation by Zewail et al. [10] in 1988, using femtosecond pump-probe technology to monitor the breaking process of chemical bonds, highlighted the excited state of a molecule transitions to the final emissive state through various relaxation processes, which include excited state structural changes, vibrational cooling, intersystem crossing, and incorporating mechanisms such as inter- or intra-molecular energy transfer and spin-orbit coupling. These ultrafast structural changes in target molecules involved in biological and chemical reactions can be accompanied by the generation, transmission, and amplification of chirality. Integrating transient absorption spectroscopy with chirality detection through transient circular dichroism (TRCD) offers a robust approach for identifying structural changes in the excited molecules [11, 12]. In this perspective paper, we mainly review the progress in developing TRCD spectroscopy instruments with picosecond or shorter time resolution and provide an overview of a home-built femtosecond circular dichroism spectroscopy setup. It also concludes with an introduction to the application of TRCD spectroscopy in the studies of chiral molecules, quantum dots, and other chemical materials.
-
Consider a beam of light travelling from point O in the z direction, as we know, light is a transverse wave, during its propagation in the z-direction, the direction of electric vector can be decomposed into two orthogonal directions, x and y, in the plane perpendicular to the direction of the propagation, see illustration in FIG. 1. If there is a fixed phase
$ \delta ={\delta }_{y}-{\delta }_{x} $ between the electric vectors in these two directions, they will trace an elliptical trajectory during propagation, resulting in what is known as elliptically polarized light. When the phase difference between them satisfies,$ \delta =m\pi (m\in Z) $ , the elliptical trajectory transforms a single-direction oscillation, a special case referred to as linearly polarized light. Moreover, when the intensities are equal and the phase difference is an integer base number multiple of π/2,$ \delta =\dfrac{\pi }{2}+m\pi $ , the light becomes circularly polarized, and the elliptical trajectory changes to a circular. When$ \delta =\dfrac{\pi }{2}+2m\pi $ is satisfied, the endpoints of the synthesised electric vectors in the xy direction rotate clockwise on the circle when observed against the light. Conversely, it is called left-polarized light if$ \delta =-\dfrac{\pi }{2}+2m\pi $ and the rotation is counterclockwise.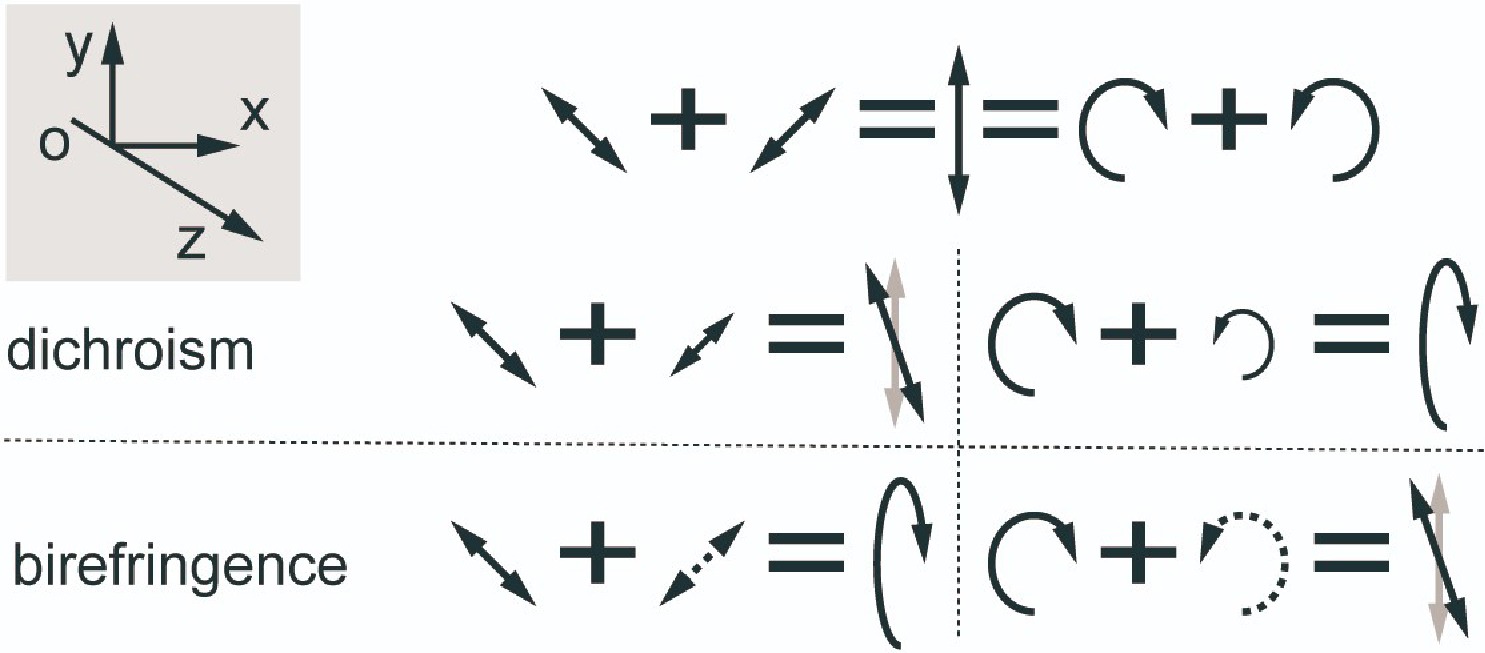
The interaction between light and matter can alter the phase and intensity of polarized light. Generally, a change in phase manifests as birefringence, while a change in intensity manifests as dichroism. Chiral substances influence the polarization characteristics of transmitted light through their circular birefringence
$ \Delta n $ and circular dichroism$ \Delta \varepsilon $ . A beam of linearly polarized light, can be considered as a combination of left-handed circularly polarized light and right-handed circularly polarized light with equal intensity. Upon the incident of linearly polarized light, the birefringence and dichroism associated with both linear and circular polarization lead to various outcomes, manifested in four scenarios. Circular dichroism occurs due to the different absorption of left- and right-handed circularly polarized light, causing the ellipticity of linearly polarized light to change. The distinction between left- and right-handed light corresponds to the circular dichroism spectrum. Utilizing circular birefringence, the polarization direction of the light changes upon passing through the sample, and the alteration in angle change can further indicate the chirality of the molecular structure. The spectrum produced from this process is known as the optical rotation dispersion (ORD) spectrum. -
For the CD spectrum of a molecule, the following relation is given
where
$ \Delta \varepsilon \left(\mathrm{\lambda }\right) $ is the wavelength-dependent circular dichroic extinction coefficient of the chiral molecule. c and l are the concentration of the chiral molecule and the optical path length, respectively. In CD spectroscopy, the magnitude of the absorption difference between the left and right spin is generally defined by the g-factor, which reflects the strength of the molecule’s chirality.For ORD spectra of molecules,
$ \Delta n\left(\mathrm{\lambda }\right) $ is given byFor a light beam of a certain wavelength that is decomposed into two vibration with different directions, the expression for the electric field after passing through the chiral sample is
In Eq.(5),
${\boldsymbol{k}}_{\rm{L}}$ and${\boldsymbol{k}}_{\rm{R}}$ are the wave vectors of the left and right rotating light, and the electric field vector perpendicular to the propagation direction$ \boldsymbol{r} $ can be expressed in the coordinate plane of two orthogonal unit vectors,${\boldsymbol{e}}_{\parallel }$ and$ {\boldsymbol{e}}_{\perp } $ . It is still linearly polarized, with a deflection angle of ORD. The ORD of light of wavelength$ \lambda $ transmitted through a medium of length l can be expressed asIn actual measurements, accounting for experimental factors such as sample concentration optical path length, we express the intensity of the CD spectral in terms of molar ellipticity
$ \left[\theta \right] $ and the intensity of the ORD in terms of specific rotation$ \left[a\left(\lambda \right)\right] $ .where
${\Delta }A $ is the true measured difference in absorption and$ a\left(\lambda \right) $ is the observed angular rotation. Furthermore, the following transformation relation between CD and ORD can be derived by [13]In the case of CD and ORD spectra, unlike conventional absorption spectra, there is frequently a pattern of alternating positive and negative peaks, known as the Cotton effect. It is generally stipulated that when the sign of CD is positive or the positive ORD peak is in the long wavelength direction, this is referred to as the positive Cotton effect.
-
Considering the interaction between the radiation field and molecules, in combination with time-dependent perturbation theory, the transition probability and rate can be obtained by solving the perturbation formula. For steady-state processes, considering a plane monochromatic wave optical field, the expressions for the electric and magnetic fields are as follows:
The equation above includes definitions for k, the wave vector, and ω, the angular frequency. In the case of visible light, where the wavelength is significantly larger than the size of the atom, it can be viewed as a uniform electric field. Therefore the electric field can be expressed as follows:
Using the electric dipole approximation, the first-order perturbation Hamiltonian
${{H}}^{\prime}$ can be obtained by:Bringing in the first-order perturbation formula yields the transition probability from the initial quantum state A to the final quantum state B:
In the above formula,
${\boldsymbol{\mu }}_{BA}=\langle{\varphi }_{B}|\boldsymbol{\mu }|{\varphi }_{A}\rangle$ and${\omega }_{BA}=\dfrac{{E}_{B}-{E}_{A}}{\hbar}$ . Derivation of the transition probability with respect to time yields the transition rate. In steady state absorption measurements, it is assumed that the time is sufficiently long and considering unpolarized light averaged over E, a rate of leaps can be determined:The formula reveals that the influence stems from both the electric dipole moment of the molecule itself and the external light field. Considering the Born-Oppenheimer approximation, which asserts that the nuclear wave function remains unchanged before and after the transition, the electric dipole moment primarily reflects the changes in electronic configuration before and after the transition of the molecule.
For the absorption of circularly polarized light, it can be solved by expanding the perturbative Hamiltonian quantity. The second-order perturbation term includes magnetic dipole moments and electric quadrupole moments. However, the electric quadrupole moments cancel each other out during the statistical averaging process of molecules [14], resulting in the circular dichroism spectrum being dominated by magnetic dipole contributions.
where m can be understood as the magnetic moment generated by the rotation of electrons with a radius
$ \left|\boldsymbol{r}\right| $ . By introducing the new Hamiltonian into the perturbation equation, a similar expression for the rotational strength can be calculated, which reflects the strength of the chiral spectrum [15],From the formula, it is evident that if there is a chiral spectrum, its jump electric dipole moment and magnetic dipole moment must not be zero. The angle between the two dipole moments determines its positive or negative sign, which corresponds to the positive or negative Cotton effect in the spectrum. Therefore, by analyzing the Cotton effect across different absorption bands of chiral spectra, the structure of biological macromolecules such as proteins and DNA can be obtained [16−19].
The current techniques of circular dichroism detection and circularly polarized luminescence only reflect the chiral information at the ground state and the terminal emissive excited state. However, the detection of chiral signals caused by molecular twisting and molecular rotation during solvent relaxation in the excited states remains inadequately explored. The non-radiative transitions that occur during the relaxation of the excited state can also be addressed by reformulating the Hamiltonian
${H}{{{'}}}$ using time-dependent perturbation theory. For example, when considering Hamiltonian${H}{{{'}}}$ , introducing the electrostatic interactions between electrons and nuclei can describe the internal conversion process. This similar process can be used for the analysis of TRCD spectroscopy signals. For practical solutions, Fermi’s golden rule can also be directly applied to calculate the rate constant$ k $ .where,
$ {\varphi }_{a} $ and$ {\varphi }_{b} $ are the wave functions of the initial and final states, respectively, and ρ is the density of states. By fully considering the magnetic dipole moment term in$H^{\prime}$ , the interaction between the molecule and circularly polarized light in the non-radiative transition process can be described, resulting in an alteration of the molecule’s chirality. Through chemical kinetic calculations, it is possible to determine the configuration and electron cloud distribution at various times during the relaxation process of the molecule’s excited state. This allows for the direct determination of the magnitude and direction of the molecular electric and magnetic dipole moments. By introducing the formula for rotational intensity, the transient chirality information of the molecule can be obtained [20, 21].Due to computational constraints, the chirality of excited states of large molecules cannot be solved through computation alone, and the optimization of computational models also relies on the feedback from molecular transient absorption data. The detection of molecular excited state dynamics is often based on the pump-probe spectroscopy technique. The transient absorption signals obtained by pump-probe techniques are mainly divided into three components: ground-state bleaching (GSB), excited-state absorption (ESA), and stimulated emission (SE). Ground-state bleaching is observed as a decrease in molecular absorbance at the ground state, which corresponds to steady-state absorption. Excited-state absorption is identified by a positive signal corresponding to the absorption of molecules in excited state, while stimulated emission manifests as a decrease in molecular emission in the excited state corresponds to steady-state fluorescence emission. TRCD spectra of the molecules can be acquired using the circular polarization detection. The ground-state bleaching components can be interpreted in conjunction with the steady-state CD, while the excited-state absorption component reflects the chiral information during the excited state relaxation process. However, since the population of the molecules in the excited state is about one-thousandth of that in the ground state and the circularly dichroic absorption is also one-thousandth of the steady-state absorption, the time-resolved circularly dichroic signals are tiny (usually in the order of μOD). Additionally, the polarization artifacts caused by the polarization of the excitation light and the sample’s inherent linear dichroism significantly influence the detection of circularly polarized signals. Therefore, measurement of TRCD is not straightforward. In recent years, with the improvement of instrumental detection sensitivity and the continuous optimization of polarization modulation technology, the time resolution and accuracy of TRCD spectroscopy have been significantly improved [12]. Due to the achievement of the TRCD instruments as well as the recent theoretical analysis of TRCD signal [22], studies on the excited state chirality of molecules have received increasing attention.
-
According to steady-state chiral spectroscopy, there are two approaches to achieve transient chiral spectroscopy. The first one involves measuring changes in the rotation angle and ellipticity of transmitted light after the sample using linearly polarized light, referred to as ellipticity detection. The second one uses pulsed light to modulate the left- and right-handed circularly polarized light and measures absorption directly, known as the differential absorption method. With the development of polarization modulation components and light sources, the time resolution and signal-to-noise ratio of both methods are constantly improved. Ellipticity detection, through the measurement of linear polarization, can be significantly affected by sample’s linear birefringence and linear dichroism. Even with isotropic liquid samples, it is also prone to errors due to anisotropy induction by the excitation light. The differential absorption method may encounter errors stemming from non-chiral absorption fluctuations of the sample itself, due to the differences in background absorption detection.
As early as 1985, Kliger et al. implemented nanosecond flash photolysis using strained fused silica plates [23]. In 1989, Xie and Simon achieved picosecond pump-probe by combining an electro-optical modulator with a lock-in amplifier [24]. In 2000, Hache et al. achieved sub-picosecond temporal resolution as well by modulating a femtosecond source with a Pockels cell combined with a lock-in amplifier [25]. However, the application of early TRCD spectroscopy was constrained by the sensitivity of detectors and was primarily utilized for substances with large circular dichroism signals, such as myoglobin and Ru compounds.
In FIG. 2, we have summarized representative TRCD setups in recent years. In 2006, Niezborala et al., as shown in the FIG. 2(a), cleverly used the Jones matrix to analyze the variation of the detected optical ellipticity before and after the sample. The circular dichroic and circular birefringent signals of the sample are explained by plotting a parabola with the compensation of the Babinet-Soleil compensator and the angle of the detector as parameters [26]. This approach enables the detection of transient circular dichroism spectra on a sub-picosecond scale. Although the parabolic detection method is time-consuming, it is straightforward and convenient for measurement, achieving a sensitivity order of 1 × 10⁻⁴ (ΔCD noise). In 2015, Hiramatsu et al. achieved broadband and sensitive TRCD spectroscopy with femtosecond time resolution, their experimental setup is shown in FIG. 2(c). By combining line bias detection with optical aberration amplification, their experimental sensitivity reaches a magnitude of 5 × 10⁻⁵ (ΔCD noise) [27]. In their work, a further achievement was made to separate the TRCD signal from linear dichroism and linear birefringence using singular value decomposition (SVD). More recently, Fabrizio Preda et al. have introduced a polarization detection technique that combines time-domain detection with outlier amplification techniques. This method, noted for its simplified optical path setup and sensitive detection of interference, may become a new direction in ellipticity detection [28].
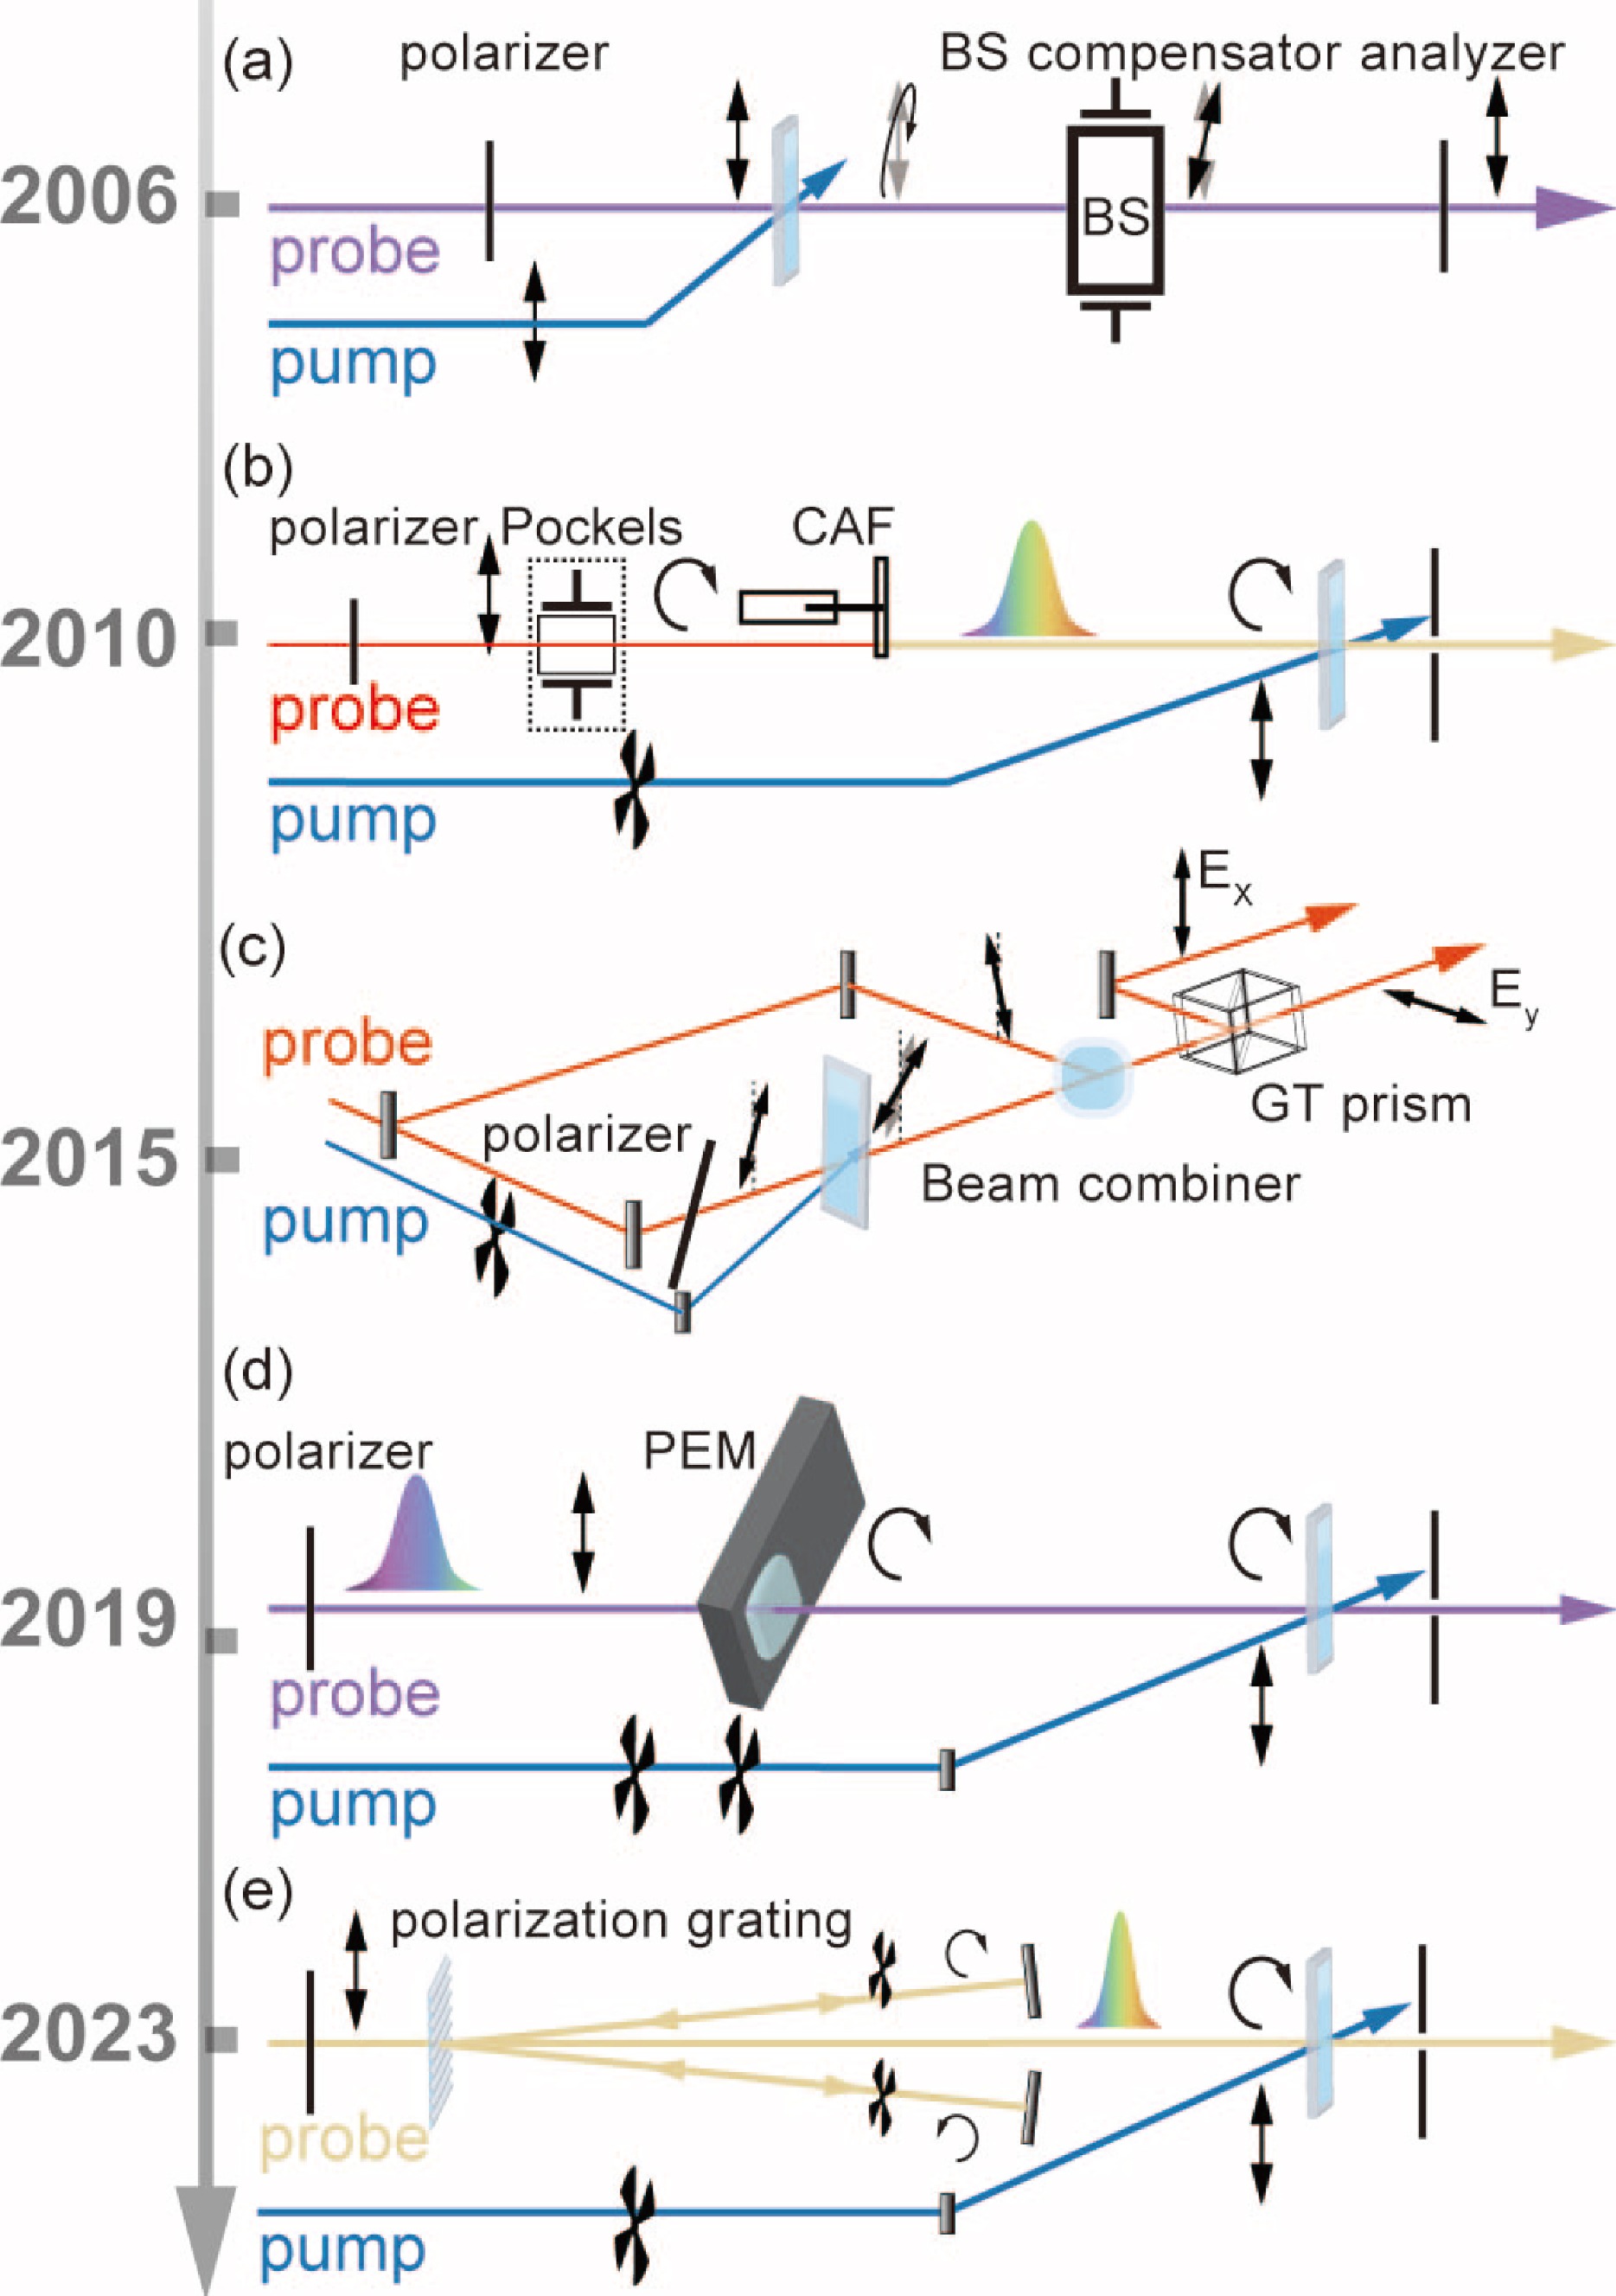
At the same time, the field of differential absorption detection has been rapidly advanced. In 2010, Trifonov et al. achieved broadband detection in the visible spectral region by modulating 400 nm optical circular polarization using a Pockel cell, as in FIG. 2(b), generating circularly polarized supercontinuum white light in the visible wavelength band using calcium fluoride [29]. Circular dichroism was monitored using a combination of a broadband quarter-wave wavelength and two crossed polarizers. The signal-to-noise ratio was improved and optical artefacts were reduced with the help of phase-locked detection techniques for dual-beam detection, achieving sub-picosecond temporal resolution and TRCD spectra with noise levels typical in 10−4 OD range. In 2019, Opperman et al. utilized a photoelastic modulator (PEM) to achieve broadband TRCD in the UV band with femtosecond time resolution [30]. Their optical setup is shown in FIG. 2(d). The PEM offered a better reception angle compared to a Pockel cell. In their work, both transient and steady-state CD measurements were performed using pulse modulation, which improved the sensitivity to less than 2 × 10⁻⁵ OD. Recently, Ress et al. have also been successful with their technique that combines a polarization grating with a chopper to achieve alternating left-right circular bias, shown in FIG. 2(e), elucidating the TRCD dynamics of excitons with the help of the Frenkel exciton theory. This approach is not constrained by the intrinsic frequency of the PEM and may offer a broader range of application [22].
Our group has developed a femtosecond TRCD spectroscopy, using supercontinuum white light as the probe light. FIG. 3(a) shows the optical scheme for our TRCD setup. A Ti:Sapphire femtosecond laser was utilized to generate fundamental femtosecond pulsed light at 800 nm. A PEM was then employed to produce circularly polarized light with alternating left and right rotations in the temporal sequence [31]. This circular light at 800 nm was used to generate supercontinuum white light in the visible band from 480 nm to 750 nm through a sapphire crystal. Meanwhile, the pump light was generated by an optical parametric amplifier using the fundamental pulsed light at 800 nm. The steady-state circularly dichroic acquisition and transient circularly dichroic acquisition were achieved through the integration with data acquisition software. A portion of the white light was split off as reference light via a beam splitter to help intensity detection, thereby reducing the noise. Modulating the voltage of the PEM to alter the phase difference introduced, and adjusting the incident polarization angle to change its component’s intensity on the fast and slow axes, allow for enhanced circular polarization. This improvement facilitates better circular dichroism detection capability, which are verified by comparison with commercial steady-state circular dichroism spectrometers using DNA samples intercalated with acridine orange (AO), seen in FIG. 3(b). To prepare the samples, a 0.5 mg/mL solution of calf thymus DNA in Tris/HCl buffer (pH=7.4) was mixed with a 50 μmol/L solution of AO. 2 mL AO was dropped into 1 mL of DNA solution with stirring to configure the intercalated sample, which exhibited an intercalation steady-state absorption peak at 495 nm.
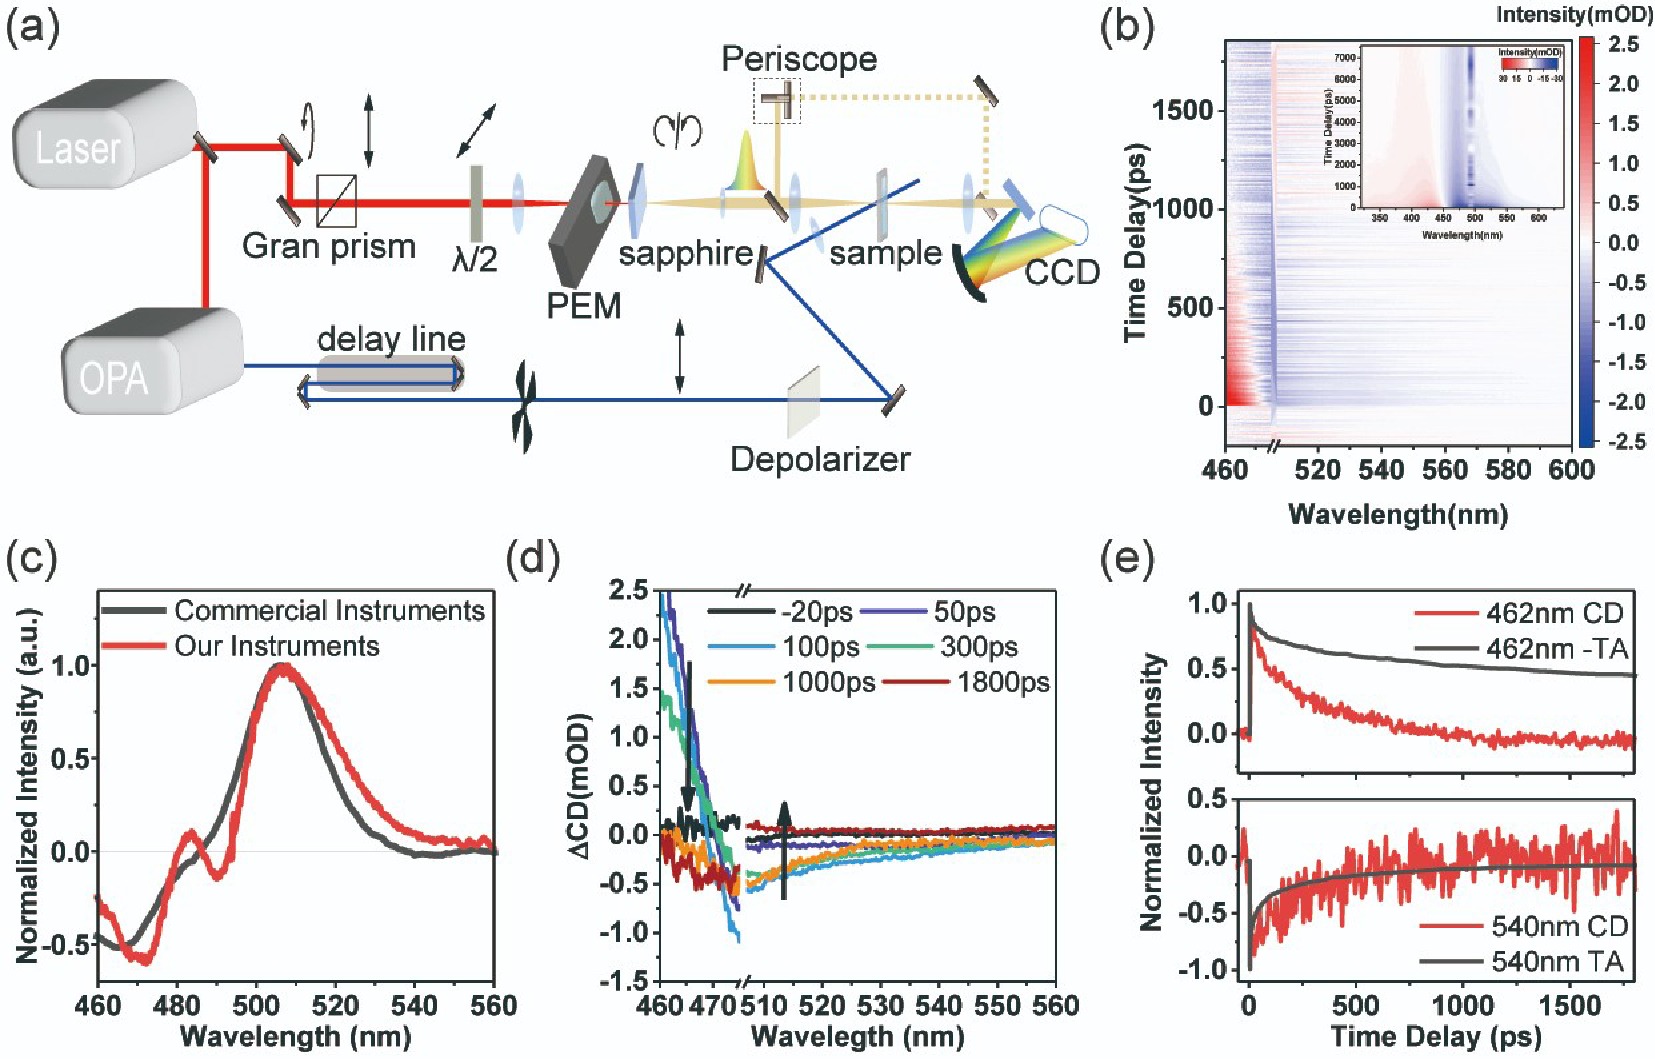
The transient circular dichroic signal was acquired by depolarized optical pumping. Upon the removal of excitation light scattering, the spectra show obvious ground state bleaching and excited state absorption signals. Notably, the signal associated with ground-state bleaching in FIG. 3(c) is inversely related to the steady-state CD signal in terms of polarity, reflecting the chiral recovery process in the ground-state. According to FIG. 3(d), by combining transient absorption data, we analyzed the dynamics at the wavelength of 462 nm and found that the short-lived lifetime (~10 ps) was more consistent, while the long-lived lifetime (~150 ps) might correspond to chirality-insensitive processes. However, the excited state absorption dynamics at 540 nm show a roughly consistent decay for both TRCD and TA spectra. Detailed TA and TRCD spectra are shown in Supplementary materials (SM).
-
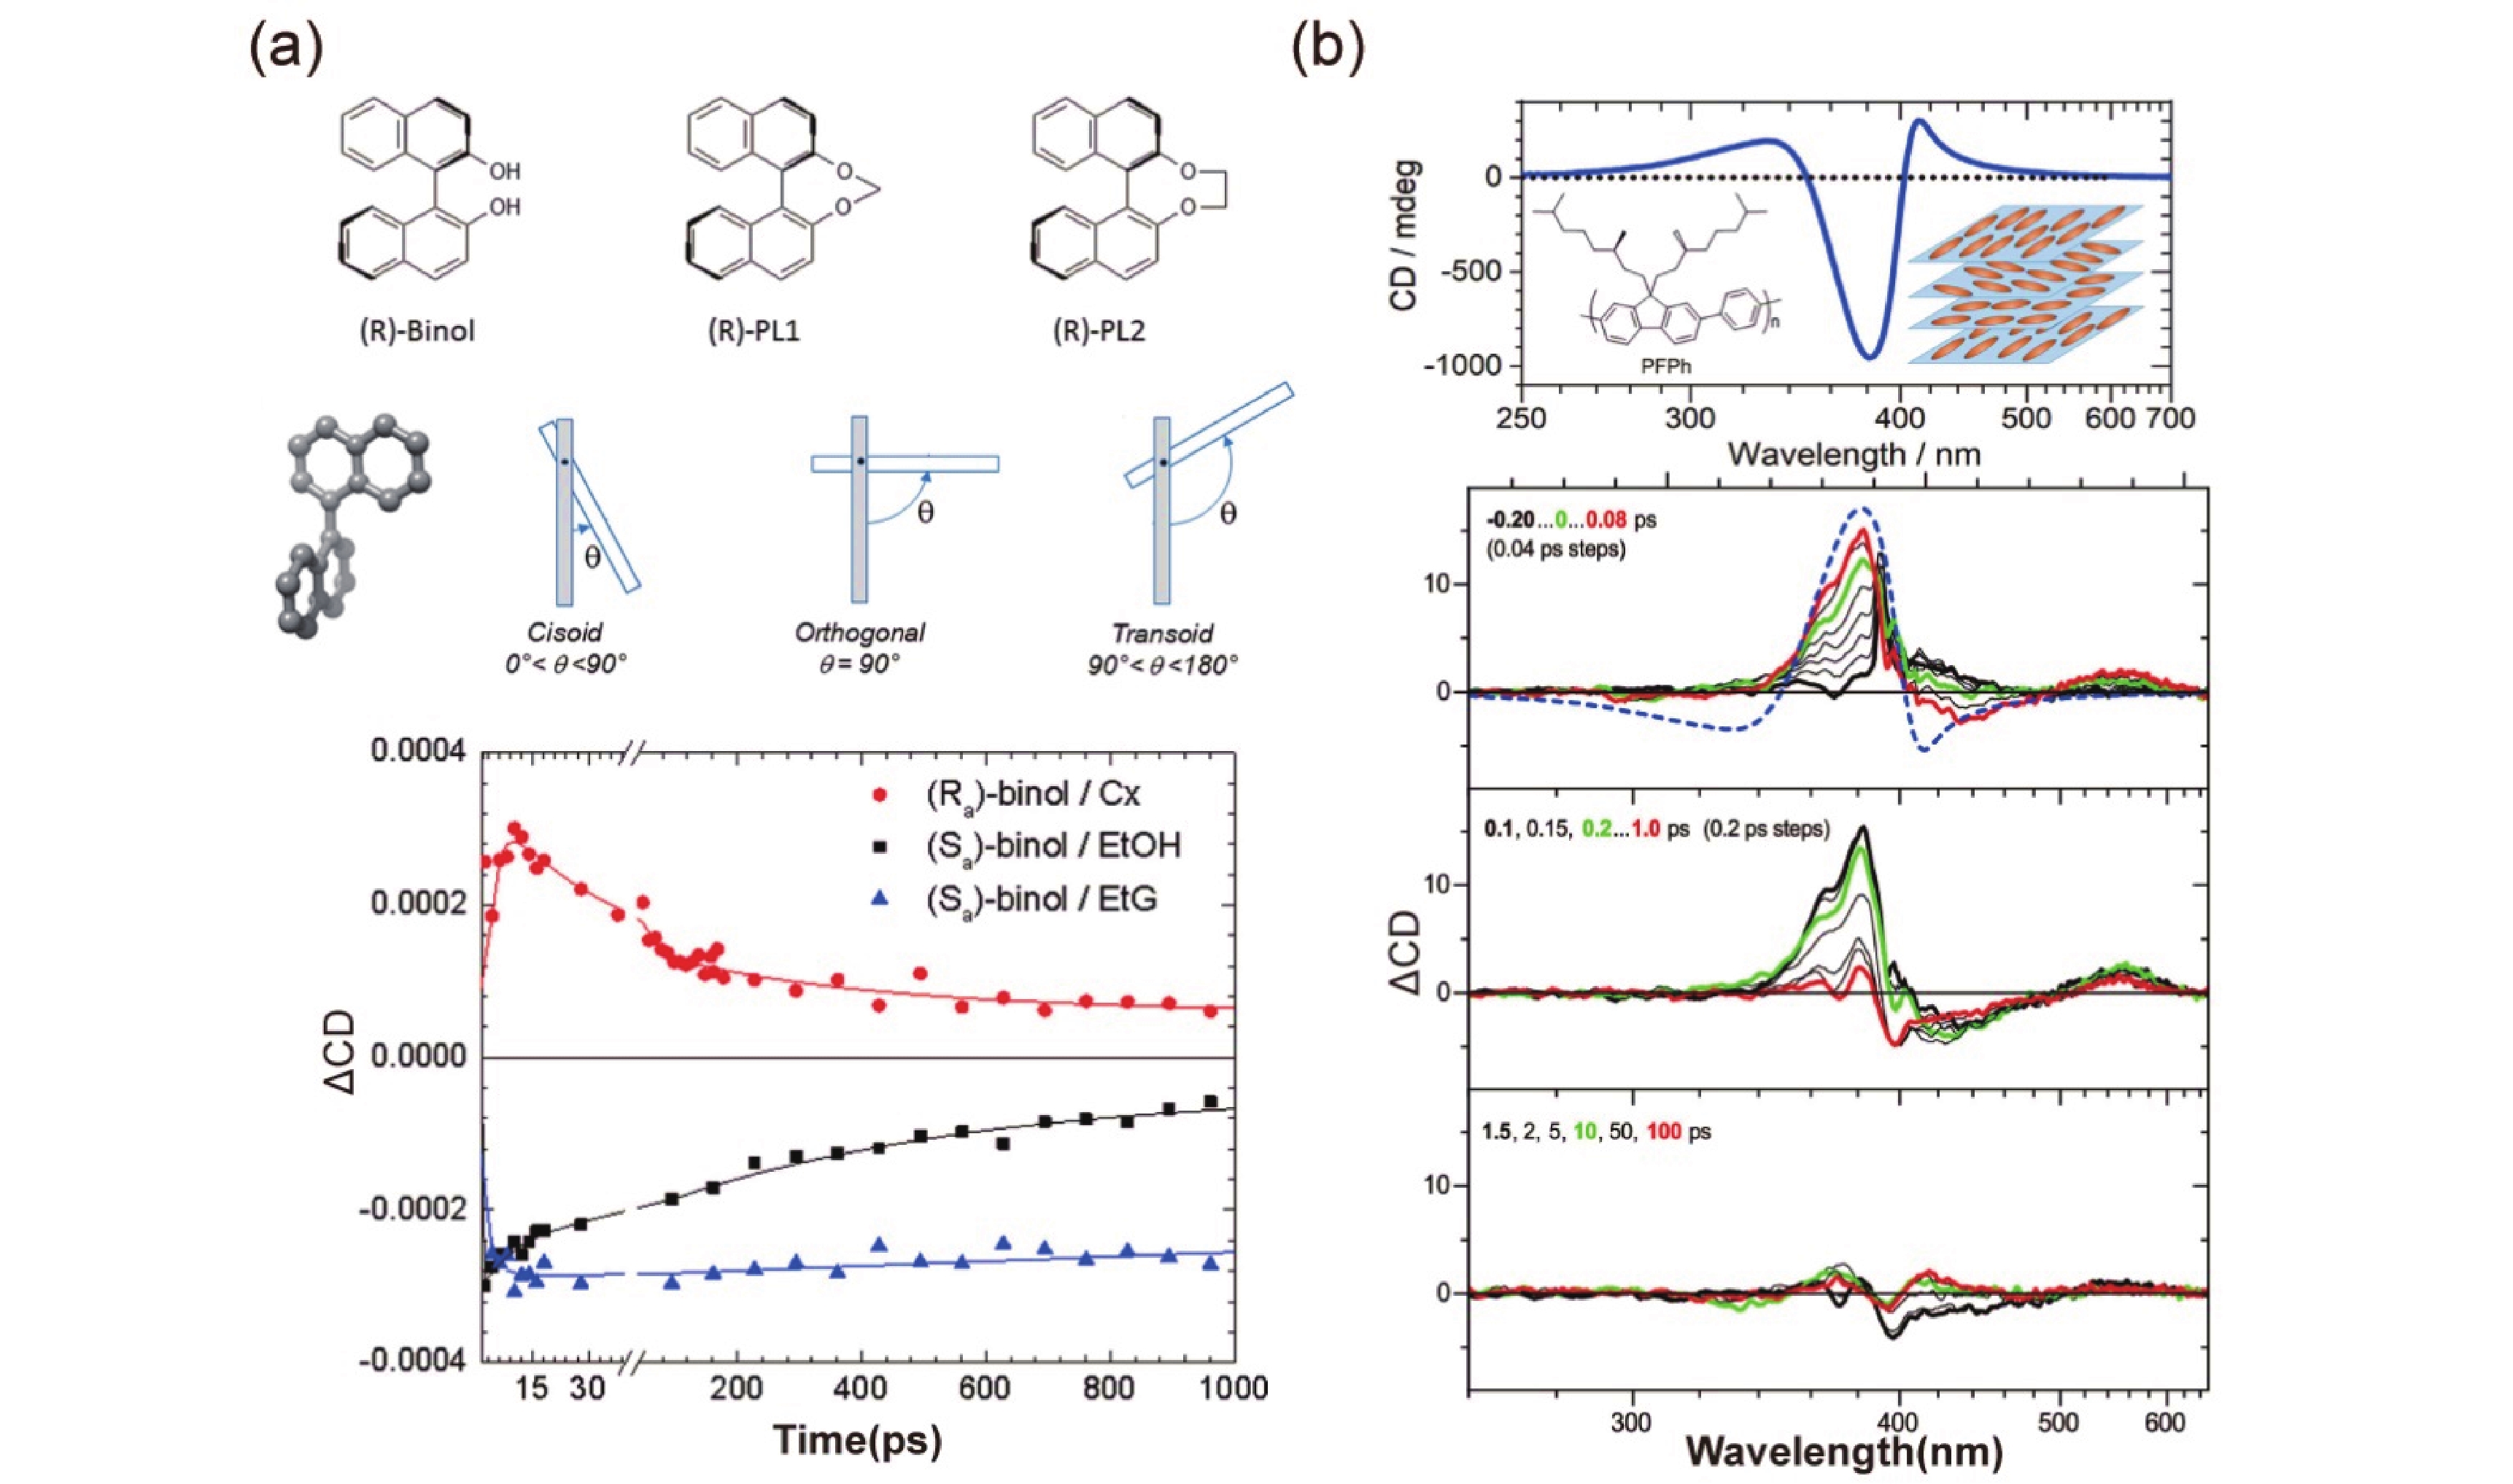
Since the exceptionally sensitivity of circular dichroism spectroscopy to molecular structure changes, TRCD spectroscopy has been increasingly utilized in recent years to elucidate structural transformations during ultrafast excited state processes. This technique allows researchers to visually identify conformational torsional changes within the excited states of molecules. In 2019, Schmid et al. showcased the application of femtosecond circular dichroism spectroscopy on axially chiral naphthalenol derivatives through ellipticity probing. They linked the observed circular dichroic signals to the dynamic alteration in the dihedral angle of naphthalene upon photoexcitation. The upper part of FIG. 4(a) shows their molecular structure torsion while the lower part exhibits their TRCD signals. The lifetimes deduced from fitting the TRCD signals were comprehensively interpreted with the aid of computational analysis. This study highlight the technique’s remarkable sensitivity to structural variations by contrasting the transient absorption and TRCD of three substances [32]. In a similar vein, in 2019, Scholz et al. monitored the TRCD signals of PFPh films using sub-picosecond TRCD alongside the transient absorption. FIG. 4(b) shows the steady-state and transient circular dichroism spectral signals of their films. The ultrafast lifetimes indicated in their TRCD signals implied an electron density redistribution upon photoexcitation, which was sensitive to changes in copolymer spacing, enabling the monitoring of changes in the chiral structure of the supramolecule [33].
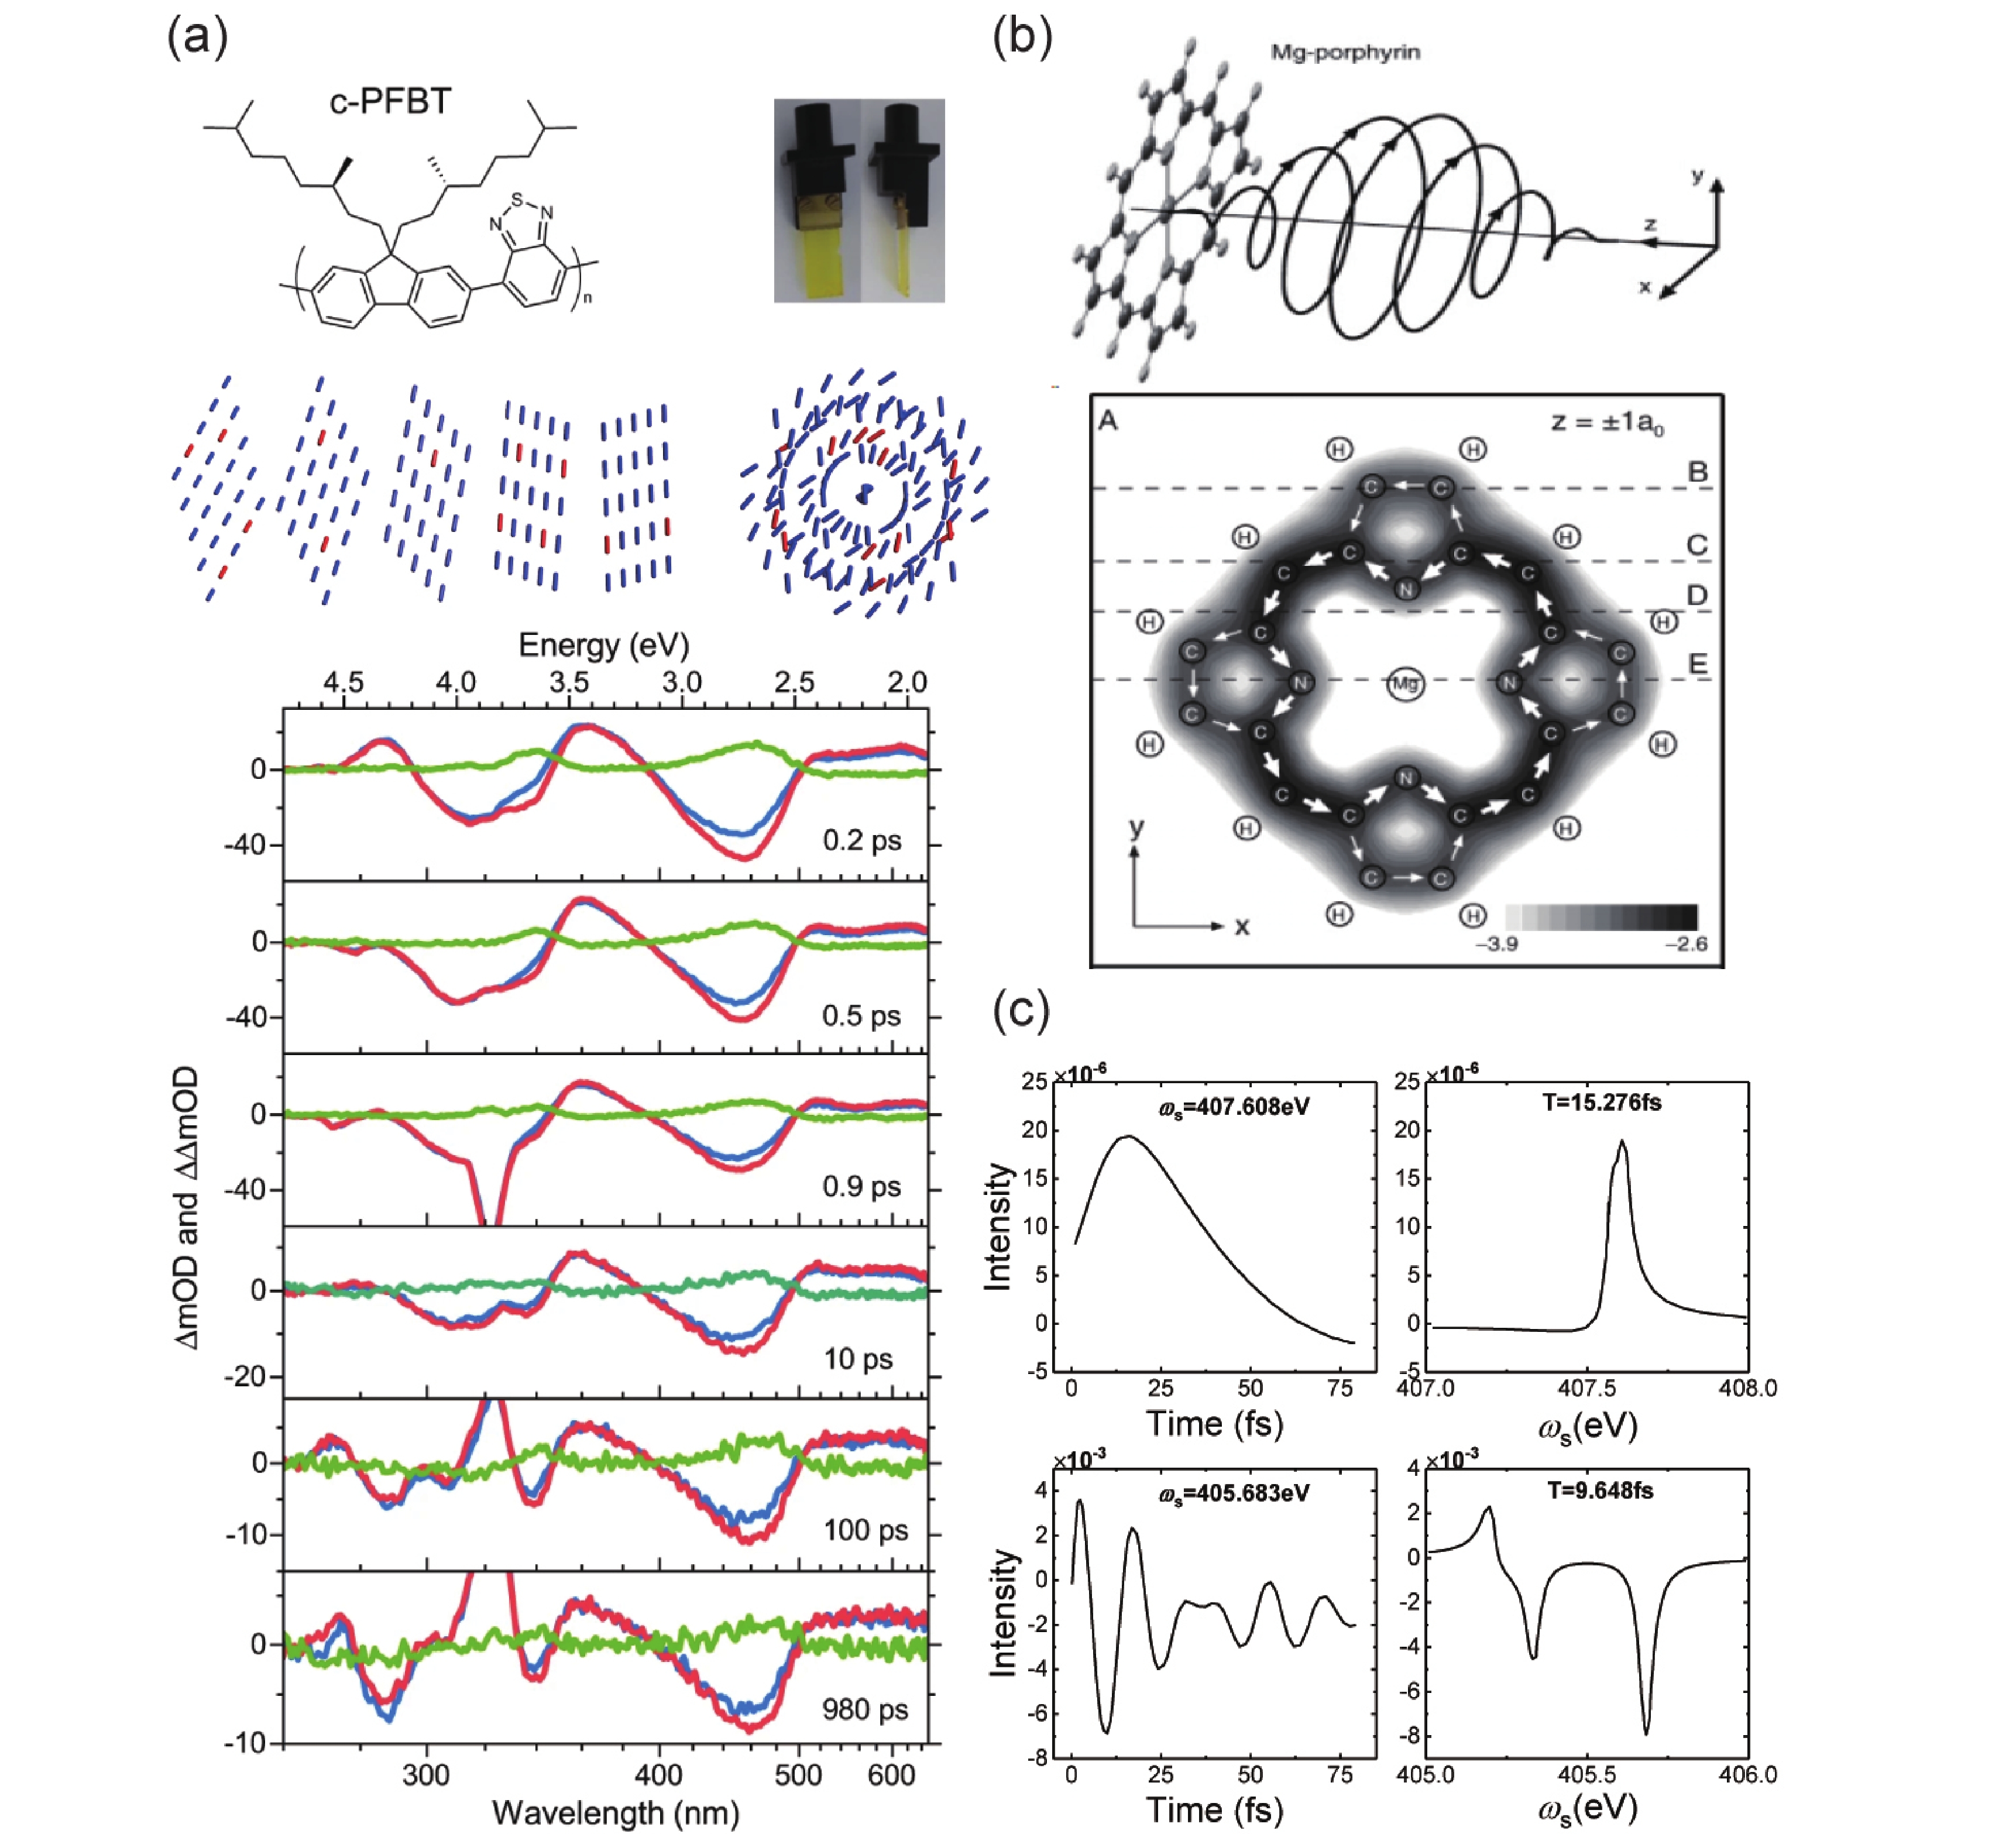
Chirality is not only associated with the molecular structure but can also be induced by excitation light. In the case of certain some supramolecular copolymers, the exact origin of the structural chirality remains a matter of debate, and the chirality induced by excitation light typically has a shorter lifetime. TRCD spectroscopy serves as an effective method for detecting the various sources of chirality. In 2022, Morgenroth et al. used TRCD spectroscopy to investigate a chiral copolymer film, c-PFBT. As FIG. 5(a) illustrates their excited state molecular helical arrangements and TRCD data, they argue that the missing excited-state absorption circular dichroism signals denied the source of chirality in the monomolecular surface and suggested an attribution to the supramolecular arrangement. Simultaneously, The absence of CD signals in the excited state also helped them distinguish the kinetic processes and establish relaxation models [34]. The phenomenon of photoinduced ring currents in planar molecules has garnered interest as a source of transient chirality. This is discussed in the theoretical studies in terms of ring current generation and its occurrence over short time scales. In 2006, Yagi et al. computed the instance of ring currents generated in porphyrin molecules under circularly polarized excitation. FIG. 5(b) shows their molecular excitation simulations and the calculation of the ring current, which was an ultrafast physical process on the order of femtoseconds [35]. In 2020, Nam et al. computationally simulated the generation of ring currents by the coherence of the electronic states in UV-pulse-induced porphyrin molecules. FIG. 5(c) exhibits the signal dynamics of circularly polarized excitation and the signal vs. probe frequency plot, with narrowband pump in the upper part and broadband pump in the lower part. Noteworthy, the signals of the attosecond X-ray TRCD spectroscopy responded directly to the lepton current densities, which has facilitated detection of open-loop and closed-loop processes in chemical reactions [36].
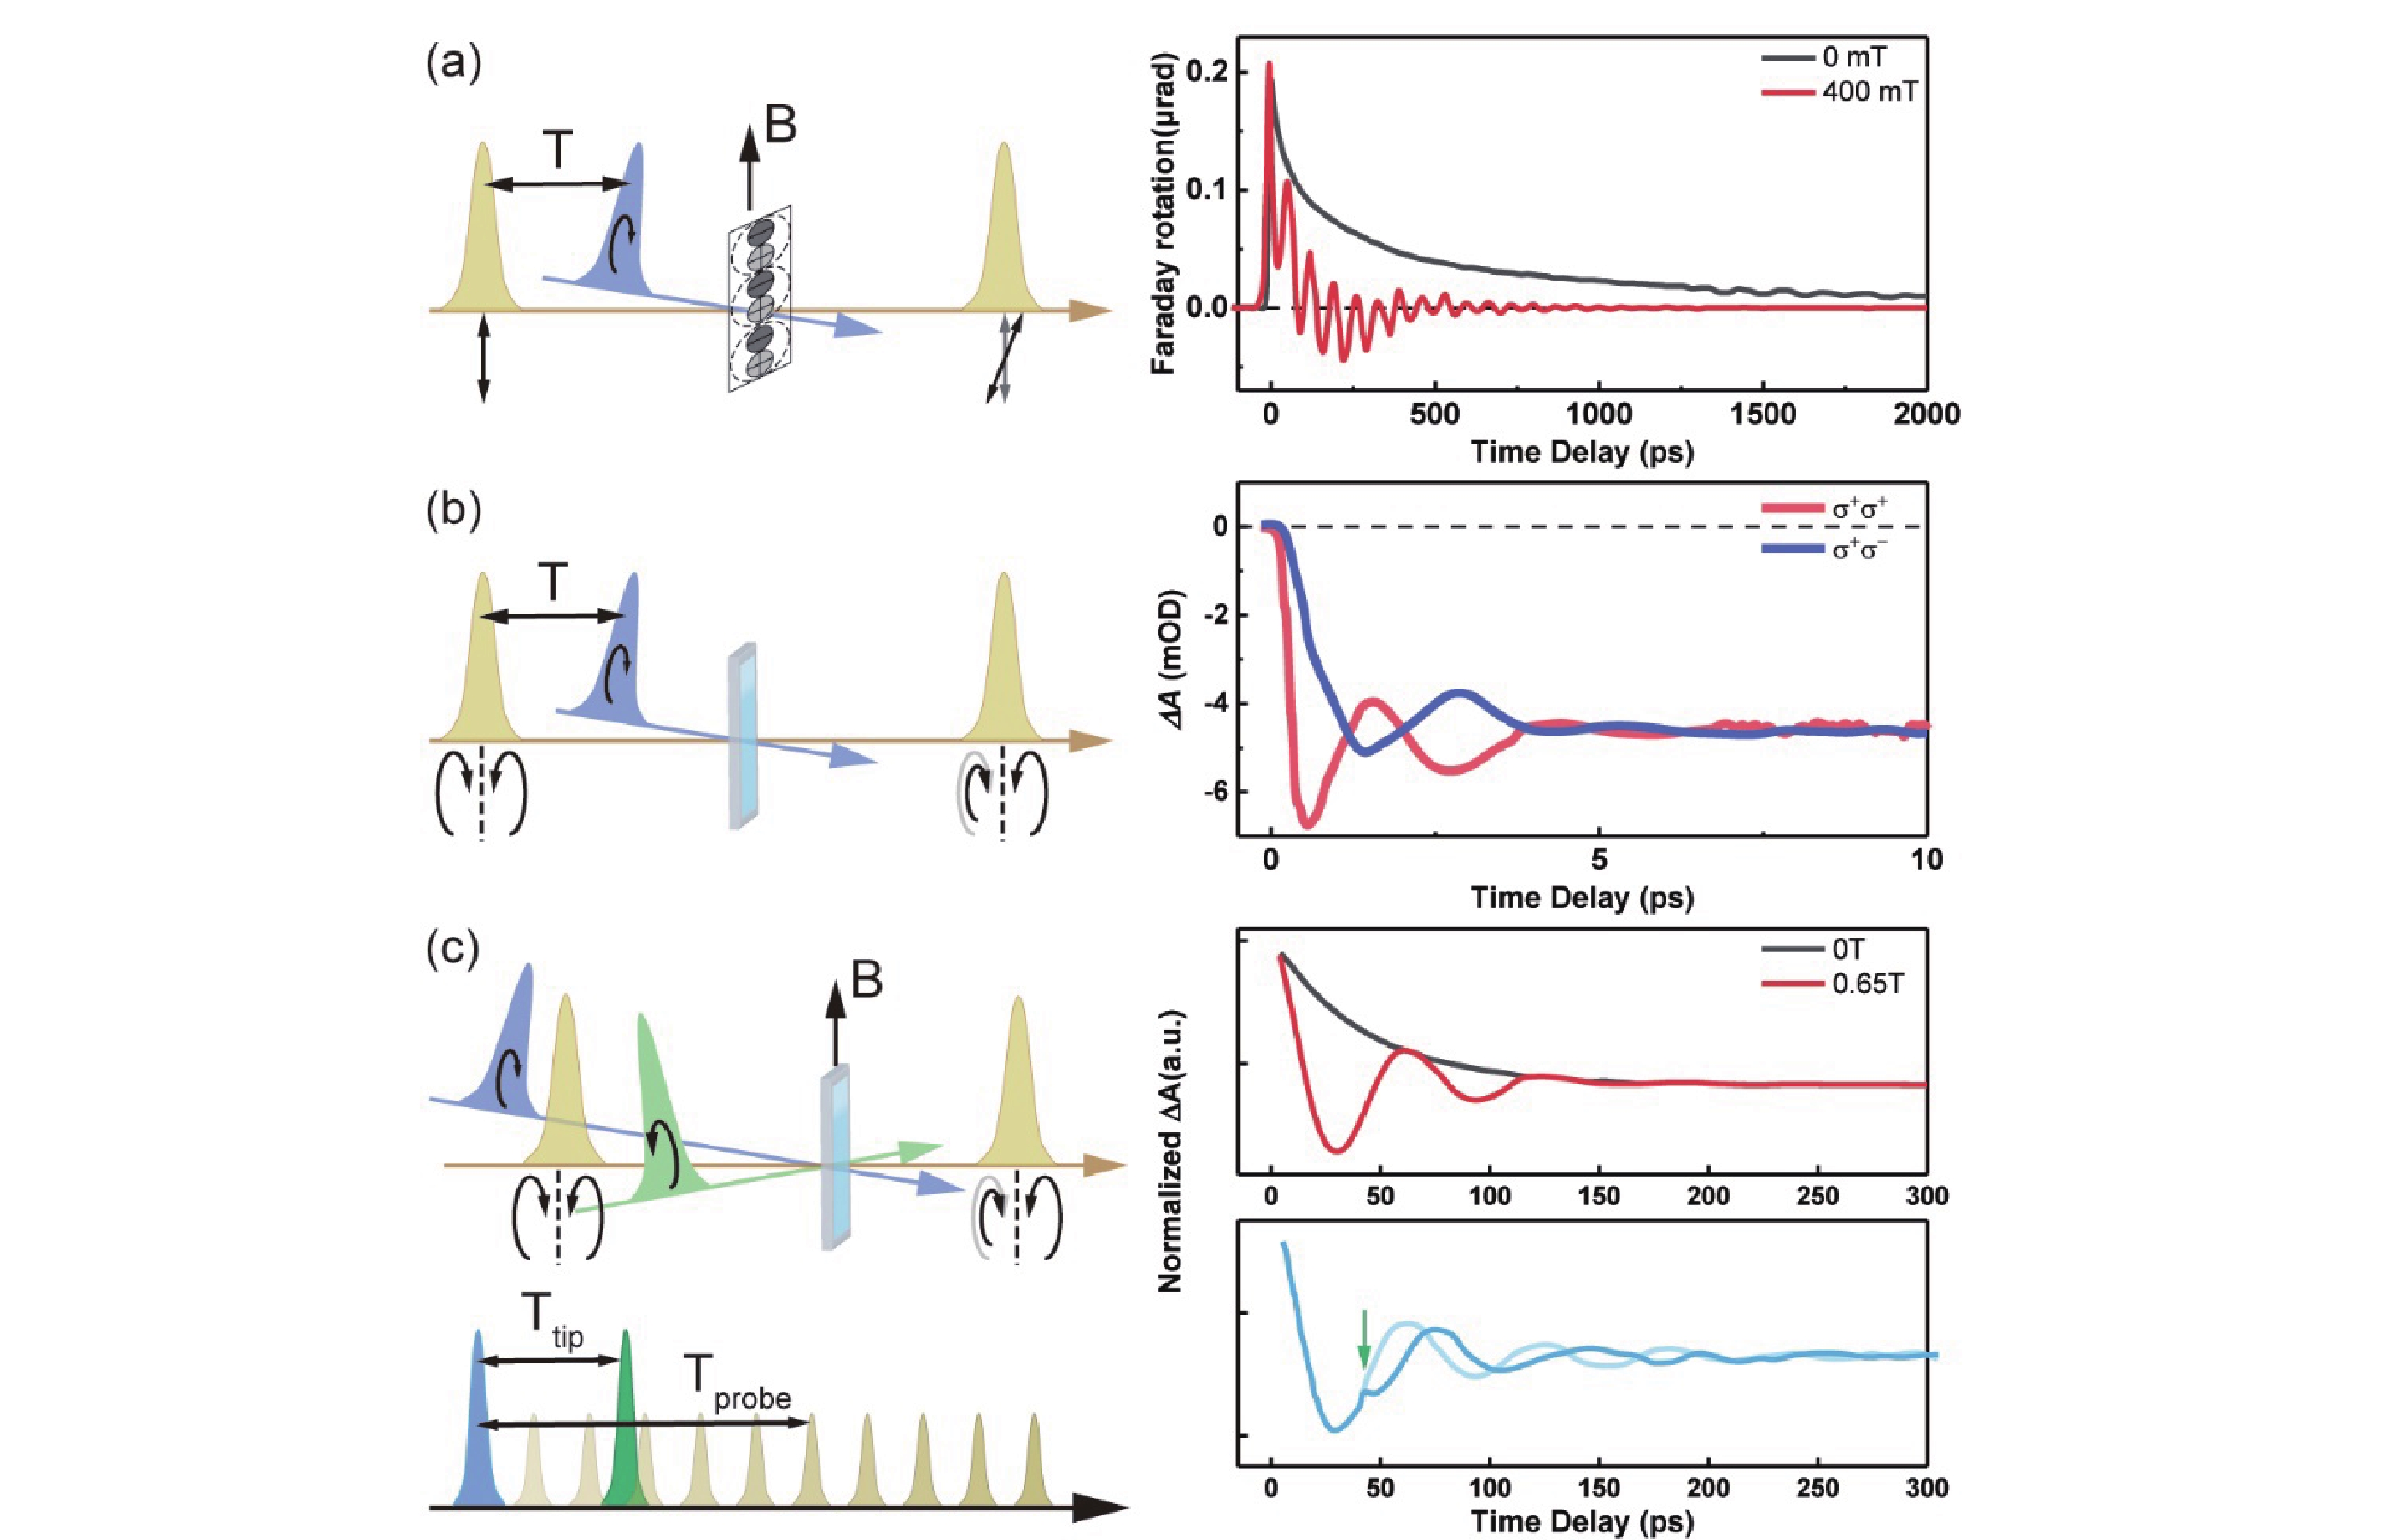
When employing circularly polarized pumping, the phenomenon of quantum beating in quantum dots can be selectively observed, demonstrating a clear response to the correlation between their energy levels and the external field, the size of the particles, and other factors. Circularly polarized pumping of polycrystalline films of organic-inorganic hybrid perovskite crystals (perovskite crystals for short) can selectively excite excitonic ground states composed of J=1/2 electrons and s=1/2 vacancies. This leads to the formation of quantum two-exciton states (N±) with imbalanced standing groups, resulting in different absorption of right circularly polarized (RCP) light and left circularly polarized (LCP) light. In this context, in 2017, Odenthal et al. investigated the quantum beating of pump-induced coherent superposition states in a transverse magnetic field using time-resolved Faraday rotation (TRFR). Their optical setup and TRFR time traces are shown in FIG. 6(a). Their analysis of the two frequencies in relation to the external field elucidated the asymmetry between the two ground states and described the physical image of their excited states [37]. Further advancing the field, Wu et al. explored quantum dots using the time-resolved circularly polarized absorption spectroscopy in 2022. They use circularly polarized pump-probe optical setup to obtain the transient absorption kinetics, which can be simply subtracted to receive the TRCD signal in 80 K, shown in FIG. 6(b). They obtained significant oscillatory signals and elucidated the fine-structure splitting of bright excitons caused by anisotropic exchange interactions. By analyzing temperature-dependent spectra through fast Fourier transform (FFT) and integrating the findings with subsequent calculations, they refined the exciton fine-structure model [38]. Subsequently, the quantum dots were modified with anthraquinone and analyzed using circularly polarized excitation spectroscopy to observe their long-lived dynamics and the ultrafast rotation induced by the spin-selective optical Stark effect by adding a tip pulse shown in FIG. 6(c). A notable mutation can be observed in the dynamics after Ttip. By synthesizing these techniques, the initialization, manipulation, and read-out of hole spins in quantum dots were successfully achieved [39].
-
This perspective paper provides a review of the advancements in TRCD spectroscopy over two decades, focusing primarily on the methodologies for detection and signal processing applicable to ultrafast scales. The field of TRCD spectroscopy continues to evolve with ongoing efforts to enhance time resolution and the signal-to-noise ratio, reflecting the substantial contributions of numerous scientists throughout its development. Its exceptional sensitivity to molecular structure renders it a powerful investigative tool for examining molecular conformational changes. Furthermore, the inclusion of polarization dimensional information offers unique insights, promising its broader application and development in the future research endeavors.
Development and Application of Ultrafast Circular Dichroism Spectroscopy Techniques
- Received Date: 23/03/2024
- Available Online: 27/08/2024
-
Key words:
- Excited state chirality /
- Femtosecond time-resolved circular dichroism spectroscopy /
- Ultrafast dynamics /
- Chiral spectra
Abstract: Chirality hold broad applications in life sciences, quantum devices, and various other areas. Traditionally, molecular chirality can be characterized by using steady-state circular dichroism spectroscopy. However, the techniques that can characterize excited state chirality are progressively capturing the public interest as it can provide the dynamic information for chirality generation and transfer. In this review, we focus on the theoretical background and the developmental history of femtosecond time-resolved circular dichroism spectroscopy (TRCD) techniques around the world. Additionally, we provide examples to showcase the utility of these techniques in the analysis of the dynamical molecular chemical structures, the investigation of molecular chirality generation, and the detection of electron spin dynamics in semiconductor quantum dots.
 DownLoad: