
 首页
首页 登录
登录 注册
注册


HTML
-
Glow discharge is widely used for generating plasma, which has various physicochemical effects.[1] It can be applied for material surface treatment (e.g., elemental doping,[2] deposition,[3] etching[4]), the design of UV light sources,[5] and in environmental, biological, and other fields.[6] The discharge characteristics of a glow discharge are closely related to the type of gas, operating pressure, and discharge structure. The classical glow discharge geometry consists of two parallel flat electrodes, and it will be ignited when a voltage of several hundred volts is applied, producing a glow plasma. A glow discharge comprises three main regions: the negative glow region, the Faraday dark region, and the positive column region.[7] However, when the gas pressure was fixed, and the electrode distance was reduced, the discharge contracted only in the positive column region, while the other regions remained almost unchanged.[8] When the value of Pd was in the range of 0.2 Torr⋅cm–0.25 Torr⋅cm (P is the pressure, and d is the characteristic size), the current density became more prominent when the size was reduced (from 16 mm to 4 mm).[9] Keeping the Pd value constant, increasing the pressure improved the glow discharge stability at the microscale.[10] When the discharge structure was reduced to a millimeter scale, the argon discharge was unstable and inhomogeneous in the negative glow region compared to nitrogen and helium discharges.[11] The cathode sheath became indistinguishable at the micrometer scale, with a thickness of less than 10 μm.[12]
Based on the different aspect ratios (L/d, where L and d are the length and diameter of the hollow electrode, respectively), glow discharge with a hollow structure can be divided into boundary layer discharge with a small aspect ratio (L/d < 1) and micro-hollow glow discharge with a large aspect ratio (L/d > 1). The pattern in the negative glow region of the boundary layer discharge changed with current variations.[13,14] For a boundary layer discharge with a diameter of several hundred micrometers, when the aspect ratio is less than 1, and Pd exceeds 5 Torr⋅cm, the electron energy accelerated in the sheath can exceed 100 eV, and a large number of 15-eV electrons are present.[15] In contrast, the large aspect ratio micro-hollow cathode discharge exhibited better thermal stability, which helped confine the plasma within the cavity and produced a larger current.[16–18] The hollow cathode effect explains why hollow cathode discharges can generate large currents.[19] It has been shown that the anode had a secondary effect on the hollow cathode effect.[15] However, when the cathode and anode voltages are reversed to form a hollow anode glow discharge, the cathode area becomes smaller than that of a hollow cathode discharge, resulting in a smaller discharge current, but the current density is higher.
Some experimental studies have been conducted on hollow structure glow discharge. The hollow anode glow discharge was a fast electron collector, as only fast electrons could reach the anode wall.[20] Gershman and Raitses investigated hollow anode glow discharges with 1-mm electrode spacing, 1-mm anode diameter, and 3-mm length. They found that fast electrons with energies exceeding 15 eV could be detected at the anode outlet at 3 Torr and 800 V. They concluded that the hollow anode acted as an electron energy filter.[21] However, these experiments did not address the influence of the anode structure on electron motion or the energy loss during electron motion. Additionally, the global model,[22,23] the fluid model,[24] and the kinetic model[25] (dominated by the implicit PIC/MCC algorithm) can be used for computational studies. Berkane used COMSOL to simulate argon discharge in a micro-hollow cathode.[26] Kim used a two-dimensional (2D) PIC/MCC model to simulate micrometer-scale hollow cathode discharges and demonstrated that the EEPF with a plateau in the electron energy range of 5 eV–10 eV. He concluded that the discharge structure is responsible for the existence of the plateau.[27] Dmitry Levko conducted a computational analysis of a micro-hollow anode glow discharge (computational domain 5 mm×3.5 mm) using a 2D PIC/MCC model. The model applied a 400-V negative bias at the cathode and examined the electron velocity distribution at the anode outlet for two gases (N2 and CO2). It was observed that fewer fast electrons (> 100 eV) were present at the anode outlet, with fast electrons consuming most of the energy in the plasma region. He concluded that to generate more fast electrons, either the anode length should be reduced or a higher voltage should be applied.[28] However, this study also failed to analyze the effect of the anode structure on electron motion.
This paper used a kinetic model with a 2D direct electrostatic implicit parallel PIC/MCC (PPIC) code to study glow discharge within a millimeter-scale hollow anode. In low-pressure discharges or microdischarges, the distribution of electrons usually deviates from the Maxwellian. The kinetic model can be used for kinetic studies and to analyze the distribution function of each charged particle. The implicit algorithm can set a larger time step and achieve better numerical stability than the explicit algorithm under the same spatial grid scale. Due to the large computational scale, PPIC was parallelized by MPI, which can effectively reduce the computation time. The correctness of this code has been verified.[29–32] Hollow structures of varying lengths exhibit different discharge characteristics, including potential and plasma density distribution differences, which affect the electron motion process in the anode. In this study, two hollow anode structures with different lengths are selected.
The paper is organized as follows: The second section presents the computational model for two hollow anodes of different lengths, along with the parameter settings of the model, such as electrode material, potential, and secondary electron emission coefficient (an important factor for maintaining the discharge). The third section discusses the results, including potential, plasma density, and electron flux, and analyzes the effect of anode length on discharge characteristics and electron motion. The fourth section provides conclusions.
-
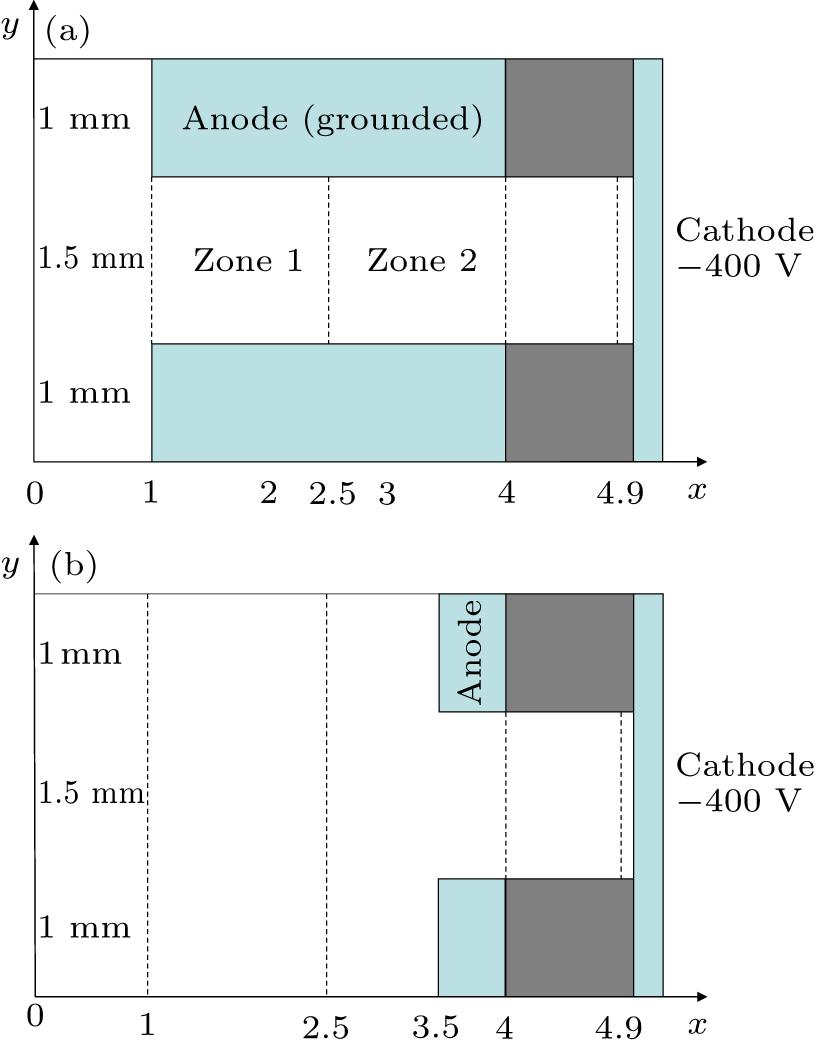
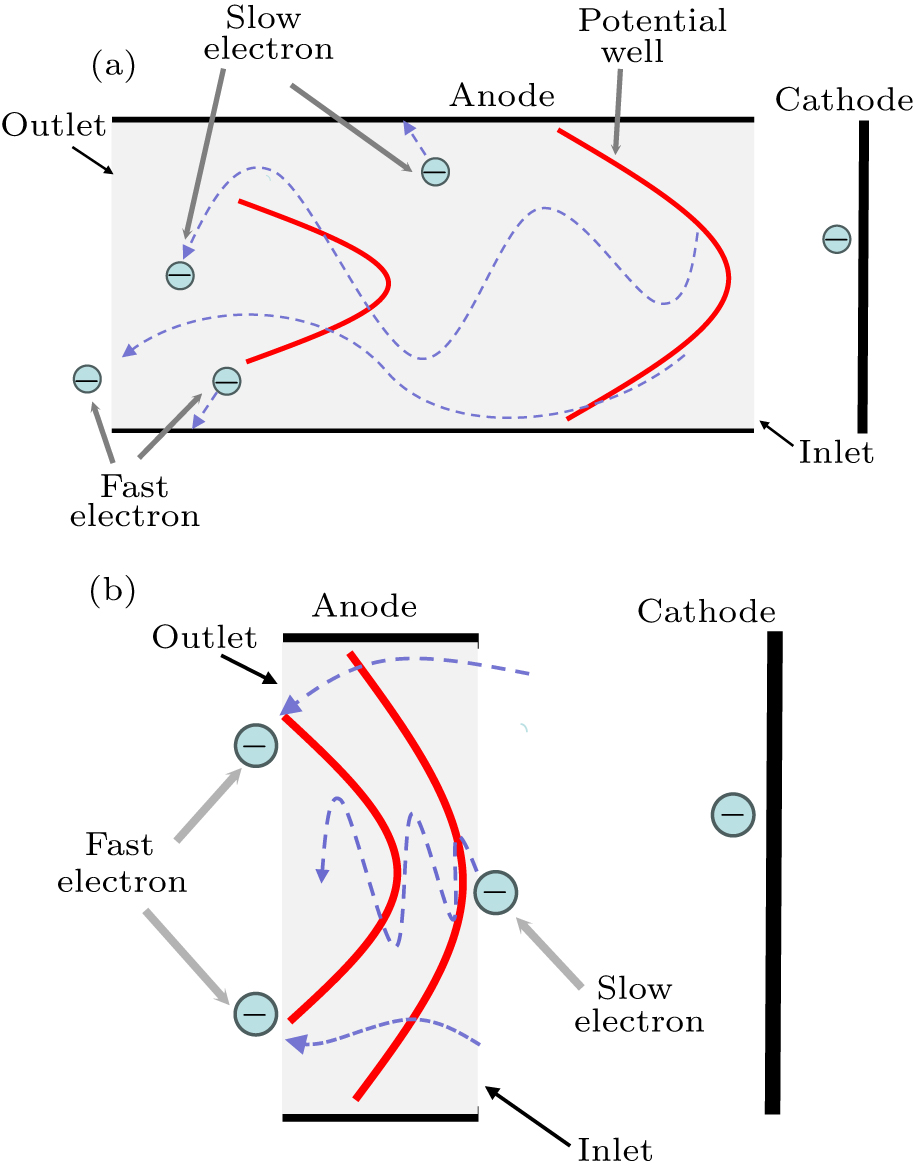
Generally, a three-dimensional (3D) computational model is more suitable for simulating glow discharges in a hollow anode structure; however, it requires much computation. Reducing it to a 2D model effectively reduces computational effort while retaining key details of the discharge process, such as secondary electron emission, electron avalanche, Monte Carlo collision, sheath formation, etc. The two computational models are shown in Fig. 1. A 2D Cartesian coordinate system is established in this model. The computational domain is 3.5 mm×5 mm. The anode is a hollow structure with 3-mm and 0.5-mm lengths, respectively. The cathode is vertically placed on the right side with a length of 3.5 mm. The insulating medium is located between the cathode and anode electrodes with lengths and widths of 1 mm. The anode and cathode electrodes are made of copper. The anode is grounded, and a negative bias of 400 V is applied to the cathode. The linear variation of the boundary potential in the insulating medium region coincides with the periphery of the computational domain, and the dielectric constant is 3. Zone 1 and zone 2 in the computational domain of the long anode are selected for the calculation of the electron energy distribution functions. In the computational domain, four typical positions (x = 1 mm, 2.5 mm, 4 mm, 4.9 mm) in the center, inlet, and outlet of the long anode and near the cathode are selected to detect the electron flux. For easy comparison, the same positions are selected for the short anode.
In numerical calculations, to resolve the sheath and electron plasma frequency, the spatial and temporal steps must satisfy Δx < λD and Δt < Δx/vth, respectively. In our simulations, the plasma density is less than 1018 m−3, and the electron temperature near the cathode is about 2 eV, the corresponding electron thermal velocity is vth = 8.38 × 10⁵ m/s. The Debye length is λD = 10.3 μm. We set Δx = 10 μm to ensure Δx < λD. Given Δx/vth = 11.9 ps, we choose Δt = 2 ps to satisfy Δt < Δx/vth. Electrons travel only a small fraction of their mean free path during the time step and the Courant condition is also satisfied. The entire computational domain is divided into 350×500 grids with more than 1000 particles per spatial grid, and the number of particles involved in the computation is more than 108. The working gas is argon with a density of ng = 6.669 × 10²² m−3 and a pressure of 2 Torr.
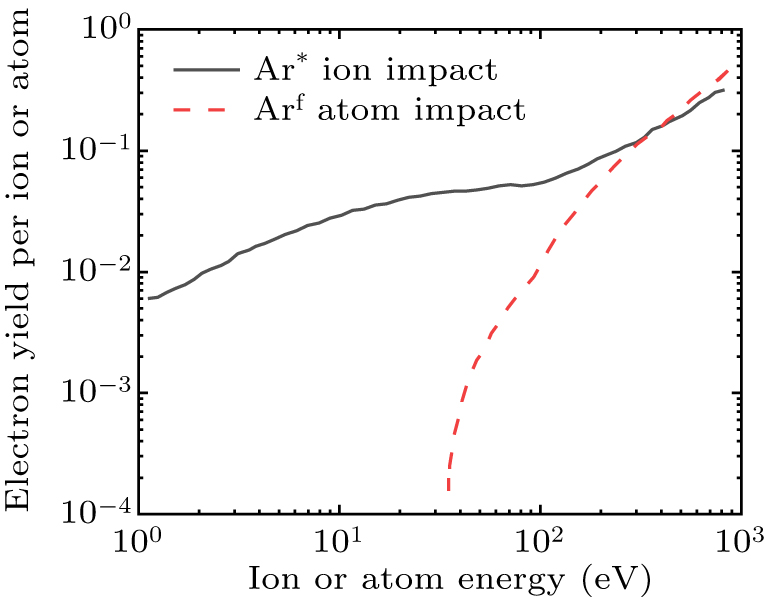
In glow discharge experiments, free electrons provide the initial conditions for the discharge.[33,34] Similarly, in numerical simulations, an initial distribution of plasma must be established in the spatial domain at the starting time to initiate the discharge process. The initial plasma density setting only affects the time required for the discharge to stabilize. Our simulations set uniformly distributed initial plasma (ne = 1.0 × 10¹⁷ m−3) as the initial condition to activate the discharge, allowing it to reach a stable state more quickly. The ions between the electrodes move toward the cathode under the attraction of the electric field and hit the surface of the cathode, generating secondary electrons. The secondary electrons are accelerated by the electric field and collide with the argon atoms to produce electron–ion pairs after gaining sufficient energy. The electric field repels the electrons and moves downstream of the discharge. The ions repeat the above process, and finally, the discharge is stabilized. The secondary electrons are essential to maintain the discharge. The true secondary emission generated by the electron bombardment of the electrode’s surface was turned off, and only the emission of secondary electrons emitted by the cathode surface that completely absorbs the bombarded ions was considered. Based on the potential difference between the electrodes, the ions achieve a maximum energy of 400 eV upon striking the cathode surface. Figure 2 gives the data of secondary electron emission coefficient of Ar ion striking on copper metal surface.[35] The emission coefficient is set to 0.21. The Monte Carlo collision part of the code involves elastic collisions, ionization reactions, and excitation reactions between electrons and argon atoms, and elastic collisions and charge exchange between ions and argon atoms.
-
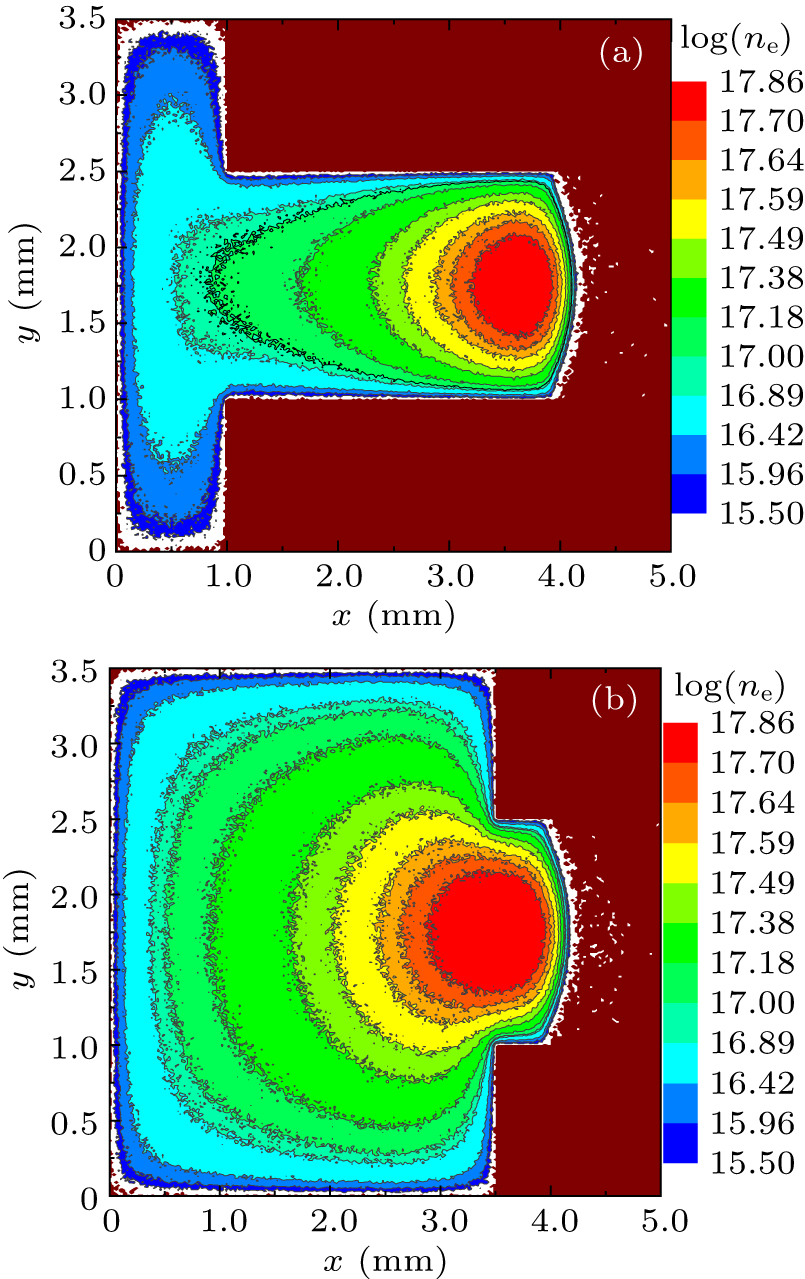
Figure 3 illustrates the 2D electron density distributions for long and short anode calculation domains. The electron density is highest at the inlet of the anode channel and gradually decreases downstream and toward the wall, with only a very small number of electrons present in the electrode gap. The density at the outlet of the short anode is higher than that of the long anode. These observations indicate that, as the discharge progresses, a longer anode results in greater electron consumption.
A comparison of the plasma density variation in the x-direction of the long and short anode channels is plotted in Fig. 4. Between the cathode and anode, the plasma density profile for the short and long anodes almost coincides. The ion temperature is set to 0.025 eV in the simulations, while the electron temperature is much higher than the ions. Electrons, having considerably higher thermal speeds than ions, move quickly toward the wall and are absorbed, resulting in charge separation in the electrode gap. The sheath is formed when the electron flow and ion flux balance and its thickness closely approximates to the electrode spacing. The electric field in the sheath repels electrons and attracts ions to the cathode, leaving the ion density much larger than the electron density in the sheath. The electron and ion densities in the anode channel are nearly equal, maintaining plasma quasi-neutrality. In this coordinate system, the logarithmic density decreases linearly toward the left boundary, with a sharper decline in the long anode. At x = 1.0 mm, the density in the short anode is approximately three times higher than at the outlet of the long anode. Additionally, the density at the short anode’s outlet (x = 3.5 mm) exceeds that of the long anode’s outlet. As the anode length increases, more plasma is absorbed, leading to a progressive density reduction towards the left boundary in the long anode. These findings demonstrate that shortening the anode effectively increases plasma density at the outlet while reducing plasma consumption within the anode channel.
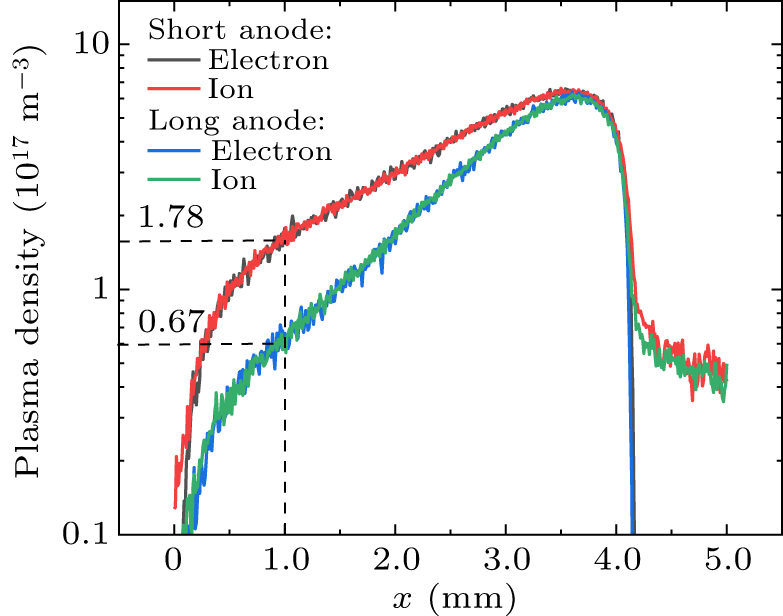
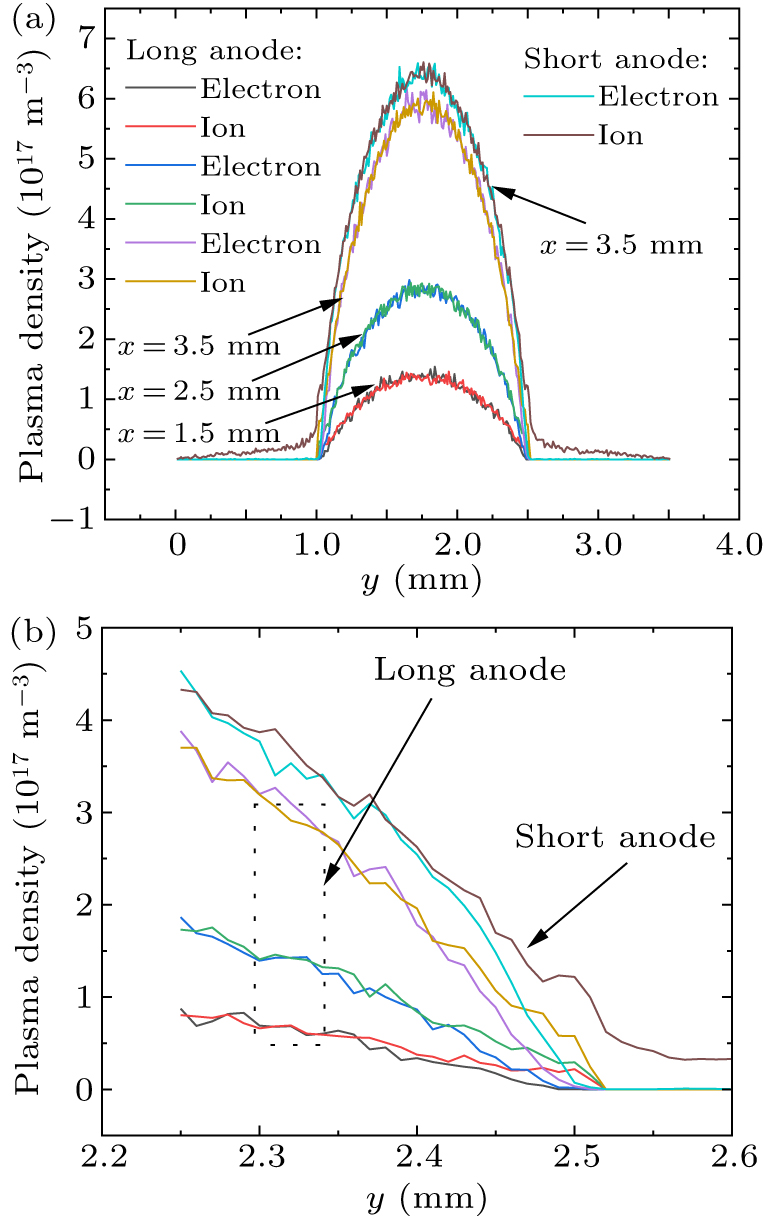
Figure 5 compares the y-direction variation of plasma density inside the anode channels. Positions x = 1.5 mm, 2.5 mm, and 3.5 mm are located inside the long anode channel, whereas only x = 3.5 mm is within the short anode. Figure 5 shows that at x = 3.5 mm, the plasma density in the short anode channel is slightly higher than in the long anode, a distinction not easily observed in Fig. 4. As the position approaches the outlet, the plasma density in the long anode channel gradually decreases. At the outlet, the plasma density in the short anode channel is at least six times that of the long anode. In the y-direction, the plasma density exhibits a parabolic distribution. In Fig. 5(b), near y = 1.0 mm and y = 2.5 mm, the ion density near the anode wall surpasses the electron density, indicating charge separation and the formation of an anode sheath. The charge separation is more pronounced on the short anode wall in Fig. 5(b), making the net charge significantly larger suggesting a greater potential difference in the sheath. The maximum plasma density occurs at y = 1.75 mm, primarily due to particle absorption by the anode, which results in lower density near the walls and higher density in the channel center. Additionally, the electric field in the sheath repels electrons, causing them to accumulate in the middle of the channel. This repulsive effect is stronger in the short anode due to its greater sheath potential difference, leading to a higher density at x = 3.5 mm. This demonstrates the collimating effect of the hollow anode structure on electrons. Elsewhere in the channel, electron and ion densities are nearly equal, maintaining quasi-neutral plasma.
-
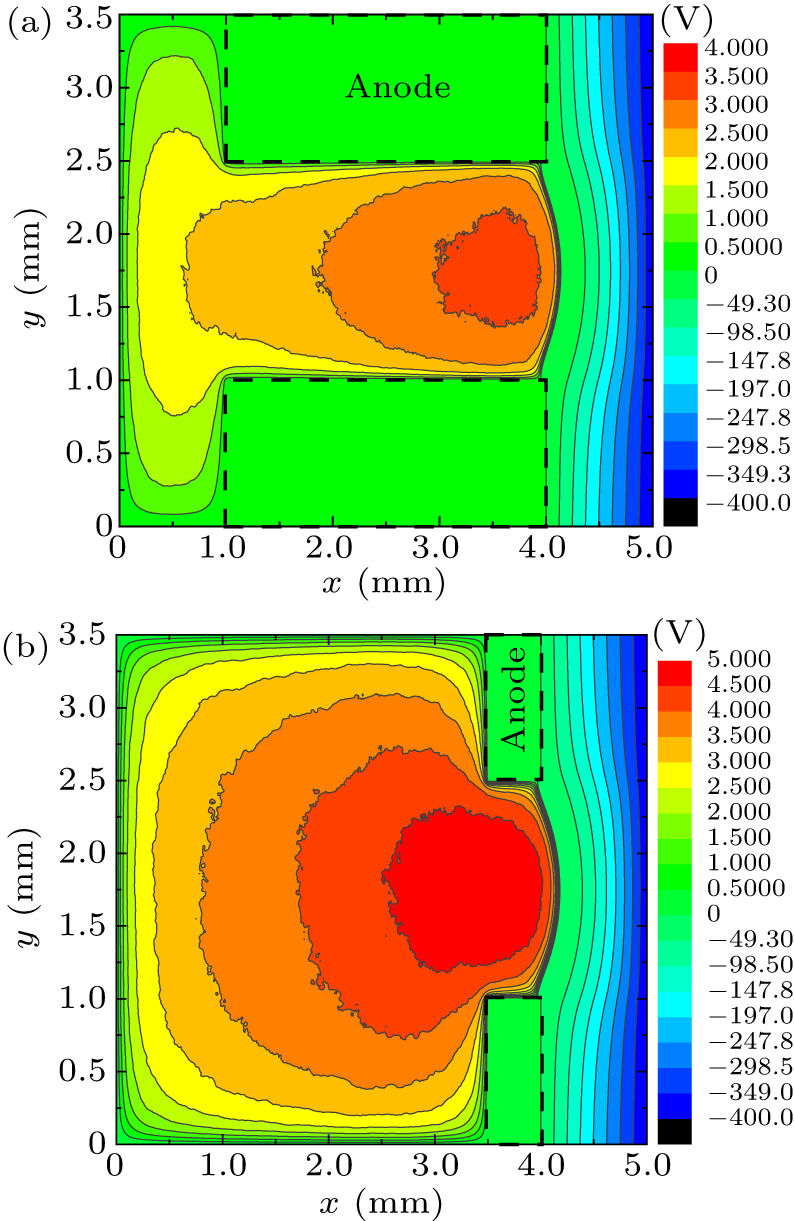
Figure 6 shows the 2D potential distributions for the long and short anode computational domains. The maximum potential occurs at the anode inlet and gradually decreases downstream and toward the wall, with a significant potential fall across the electrode gap. In long anode channels, the equipotential lines gradually bulge outward, whereas in short anodes, the equipotential lines change more uniformly.
The schematics of the potential variations versus the x-direction position are shown in Fig. 7. Secondary electrons are accelerated by the sheath electric field, transferring energy from the electric field to the electrons, resulting in a 400-V potential drop across the sheath of the electrode gap, equal to the applied voltage. The potential inside the channel decreases almost linearly along the outlet direction, while the potential outside the outlet decreases towards the boundary direction to 0 V. The inlet of the long and short anode channels exhibits potential peaks of 3.2 V and 4.9 V, respectively. The corresponding potential differences relative to the potential at x = 1 mm are 1.2 V and 0.8 V. The electric field is directed from the anode outlet towards the inlet. These results indicate that shortening the anode increases the potential peak within the channel.
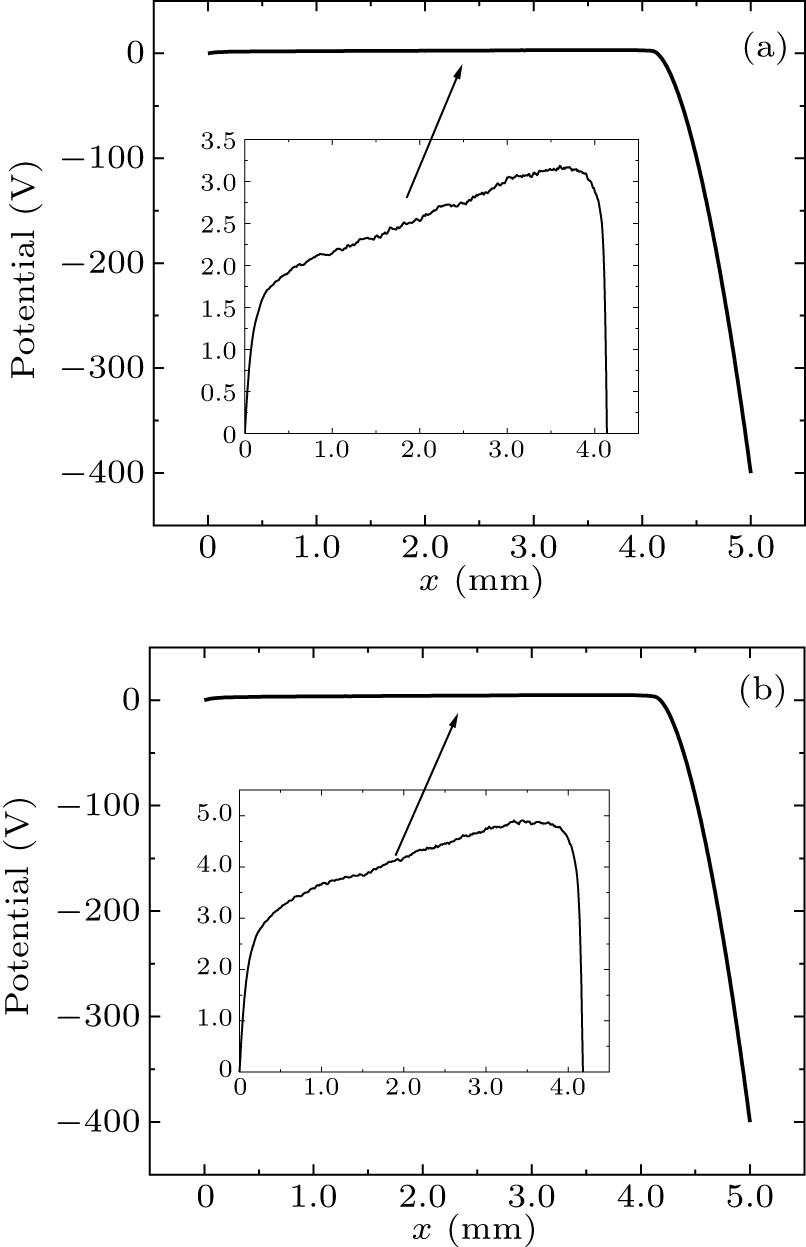
Figure 8 shows the comparison of y-direction potential variations inside the anode channels, providing further evidence that shortening the anode increases the potential peak in the channel. At x = 3.5 mm, the potential peak in the short anode channel is significantly higher than that in the long anode channel. The potential is symmetrically distributed in the y-direction, with the peak appearing at the center of the channel and rapidly decreasing toward the anode wall. The potential peak in the channel, combined with the grounded anode, forms a potential well in the xdirection, where the electric field points from inside the well toward the anode wall. This field exerts an force on electrons, guiding them toward the center of the channel. Since the potential well in the short anode has a higher energy, it exerts a stronger force on electrons.
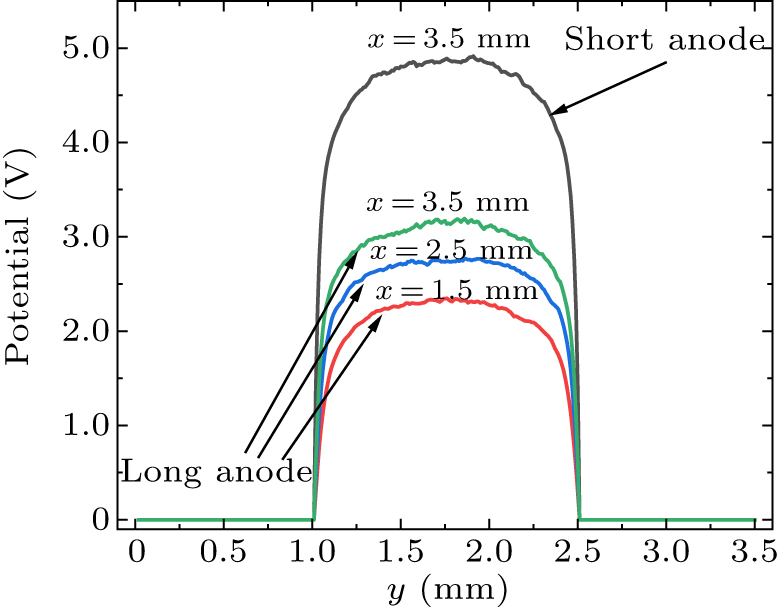
Figure 9 shows the possible trajectories of electrons inside the anode channel. While the potential well attracts electrons toward the inside of the channel, its effect varies depending on electron energy. Low-energy electrons with energies lower than the potential well are mostly confined within the y-direction of the channel, accumulating inside. Only those near the wall are directly absorbed. High-energy electrons with energies exceeding the potential well either undergo collisions: losing energy and becoming low-energy electrons, or escape the well and are absorbed by the walls. A small fraction of high-energy electrons, which do not undergo collisions, are influenced by the electric field of the potential well and are redirected toward the channel, eventually exiting through the outlet. Different anode lengths create potential wells of varying energy, affecting electrons across different energy ranges. This analysis of electron motion further elucidates the collimating effect of the hollow anode structure.
Theoretically, according to the Boltzmann’s relation for electrons
where n0 is the reference density, and Te is the electron temperature. Deform the relation to obtain
Once the discharge has stabilized, the spatial variation of the electron temperature is assumed to be small. Differentiating the above equation gives
The region x = 1 mm–3 mm within the anode channel was selected for calculating the electron temperature, yielding Te = 0.50 eV.
The effective temperature of non-thermal equilibrium electrons is given as[36]
where ε is the electron energy and g(ε) is the energy distribution function.
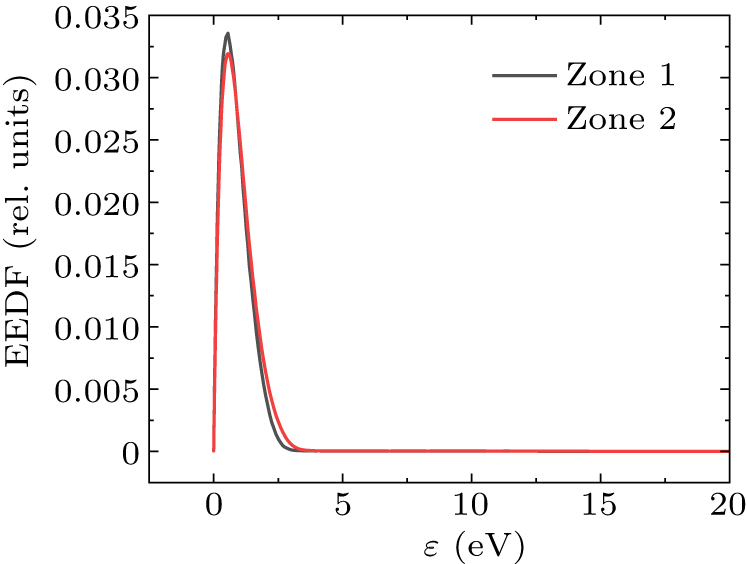
Figure 10 shows the electron energy distribution functions in zone 1 and zone 2 (see Fig. 1(a)) within the anode channel (with very few high-energy electrons), giving the effective temperatures of electrons in zone 1 and zone 2, Teff–1 = 0.59 eV and Teff–2 = 0.65 eV, respectively. Te and Teff are in good agreement. The presence of very few high-energy electrons and some moderate-velocity electrons (see Subsection 3.3) in the channel result in a small deviation between Te and Teff. As the zone moves closer to the outlet, these electrons are depleted, and then electrons approach thermal equilibrium. Consequently, Teff–1 is closer to Te than Teff–2.
In terms of basic discharge characteristics, above results are very close to those of Ref. [28]. For instance, the two-dimensional electron density distribution presented in Fig. 3 of this paper is very close to Figs. 3 and 4 of Ref. [28]. Additionally, the sheath thickness at the cathode-under the same cathode voltage of −400 V — is nearly identical in both studies (1 mm). The x-direction axial distribution of the potential in Fig. 7 of this paper also shows strong similarities to Fig. 5(b) in Ref. [28]. We observed that the logarithmic electron density exhibits a linear decay toward the left boundary, a detail not noted in Ref. [28]. Despite the use of different gases in our numerical simulations, these results reveal a pronounced similarity in the micro-discharge characteristics observed across both studies, underscoring the consistency of the underlying physical mechanisms. This study further focuses on the potential structure in the channel and its impact on the behavior of electrons. With this motivation, the subsequent sections of this paper explore how the potential structure within the channel influences the flux of electrons across different energy ranges.
-
Figure 11 illustrates the dependence of electron flux on total kinetic energy for four x-direction positions. The positions x = 1 mm and x = 3.5 mm represent the long and short anode outlet, respectively, x = 2.5 mm is inside the long anode channel but outside the short anode channel, x = 4 mm is at the anode inlet, and x = 4.9 mm is near the cathode. Referring to data on the interaction of electrons with argon atoms, the threshold energy for collisions that cause energy loss is approximately 12 eV.[37] Based on the potential well energy (approximately 5 eV), electrons are categorized into high-energy electrons — comprising fast electrons (> 12 eV) and moderate-velocity electrons (5 eV–12 eV) — and low-energy electrons (slow electrons, < 5 eV) in this paper. It is evident that the flux distribution in both the long and short anodes deviates from the Maxwellian distribution, and the trends at corresponding positions are similar (Figure 12 more clearly shows the part below 20 eV). Low-energy electrons are generated through the continuous ionization of argon atoms by fast electrons and are confined within the anode channel by the potential well and x-direction electric field. They dominate at all positions except at x = 4.9 mm. As electron energy increases, the electron flux decreases s significantly. Within the energy range of approximately 5 eV–12 eV, the flux distribution exhibits a plateau, where the flux remains nearly constant. Initially, the electron flux decreases with increasing energy; however, at this specific range, it undergoes a sudden change. This distinct feature in the flux distribution is referred to as the enhanced high-energy tail. When the energy exceeds approximately 12 eV, a portion of the electrons undergo excitation and ionization reactions with argon atoms, leading to energy loss and the generation of low-energy electrons, while others are directly absorbed by the anode. These two processes together gradually deplete the high-energy electron population. The flux distribution at x = 4.9 mm differs significantly from that at other positions, with electrons almost exclusively moving toward the outlet and 80-eV electrons predominating. At x = 4.9 mm, the electric potential is −320 V (Fig. 7). Theoretically, electrons emitted from the cathode should have gained 80 eV of energy by the time they reach this position. However, the actual electron energy ranges from 20 eV to 90 eV. Before reaching this position, most electrons lose energy in collisions, resulting in energies below 80 eV. The authors in Ref. [38] statesd that some electrons emitted from the cathode surface already possess energy. A few of these electrons may reach this position without colliding, thus retaining energies greater than 80 eV. The dominant 80-eV electrons are those emitted from the cathode surface without initial energy. This fraction of electrons has a mean free path greater than 0.1 mm, does not undergo collisions, and reaches the position without energy loss. This subset of electrons is referred to as ‘beam-like’ electrons in this paper.
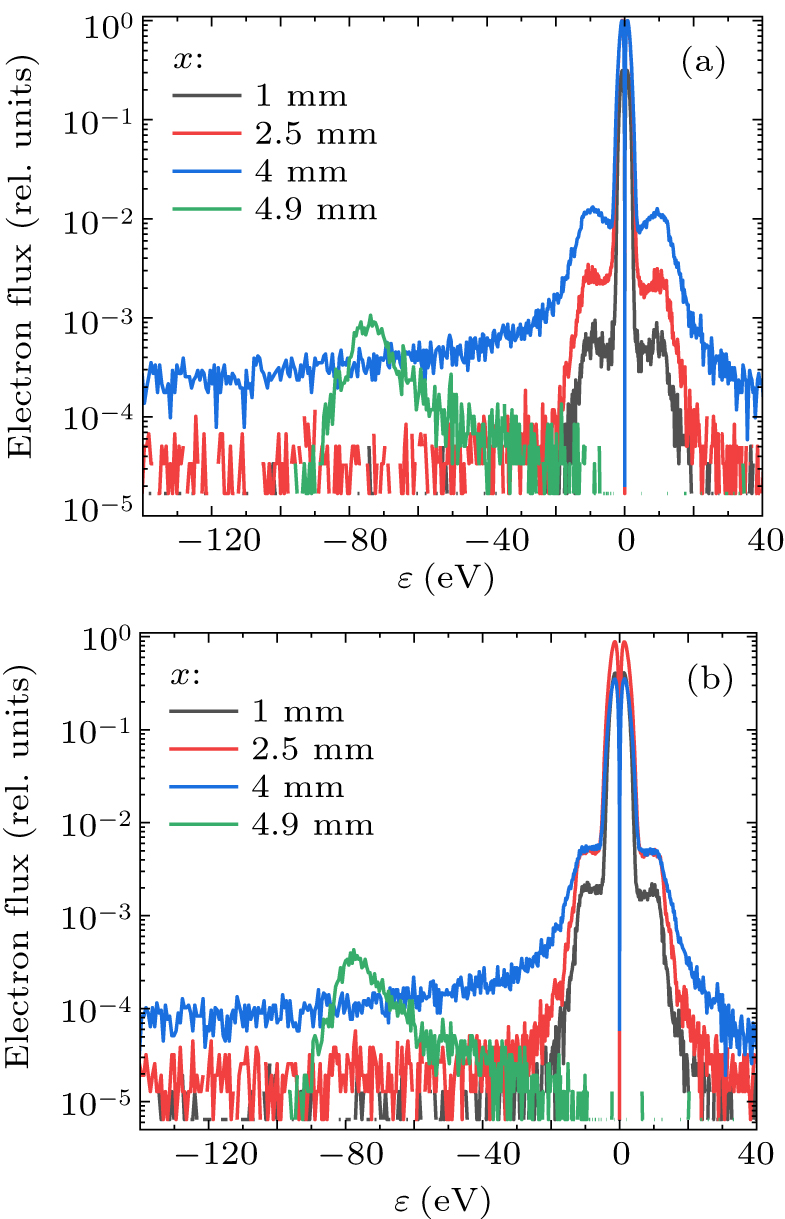
Along the outlet direction, the electron flux decreases across all energy ranges. This can be attributed to the following factors: (i) ionization of argon atoms by high-energy electrons results in energy loss for the high-energy electrons, which cannot be effectively accelerated by the weak electric field in the anode channel. This limits further ionization and leads to a decrease in both high-energy and low-energy electrons,[39] (ii) low-energy electrons generated near the anode wall have a high probability of being absorbed by the wall,[40] and (iii) continued absorption of electrons by the anode. Unlike the long anode, the flux distributions at x = 2.5 mm and x = 4 mm intersect in the short anode. This may be due to the shortening of the anode, which causes fast electrons to move outside the channel, ionize the argon gas, and produce low-energy electrons, resulting in an increased number of low-energy electrons outside the channel.
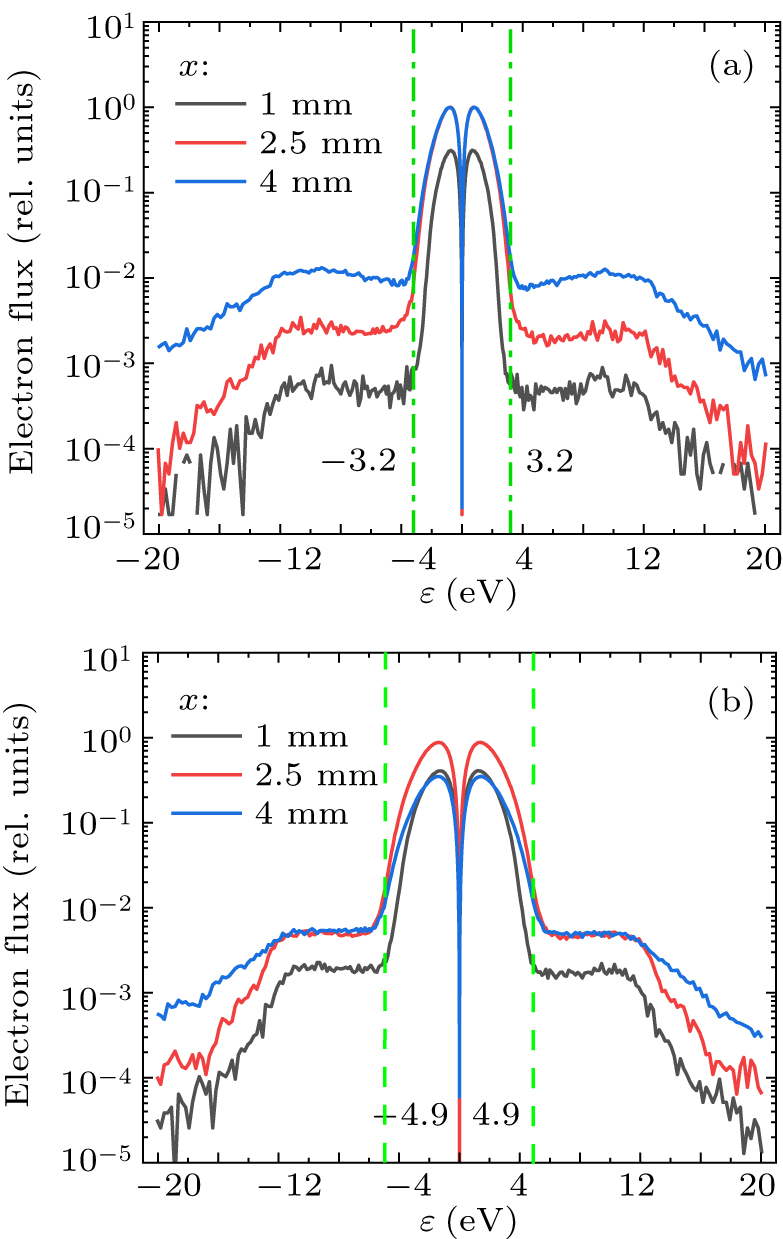
Figure 12 provides a clearer depiction of the electron flux distributions below 20 eV. It is evident that slow electrons dominate, while fast electrons are relatively rare. The electron flux distribution in the long anode channel from x = 4 mm to x = 2.5 mm shows that the low-energy electron region remains nearly identical, indicating that most low-energy electrons are effectively collimated. The electron flux profile transitions into a plateau distribution (enhanced high-energy tail) after a distinct turning point marked by the dotted line, which represents the energy of the potential well. This indicates that electrons with energies exceeding the potential well exhibit an increased flux within the hollow anode structure. However, these high-energy electrons are very scarce, making up only 0.1% to 1% of the low-energy electrons, indicating that only a very small fraction of high-energy electrons are collimated. Based on the previous classification of electron energy ranges, the flux of moderate-velocity electrons increases. This occurs because moderate-velocity electrons experience negligible energy loss, undergoing only elastic collisions, and are drawn toward the channel interior by the potential well. The threshold effect of the potential well observed here further supports the earlier analysis, confirming its role in imparting a collimation effect to the discharge structure.
At energies greater than 12 eV, the rapid decrease in flux at positions x = 2.5 mm and 1 mm, compared to x = 4 mm, can be attributed to the efficient absorption of high-energy electrons by the anode.[41] Both inelastic collisions and the motion of high-energy electrons towards the wall contribute to the consumption of high-energy electrons. The latter occurs efficiently when the energy relaxation length exceeds the distance traveled.[41] The high-energy electron energy relaxation length
3.1. Plasma density distribution with different length anode structures
3.2. Potential distribution, its relationship with plasma density, and its effect on electron motion
3.3. Distribution of electron flux
-
This paper employs a 2D PIC/MCC model to simulate millimeter-scale hollow anode glow discharges. Two different hollow anode lengths are considered, with argon used as the working gas at a pressure of 2 Torr. The numerical simulation provides spatial distributions of plasma density, spatial potential, and electron flux with different energies. The study focuses on the distinct potential structures generated by two hollow anodes of varying lengths and their impacts on discharge characteristics. Results show that along the axial exit direction, both the logarithm of plasma density and the potential exhibit linear decreases within the channel. The theoretical electron temperature derived from the potential–density relationship agrees well with the simulated temperature. Transverse potential wells formed in the anode channel differentially affect electrons of various energies, with the hollow anode acting like a collimator for electrons. Shortening the anode length significantly increases the plasma density at the outlet and alters the potential well, thereby modifying the flux distribution of electrons with different energies. Despite differences in working gases, the hollow anode discharge characteristics obtained in this study are highly consistent with Ref. [28], such as plasma density distributions and sheath thickness. However, further research in this paper has deepened our physical understanding of the anode’s role in this type of micro-discharge.
 DownLoad: