
 首页
首页 登录
登录 注册
注册


-
界面纳米气泡最早于1994年被Parker等[1]提出, 用于解释水溶液中疏水表面间阶梯状力曲线. 由于纳米气泡在矿物浮选[2–4]、水产养殖[5,6]、废水处理[7,8]、表面清洁[9,10]、流体减阻[11,12]等多个领域的应用潜力, 纳米气泡相关研究得到了迅速发展.
界面纳米气泡通常高度在100 nm以下, 宽度在10 μm以下, 具有强稳定性、小接触角(气体一侧)、高气体密度等物理性质. 根据Young-Laplace方程, 纳米气泡具有极高的拉普拉斯压力. 经典物理学理论[13]表明, 极高的拉普拉斯压力将驱动纳米气泡在毫秒量级时间内溶解, 其寿命约为
$ ~{R}^{2}{\rho }_{{\mathrm{g}}}/\left(D{c}_{{\mathrm{s}}}\right) $ , 其中R为纳米气泡的曲率半径,$ {\rho }_{{\mathrm{g}}} $ 为气体密度, D为气体在溶液中的扩散系数,$ {c}_{{\mathrm{s}}} $ 为气体溶解度. 鉴于此, 纳米气泡的存在在早期受到了广泛质疑.界面纳米气泡在2000年首次被仪器观测, 即Luo等[14]使用原子力显微镜轻敲模式成功扫描到纳米气泡图像, 自此界面纳米气泡研究进入实质性实验研究阶段. 随着界面纳米气泡先后被原子力显微镜[14–16]、干涉增强反射显微镜[17]、荧光寿命成像显微镜[18]、全内反射荧光显微镜[19]、原位透射电子显微镜[20]等多种技术手段成功扫描, 并通过衰 减全反射傅里叶变换红外光谱证实了其内部气体形态[21], 以及借助基于同步辐射的扫描透射软X射线显微镜确认了其内部高气体密度[22], 目前界面纳米气泡的长期稳定存在已成为共识.
界面纳米气泡被证实存在后, 科学家们将目光转向其稳定性机理, 分别提出了污染物理论[23]、动态平衡理论[24]、三相线钉扎+气体过饱和理论[25]、三相线钉扎+疏水势理论[26,27]、高密度气体吸附层理论[28–30]等. 然而, 由于纳米气泡的极小尺寸导致高速动态观测难, 其成核过程少有实验研究.
纳米气泡可以在亲水表面、气体不饱和等条件下长期生存[31,32], 但其成核往往需要更严苛的条件, 比如较高的气体过饱和度和疏水性表面. 学术研究中通常通过醇水替换法[14,33]、温差法[34,35]、直接滴加法[36]等方法产生纳米气泡. 醇水替换法是借助气体在乙醇和水中溶解度的差异, 在溶剂替换过程中使固-液界面附近形成气体过饱和状态. 温差法是将4 ℃冷水滴加到常温基底上, 在升温过程中气体溶解度降低, 从而使溶解气体析出. 直接滴加法则是将水直接滴加到基底上, 在水滴与基底碰撞过程中捕获未逃离气体, 形成界面处气体过饱和. 由于纳米气泡生成的随机性, 纳米气泡生成率的定量研究较少. 根据文献中纳米气泡图像定性比较, 醇水替换法生成纳米气泡的面积覆盖率远大于温差法[37]. 直接滴加法生成纳米气泡的重现性较差, 较多文献表明未发现纳米气泡的生成[38,39]. 作者团队[16]通过扫描大量表面区域, 定量论证了纳米气泡面积覆盖率与界面附近气体过饱和度成正相关关系. 然而, 目前纳米气泡成核研究主要局限于宏观层面的生成数量和面积覆盖率, 对成核过程的研究较少.
分子动力学模拟是研究纳米尺度下溶液及界面现象的重要工具, 因此是研究纳米气泡成核过程的理想手段[40–48]. Dammer和Lohse[40]借助分子动力学模拟发现疏水固-液界面存在气体富集层. Weijs等[41]、Peng等[42]、Yang等[28]通过分子动力学模拟发现气体富集层可能是纳米气泡超大接触角的主要来源. Xiao等[43]通过分子动力学模拟研究了醇水替换过程中气体扩散过程及纳米气泡生成机制. Zhang等[44]通过分子动力学模拟揭示了纳米气泡在电极表面的生长及脱附行为. 作者团队[45]研究了纳米气泡在不同疏水性及亲气性表面上气体分子富集过程. 尽管纳米气泡成核理论及模拟研究取得了一定的进展, 但分子尺度上纳米气泡孵化过程及生长动力学研究依然缺乏.
本文将针对表面粗糙度和气体过饱和对纳米气泡孵化和生长过程的影响机制展开研究. 借助分子动力学模拟观察不同气体过饱和度下光滑及粗糙表面上纳米气泡微观成核过程, 并分析纳米气泡几何特征随时间演化特征. 同时, 基于气体扩散理论推导表面纳米气泡的生长动力学模型, 并将模型预测数据与模拟实验数据进行对比. 研究结果发现光滑表面上纳米气泡成核需极高的气体过饱和度, 而表面凹坑的存在可显著降低纳米气泡成核所需气体过饱和度, 同时凹坑尺寸对纳米气泡能否形成起着关键作用. 本研究将加深对纳米气泡成核过程的理解, 并为纳米气泡生成调控及相关应用提供理论支撑.
-
使用开源GROMACS 2019.6软件包[49]进行分子动力学模拟, 粒子间相互作用通过兰纳-琼斯 (Lennard-Jones, L-J)势进行计算:
其中, i和j分别表示粒子i和粒子j,
$ {r}_{ij} $ 表示粒子i和j之间距离,$ {\varepsilon }_{ij} $ 表示粒子i和j之间势阱深度,$ {\sigma }_{ij} $ 表示粒子i和j之间特征尺寸, f为静电转换因子,$ {q}_{i} $ 和$ {q}_{j} $ 分别表示粒子i和j的电荷. 用蛙跳式算法对粒子牛顿运动方程积分计算, 截断距离为1.0 nm, 步长2 fs. 使用Verlet生成缓冲配对列表, 使用grid格点搜索以10步的频率更新邻区列表. 在x, y, z三个方向使用周期性边界条件. 静电相互作用使用快速平滑粒子网格 PME静电方法分别对直接空间和倒易空间进行计算, 计算过程中设置格点间距为 0.16 nm, 插值阶数为4. 使用带有随机项的速度重新缩放方法(V-rescale)进行温度耦合, 该恒温算法可以避免传统方法中温度漂移的问题. 温度耦合时间常数设置为0.1 ps, 耦合温度为298.15 K. 由于模拟盒子上方设置有真空层, 因此模拟过程中不进行长程色散校正, 同时由于气泡生长过程中液相和上层基板上移, 因此不进行质心运动移除设置. -
模拟模型如图1所示, 盒子尺寸为20.2 nm × 3.4 nm × 22 nm, 由于周期性边界设置, 纳米气泡实际为圆柱形纳米气泡. 液体模型使用SPC/E全原子水模型, 气体分子使用单原子氮气模型, 底部固体基底为石墨烯模型, 顶部放置单层石墨烯用于施加z方向压力. 使用单原子型气体分子可以在模拟中将部分液体分子转变为气体分子, 以便设置体相恒定气体浓度区. 文献[44,50]通常使用粗粒化模拟实现液体与气体分子间相互转换, 本研究使用全原子水分子模型进行体相恒定气体浓度区模拟. 各原子类型参数如表1中所示, 其中N代表氮气氮原子, Ow代表水分子氧原子, Hw代表水分子氢原子, S代表底部固体原子, ST代表顶部固体原子. 模拟在OPLS-AA力场中进行, 不同原子类型组合使用几何平均进行计算.
模拟过程中, 使用活塞控压法, 对顶板施加方向向下的10 bar (1 bar = 105 Pa)压力, 使z方向保持恒压. 活塞控压法对固-液界面体系和纳米气泡体系等压力非均匀分布模型研究有较好的控压效果[44,50]. 将顶板下方1—3 nm区域设置为恒定气体浓度区, 以模拟体相气体浓度. 具体方法如下: 模拟过程中, 通过自编写Python代码和Shell代码, 每间隔1 ns检测一次该区域内气体浓度, 若低于设定浓度, 则计算出需要加入的气体分子个数, 并随机删除该区域内相应数量的水分子, 并在被删除水分子的Ow位置加入氮气分子, 若高于设定浓度, 则删除该区域内多余的氮气分子. 需注意的是, 由于顶板位置随气泡的增长而升高, 恒定气体浓度区将随顶板位置发生变化, 因此需每1 ns检测一次顶板位置并重新定义恒定气体浓度区坐标范围.
-
在正式模拟前, 首先使用最陡下降算法进行能量最小化, 设置最大力小于300 kJ/(mol·nm)时完成收敛. 在不添加气体分子时模拟10 ns, 获得平衡的固液系统; 然后计算出液相体积以及气体过饱和度所对应的气体数量, 并将该数量的气体分子随机加入液相中; 再次进行能量最小化, 开始进行纳米气泡成核过程模拟.
-
将模拟盒子的x-z平面分割为0.1 nm × 0.1 nm的网格, 计算每个格子内每0.1 ns的平均液体密度. 将密度为体相液体密度50%的位置定义为液-气界面, 使用自编写Python代码找出所有处于液-气界面位置的格子坐标, 用圆方程进行最小二乘法拟合, 得到纳米气泡液-气界面的圆心坐标及曲率半径. 将底部固体表面质心坐标加上0.5σS-Ow作为固-液界面位置, 结合纳米气泡圆心坐标及曲率半径, 计算出纳米气泡的接触角、宽度、高度等几何参数.
-
建立10 nm × 10 nm × 20 nm的模拟盒子, 如图2(a)所示, 在盒子中部10 nm × 10 nm × 10 nm区域填充32773个水分子, 在盒子的剩余空间填充一定数量的气体分子, 模拟30 ns. 模拟结束后, 对最后10 ns内气相中气体密度与液相中气体浓度进行统计分析. 通过改变气体分子数量, 获得不同气相气体密度时液体中气体浓度, 如图2(b)所示, 通过线性拟合, 得到气体在液体中的奥斯瓦尔德系数η = 0.0214.
-
建立5 nm × 5 nm × 5 nm的模拟盒子, 在NPT系综下模拟, 包括4055个水分子和1个气体分子, 温度通过V-rescale温浴控制, 压力通过Parrinello-Rahman压浴控制. 首先模拟10 ns, 得到平衡状态下的模拟构型, 随后以该平衡构型为初始模型, 分别进行20组平行模拟, 每组模拟运行10 ns. 对每组模拟计算经历不同时间t时的均方位移MSD:
随后通过Einstein公式, 得到
通过(2)式得到如图2(c)所示的MSD-t数据, 取MSD中较为平直、统计误差较小的区域来计算斜率, 斜率的1/6为扩散系数D. 对所有20组模拟结果取平均, 得到气体分子在水中的扩散系数为D = (3.94±2.55) × 10–9 m2/s.
-
根据Epstein-Plesset气体扩散方程[51], 单位时间流入气泡的气体质量为
式中, S为气泡表面积, D为气体在液体中扩散系数, r为距离气泡中心的距离, c为距离气泡中心r处的气体浓度,
$ {c}_{\infty } $ 为体相气体浓度,$ {c}_{{\mathrm{I}}{\mathrm{N}}{\mathrm{B}}} $ 为紧邻气泡表面处液体中气体浓度, R为气泡曲率半径. 需注意的是, Epstein-Plesset方程[51]忽略了对流项, 即不考虑气泡增长或收缩导致的液体流动, 这可能低估气体扩散速度. 然而, 研究证实Epstein-Plesset方程可以较好地预测微米级气泡的生长动力学[52,53], 表明忽略对流项对模型准确性的影响较为微弱. Chan和Ohl[19]以及Dietrich等[54]通过荧光纳米粒子示踪发现纳米气泡周围粒子呈现出布朗运动, 未发现纳米气泡周边存在对流现象. 因此, 本文将基于Epstein-Plesset方程对圆柱形表面纳米气泡的演化进行理论推导.使用气体过饱和度
$ \zeta $ 表示体相气体浓度:气体表面处液体中气体浓度可根据亨利定律得到
式中,
$ {c}_{{\mathrm{s}}} $ 为环境压力P0时液体中气体溶解度,$ \sigma $ 为气液界面张力(对于SPC/E全原子水模型, 表面张力为58 mN/m). 需注意的是, 在球形纳米气泡中, (6)式需修正为$ {c}_{{\mathrm{I}}{\mathrm{N}}{\mathrm{B}}} = {c}_{{\mathrm{s}}}\left[1+ {2\sigma }/({R{P}_{0}})\right] $ , 即圆柱形纳米气泡表面处气体浓度约为球形纳米气泡的1/2. 除此之外, 球形气泡的表面积和体积分别与R2和R3线性正相关, 而圆柱形气泡的表面积和体积分别与R1和R2线性正相关. 圆柱形气泡的几何关系如下:式中, L是纳米气泡宽度,
$ \theta $ 是纳米气泡气体一侧接触角, H是纳米气泡高度,$ \delta $ 是纳米气泡厚度, S是纳米气泡表面积, V是纳米气泡体积.根据
$ m = \rho V $ 有以下方程:在拉普拉斯压力作用下, 纳米气泡气体密度
$ \rho $ 是半径R的函数, 使用奥斯瓦尔德系数$ \eta $ 表示气体溶解度:通过(14)式进一步可以得到光滑均质表面上纳米气泡宽度的动力学公式:
-
图3为光滑均质表面上气体过饱和度
$ \zeta $ = 100时纳米气泡成核过程. 初始模型中, 根据模拟盒子中液体体积, 计算出气体过饱和度为100时的气体数量, 将该数量的气体分子随机添加到液相中, 该时刻定义为0 ns. 81 ns时固-液界面出现较小气体聚集体, 随后气体聚集体快速生长, 在83 ns时出现明显的纳米气泡形态, 130 ns时纳米气泡已具有较大尺寸. 对比85 ns和100 ns图像, 发现纳米气泡在固-液界面存在滑动现象, 这是由于布朗运动所致[55].对纳米气泡的几何参数进行分析, 得到纳米气泡的接触角(本文中接触角均指气体一侧接触角)、半径、宽度随时间的变化, 如图4所示. 图4中零时刻定义为气体聚集体形成的时刻. 由图4(a)可知, 虽然使用了光滑均质表面, 但纳米气泡的接触角并非恒定, 而是随时间先迅速增大后逐渐稳定. 这是由于在成核初期, 纳米气泡半径极小, 导致拉普拉斯压力极大. 根据Szyszkowski方程:
式中,
$ {\gamma }_{{\mathrm{s}}{\mathrm{g}}}^{{\mathrm{P}}} $ 和$ {\gamma }_{{\mathrm{s}}{\mathrm{g}}} $ 分别表示在气体压力为P和0时的固-气界面张力, kB是玻尔兹曼常数, T是温度, b是单个气体分子的有效截面积,$ {K}_{{\mathrm{e}}{\mathrm{q}}}^{{\mathrm{A}}} $ 是固-气间平衡吸附常数. 由(16)式可知, 随着气体压力P的增大, 固-气界面张力下降. 根据杨氏方程, 接触角$ \theta $ 与固-气界面张力$ {\gamma }_{{\mathrm{s}}{\mathrm{g}}} $ 间关系如下:式中,
$ \theta $ 表示接触角(气体一侧),$ {\gamma }_{{\mathrm{s}}{\mathrm{l}}} $ 表示固-液界面张力,$ {\gamma }_{{\mathrm{l}}{\mathrm{g}}} $ 表示液-气界面张力. 由(17)式可知, 随着$ {\gamma }_{{\mathrm{s}}{\mathrm{g}}} $ 的降低, 接触角逐渐减小. 因此, 在纳米气泡成核早期, 较大的拉普拉斯压力降低了固-气界面张力, 导致了纳米气泡极小的接触角.图4(b), (c)分别为纳米气泡曲率半径和宽度随时间的演化. 纳米气泡成核后, 其曲率半径和宽度均随时间近似线性增加, 表明纳米气泡成核早期半径R和宽度L呈现出t1生长趋势. 分别用(14)式和(15)式对图4(b), (c)进行拟合, 如图4中红色曲线所示. 拟合决定系数R2分别为0.9803和0.9774, 残差直方图表明残差分布近似于正态分布, 表明理论公式对模拟数据的拟合效果较好, 即理论模型可以较好地描述纳米气泡成核过程.
图5(a)为不同气体过饱和度时的纳米气泡成核发生所需时间. 气体过饱和度为100, 120, 150和200时纳米气泡成核时间分别为81, 17, 6和1.3 ns. 很显然, 随着气体过饱和度的增大, 纳米气泡成核所需时间急剧减小. 同时研究了气体过饱和度为50时的情况, 发现在模拟时间200 ns范围内纳米气泡没有成核, 表明光滑表面上纳米气泡成核需要极高的气体过饱和度. 根据(14)式, 纳米气泡的生长需满足:
即
定义纳米气泡临界成核半径为
当气体聚集体半径R超过临界成核半径
$ {R}_{{\mathrm{c}}{\mathrm{r}}{\mathrm{i}}{\mathrm{t}}{\mathrm{i}}{\mathrm{c}}{\mathrm{a}}{\mathrm{l}}} $ 时, 纳米气泡将逐渐增大; 反之, 当R<$ {R}_{{\mathrm{c}}{\mathrm{r}}{\mathrm{i}}{\mathrm{t}}{\mathrm{i}}{\mathrm{c}}{\mathrm{a}}{\mathrm{l}}} $ 时,$ {{\mathrm{d}}R}/{{\mathrm{d}}t} < 0 $ , 形成的气体聚集体将逐渐减小直至消失. 当气体过饱和度为50, 100, 120, 150, 200时,$ {R}_{{\mathrm{c}}{\mathrm{r}}{\mathrm{i}}{\mathrm{t}}{\mathrm{i}}{\mathrm{c}}{\mathrm{a}}{\mathrm{l}}} $ 分别为1.16, 0.58, 0.48, 0.39, 0.29 nm. 很显然, 随着气体过饱和度增大,$ {R}_{{\mathrm{c}}{\mathrm{r}}{\mathrm{i}}{\mathrm{t}}{\mathrm{i}}{\mathrm{c}}{\mathrm{a}}{\mathrm{l}}} $ 减小, 这是高气体过饱和度时纳米气泡更容易成核的主要原因之一. 当气体过饱和度较低时,$ {R}_{{\mathrm{c}}{\mathrm{r}}{\mathrm{i}}{\mathrm{t}}{\mathrm{i}}{\mathrm{c}}{\mathrm{a}}{\mathrm{l}}} $ 更大, 同时形成大尺寸气体聚集体的概率更低, 导致纳米气泡成核更困难. 需注意的是, (20)式为圆柱形纳米气泡的临界成核半径; 对于球形纳米气泡,$ {R}_{{\mathrm{c}}{\mathrm{r}}{\mathrm{i}}{\mathrm{t}}{\mathrm{i}}{\mathrm{c}}{\mathrm{a}}{\mathrm{l}}} = 2\sigma /\left(\zeta {P}_{0}\right) $ , 即临界成核半径是圆柱形纳米气泡的2倍, 因此球形纳米气泡成核将需要更高的气体过饱和度.图5(b), (c)中散点分别为纳米气泡曲率半径和宽度在气体过饱和度为100, 120, 150时的时间演化数据. 结果表明, 纳米气泡曲率半径和宽度 均随时间逐渐增长, 且增长速率随着气体过饱和度的增大而增大. 图中曲线为(14)式和(15)式的拟合曲线, 拟合决定系数R2均在0.96以上, 较好的拟合效果再次表明基于气体扩散方程的纳米气泡生长动力学模型可以较好地描述纳米气泡成核过程.
在纳米气泡生成实验中, 通常使用醇水替换法和温差法, 但是温差法生成纳米气泡的数量远小于醇水替换法. 25 ℃时, 气体在乙醇和水中的奥斯瓦尔德系数分别为0.283和0.031, 4 ℃时气体在水中的奥斯瓦尔德系数为0.0448, 因此醇水替换法和温差法产生的气体过饱和度理论值分别为8.1和0.4. 根据(14)式, 气体过饱和度η为8.1和0.4时纳米气泡半径随时间的演化如图6(a)所示, 其中t = 0对应于纳米气泡半径等于
$ {R}_{{\mathrm{c}}{\mathrm{r}}{\mathrm{i}}{\mathrm{t}}{\mathrm{i}}{\mathrm{c}}{\mathrm{a}}{\mathrm{l}}} $ 的时刻. 结果表明, 气体过饱和度η = 8.1时纳米气泡生长速度远大于η = 0.4时. 在10 ms时, 纳米气泡曲率半径分别达到4143和370 nm, 均处于AFM可以扫描的尺寸范围内, 表明气体聚集体达到临界成核尺寸之后, 在醇水替换法和温差法两种条件下均可快速生长到实验观测的尺寸范围. 因此, 实验中温差法生成纳米气泡的数量远小于醇水替换法的主要原因, 并非是温差法更缓慢的生长动力学, 而是温差法条件下$ {R}_{{\mathrm{c}}{\mathrm{r}}{\mathrm{i}}{\mathrm{t}}{\mathrm{i}}{\mathrm{c}}{\mathrm{a}}{\mathrm{l}}} $ 更大. 根据公式(20)绘制了$ {R}_{{\mathrm{c}}{\mathrm{r}}{\mathrm{i}}{\mathrm{t}}{\mathrm{i}}{\mathrm{c}}{\mathrm{a}}{\mathrm{l}}} $ 随气体过饱和度的变化, 如图6(b)所示. 很显然, 随着气体过饱和度的减小,$ {R}_{{\mathrm{c}}{\mathrm{r}}{\mathrm{i}}{\mathrm{t}}{\mathrm{i}}{\mathrm{c}}{\mathrm{a}}{\mathrm{l}}} $ 急剧增大, 导致纳米气泡成核更加困难. 图6(b)中黑色星标分别代表醇水替换法和温差法所对应的$ {R}_{{\mathrm{c}}{\mathrm{r}}{\mathrm{i}}{\mathrm{t}}{\mathrm{i}}{\mathrm{c}}{\mathrm{a}}{\mathrm{l}}} $ , 分别为7 nm和145 nm, 温差法更大的$ {R}_{{\mathrm{c}}{\mathrm{r}}{\mathrm{i}}{\mathrm{t}}{\mathrm{i}}{\mathrm{c}}{\mathrm{a}}{\mathrm{l}}} $ 导致气体聚集体生长为纳米气泡的概率更低. -
图7展示了气体过饱和度为50时纳米气泡在粗糙表面上的成核微观过程. 7 ns时纳米气泡已在凹坑内成核, 随后在7—50 ns, 纳米气泡被钉扎在凹坑边缘, 而高度和接触角逐渐增大, 当接触角增大至临界值时, 纳米气泡三相线开始扩展, 随后以非钉扎模式生长.
对图7中粗糙表面上纳米气泡几何参数随时间的演化进行分析, 如图8所示. 在7—50 ns, 纳米气泡宽度保持不变, 接触角逐渐增大; 在50 ns之后, 纳米气泡宽度逐渐增大, 接触角则稳定在100°左右. 更有趣的是纳米气泡曲率半径的变化, 在7—50 ns时, 纳米气泡曲率半径先迅速降低, 后缓慢增大. 初始阶段中纳米气泡曲率半径的显著降低是由于纳米气泡三相线被钉扎, 在高度逐渐增大的过程中接触角从0°逐渐增大, 曲率半径随之减小, 当接触角达到90°时曲率半径达到最小值, 随后纳米气泡的曲率半径开始逐渐增大.
图9为气体过饱和度为50时凹坑宽度对纳米气泡成核的影响. 当凹坑宽度为1 nm时, 凹坑在0.14 ns时已形成气核, 随后凹坑内气体数量逐渐增多, 然而直到200 ns时气核仍未有任何生长. 当凹坑宽度为2 nm时, 凹坑在5 ns时形成气核, 因此形成气核所需时间显著长于凹坑宽度为1 nm时. 形成气核之后, 气核开始缓慢生长, 到100 ns时气核的生长突破了凹坑的钉扎, 开始形成纳米气泡并逐渐增大. 当凹坑宽度为10 nm时, 气核首先在凹坑的底部边缘形成, 随后气核逐渐生长, 在140 ns时气核完全填充凹坑, 随后纳米气泡接触角逐渐增大, 突破凹坑钉扎后以非钉扎模式增长.
凹坑被气核填充之后, 接触线被凹坑边缘 钉扎, 在高度逐渐增大过程中曲率半径逐渐降低, 当接触角达到90°时曲率半径达到最小值Rmin, 即凹坑宽度的1/2. 该凹坑气核能否继续生长取决于Rmin是否大于Rcritical. 根据(20)式, 气体过饱和度为50时, Rcritical = 1.16 nm, 因此, 凹坑宽度为1 nm时, Rmin = 0.5 nm, 远小于Rcritical, 因此凹坑气核难以继续生长. 在凹坑2 nm时, Rmin为1.0 nm, 与Rcritical极为相近, 在热波动下凹坑气核尺寸可能会在某个瞬间超过1.16 nm, 从而使气核突破瓶颈继续生长. 当凹坑宽度大于2 nm时, 凹坑气核形成后均随时间稳定生长, 如图7中的4 nm和图9(c)的10 nm两种情况所示. 因此, 固体表面上的凹坑有助于在低气体过饱和度下形成气核, 但凹坑气核能否生长为纳米气泡取决于凹坑半径是否大于纳米气泡临界成核半径.
如何调控纳米气泡的成核效率是纳米气泡在矿物浮选[56,57]、微流体减阻[58–60]、表面清洁[9,61]等领域中应用的关键. 本文研究表明通过提高气体过饱和度和粗糙度均有助于纳米气泡的成核和生长, 同时粗糙表面上凹坑尺寸需超过纳米气泡临界成核半径. 因此, 在矿物浮选中, 可以通过优化选前破磨工况获得特定表面结构的颗粒, 从而促进表面纳米气泡形成. 在微流体减阻、表面清洁等领域应用中, 也可以通过设计结构化表面对纳米气泡成核进行调控.
-
通过分子动力学模拟研究了气体过饱和度和表面粗糙度对纳米气泡成核微观过程和生长动力学行为的影响机制, 并基于气体扩散方程推导了纳米气泡生长动力学模型.
1)在光滑均质表面, 纳米气泡成核后曲率半径和宽度均随时间逐渐延长, 该过程可被理论模型较好地拟合, 表明基于气体扩散理论的纳米气泡生长动力学模型可以较好地描述纳米气泡成核过程. 与此同时, 纳米气泡生长过程中接触角(气体一侧)并非恒定, 而是先增大后趋于稳定, 这是由于较高的拉普拉斯压力降低了固-气界面张力, 导致纳米气泡接触角随尺寸增大而增大.
2)在光滑均质表面, 当气体过饱和度从100增至120和150时, 纳米气泡成核所需时间逐渐缩短, 同时成核后其生长动力学逐渐加快. 然而, 当气体过饱和度降低至50时, 在200 ns模拟时间内纳米气泡未成核. 理论分析表明: 只有当气体聚集体尺寸超过纳米气泡临界成核尺寸(
$ {R}_{{\mathrm{c}}{\mathrm{r}}{\mathrm{i}}{\mathrm{t}}{\mathrm{i}}{\mathrm{c}}{\mathrm{a}}{\mathrm{l}}} = {\sigma}/({\zeta {P}_{0}}) $ )时, 纳米气泡可以成核并生长; 随着气体过饱和度的降低,$ {R}_{{\mathrm{c}}{\mathrm{r}}{\mathrm{i}}{\mathrm{t}}{\mathrm{i}}{\mathrm{c}}{\mathrm{a}}{\mathrm{l}}} $ 逐渐增大, 导致纳米气泡成核难度显著增加.3)在粗糙表面上, 分别设置了宽度为1, 2, 4, 10 nm的凹坑, 气体过饱和度为50时(该气体过饱和度时光滑表面上纳米气泡未成核), 上述凹坑均迅速生成气核, 但只有宽度2 nm及以上凹坑中的气核可生长为纳米气泡. 在凹坑气核生长过程中, 由于凹坑边缘的钉扎作用, 气核曲率半径先降低后增大, 只有该过程中曲率半径极小值接近或大于气泡临界成核半径时, 气核才能生长为纳米气泡.
本研究结果将进一步完善表面纳米气泡成核理论, 同时为调控纳米气泡的生成提供指导, 并为矿物浮选等相关应用提供理论支撑.
光滑及粗糙表面纳米气泡成核与生长动力学行为
Nucleation and growth dynamics of nanobubbles on smooth and rough surfaces
-
摘要: 界面纳米气泡的存在已被证实, 其在矿物浮选、水产养殖、废水处理等多个领域极具应用潜力, 但纳米气泡微观成核过程仍未明晰. 本研究基于气体扩散理论建立了纳米气泡生长动力学模型, 并借助分子动力学模拟研究了表面粗糙度和气体过饱和对纳米气泡成核和生长动力学的影响机制. 结果表明: 光滑均质表面上, 随着气体过饱和度从100增大至150, 纳米气泡的成核时间逐渐缩短, 生长速率逐渐加快, 且理论模型可以较好地拟合纳米气泡的生长动力学过程. 然而, 当气体过饱和度降低至50时, 纳米气泡在200 ns模拟时间内始终未成核, 这是由于低气体过饱和度时纳米气泡临界成核尺寸较大导致成核难度增加. 在凹坑宽度为1—10 nm的粗糙表面上, 气体过饱和度为50时, 表面凹坑均迅速生成气核, 但凹坑宽度在2 nm以下时气核难以生长为纳米气泡. 理论分析表明: 只有凹坑尺寸所对应的最小气泡半径达到纳米气泡临界成核半径时, 凹坑中的气核才能生长为纳米气泡. 研究结果将进一步完善纳米气泡成核理论体系, 同时为纳米气泡生成调控及应用提供理论支撑.Abstract:
The interfacial nanobubbles (INBs) have been confirmed to exist, and have significant potential for applications in fields such as mineral flotation, aquaculture, and wastewater treatment. However, the microscopic nucleation process of INBs is still poorly understood. This study investigates the nucleation process and growth dynamics of INBs on smooth and rough surfaces under different levels of gas supersaturation. Molecular dynamics (MD) simulations using GROMACS software package are conducted to observe the microscopic nucleation process and the temporal evolution of the geometric characteristics of the INBs. Additionally, a growth dynamics model for INBs is derived based on the Epstein-Plesset gas diffusion theory, and the predictions from the model are compared with the MD simulation data. The results indicate that on smooth homogeneous surfaces, the curvature radius and width of INBs increase progressively with time after nucleation. This growth process is well captured by the theoretical model, indicating that the gas diffusion theory provides an accurate description of INB growth dynamics. In addition, the contact angle (measured on the gas side) during INB growth is not constant but increases initially before stabilizing. This phenomenon is caused by reducing solid-gas interfacial tension due to higher Laplace pressure, thus leading the contact angle to increase as the INB radius grows. Furthermore, on smooth homogeneous surfaces, INBs are observed to nucleate at 81, 17, 6, and 1.3 ns under gas supersaturation levels of 100, 120, 150, and 200, respectively. This demonstrates that higher gas supersaturation significantly shortens the nucleation time. Additionally, as gas supersaturation increases, the growth rate of INBs after nucleation will also accelerate. However, at a gas supersaturation level of 50, no nucleation occurrs during the simulation period of 200 ns. Theoretical analysis reveals that the INBs can only nucleate and grow when the radius of gas aggregates exceeds the critical nucleation radius ($ {R}_{{\mathrm{critical}}} = {\sigma }/({\zeta {P}_{0}}) $, where $ \sigma $ is the liquid-gas interfacial tension, $ \zeta $ is the gas supersaturation level, and $ {P}_{0} $ is the ambient pressure). As gas supersaturation decreases, $ {R}_{{\mathrm{c}}{\mathrm{r}}{\mathrm{i}}{\mathrm{t}}{\mathrm{i}}{\mathrm{c}}{\mathrm{a}}{\mathrm{l}}} $ increases, thus significantly increasing the difficulty of nucleation. On rough surfaces, pits with widths of 1, 2, 4, and 10 nm are introduced. At a gas supersaturation of 50, where no INB nucleation occurrs on the smooth surfaces, gas nuclei rapidly form within the pits. However, only gas nuclei in pits with widths larger than 2 nm can grow into INBs. This is because in the growth process the pinning effect at the pit edges causes the curvature radius of the gas nucleus to initially decrease and then increase. Only when the minimum curvature radius exceeds the critical nucleation radius, can gas nuclei develop into INBs. The findings of this study provide more in-depth insights into the nucleation mechanism of INBs, and practical guidance for controlling their generation, and they also deliver theoretical support for relevant applications such as mineral flotation and other industrial processes. -
Key words:
- nanobubble nucleation /
- smooth surface /
- rough surface /
- gas supersaturation .
-

-
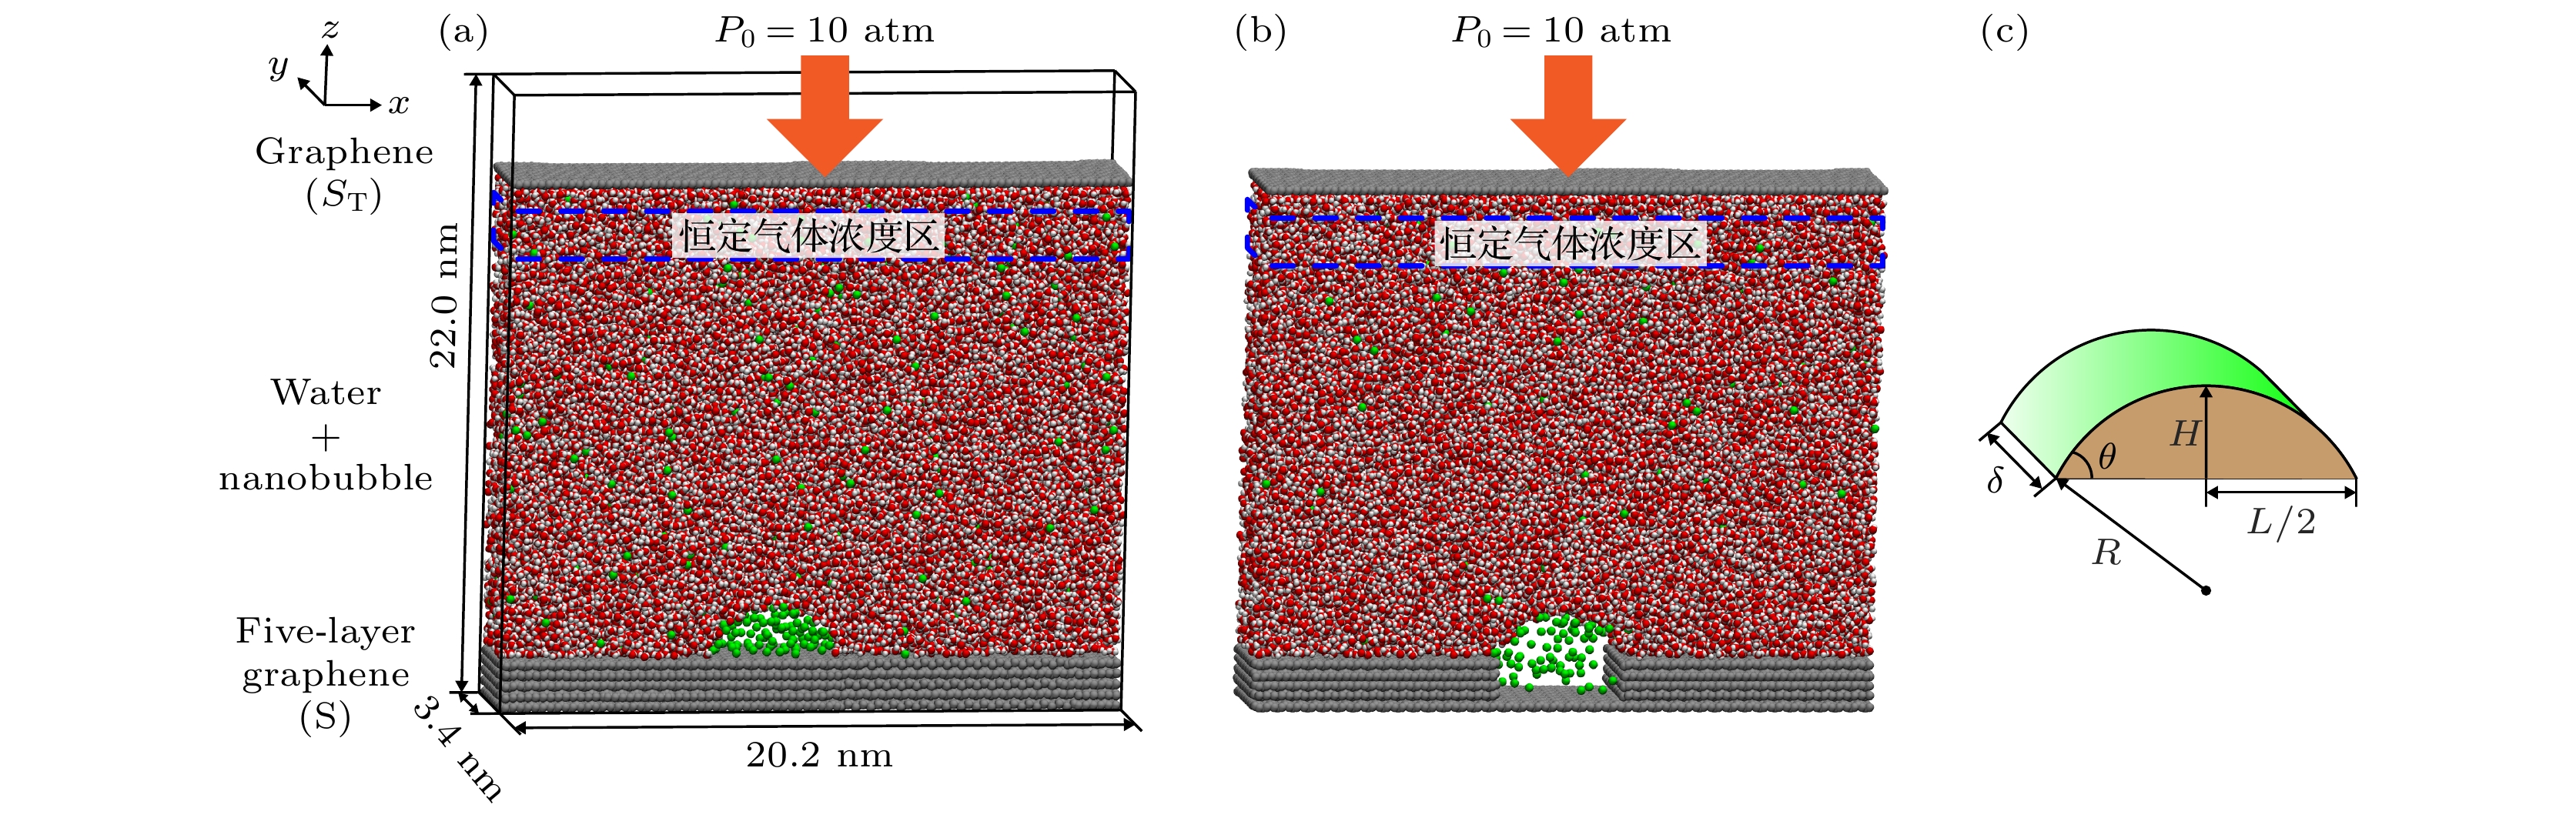
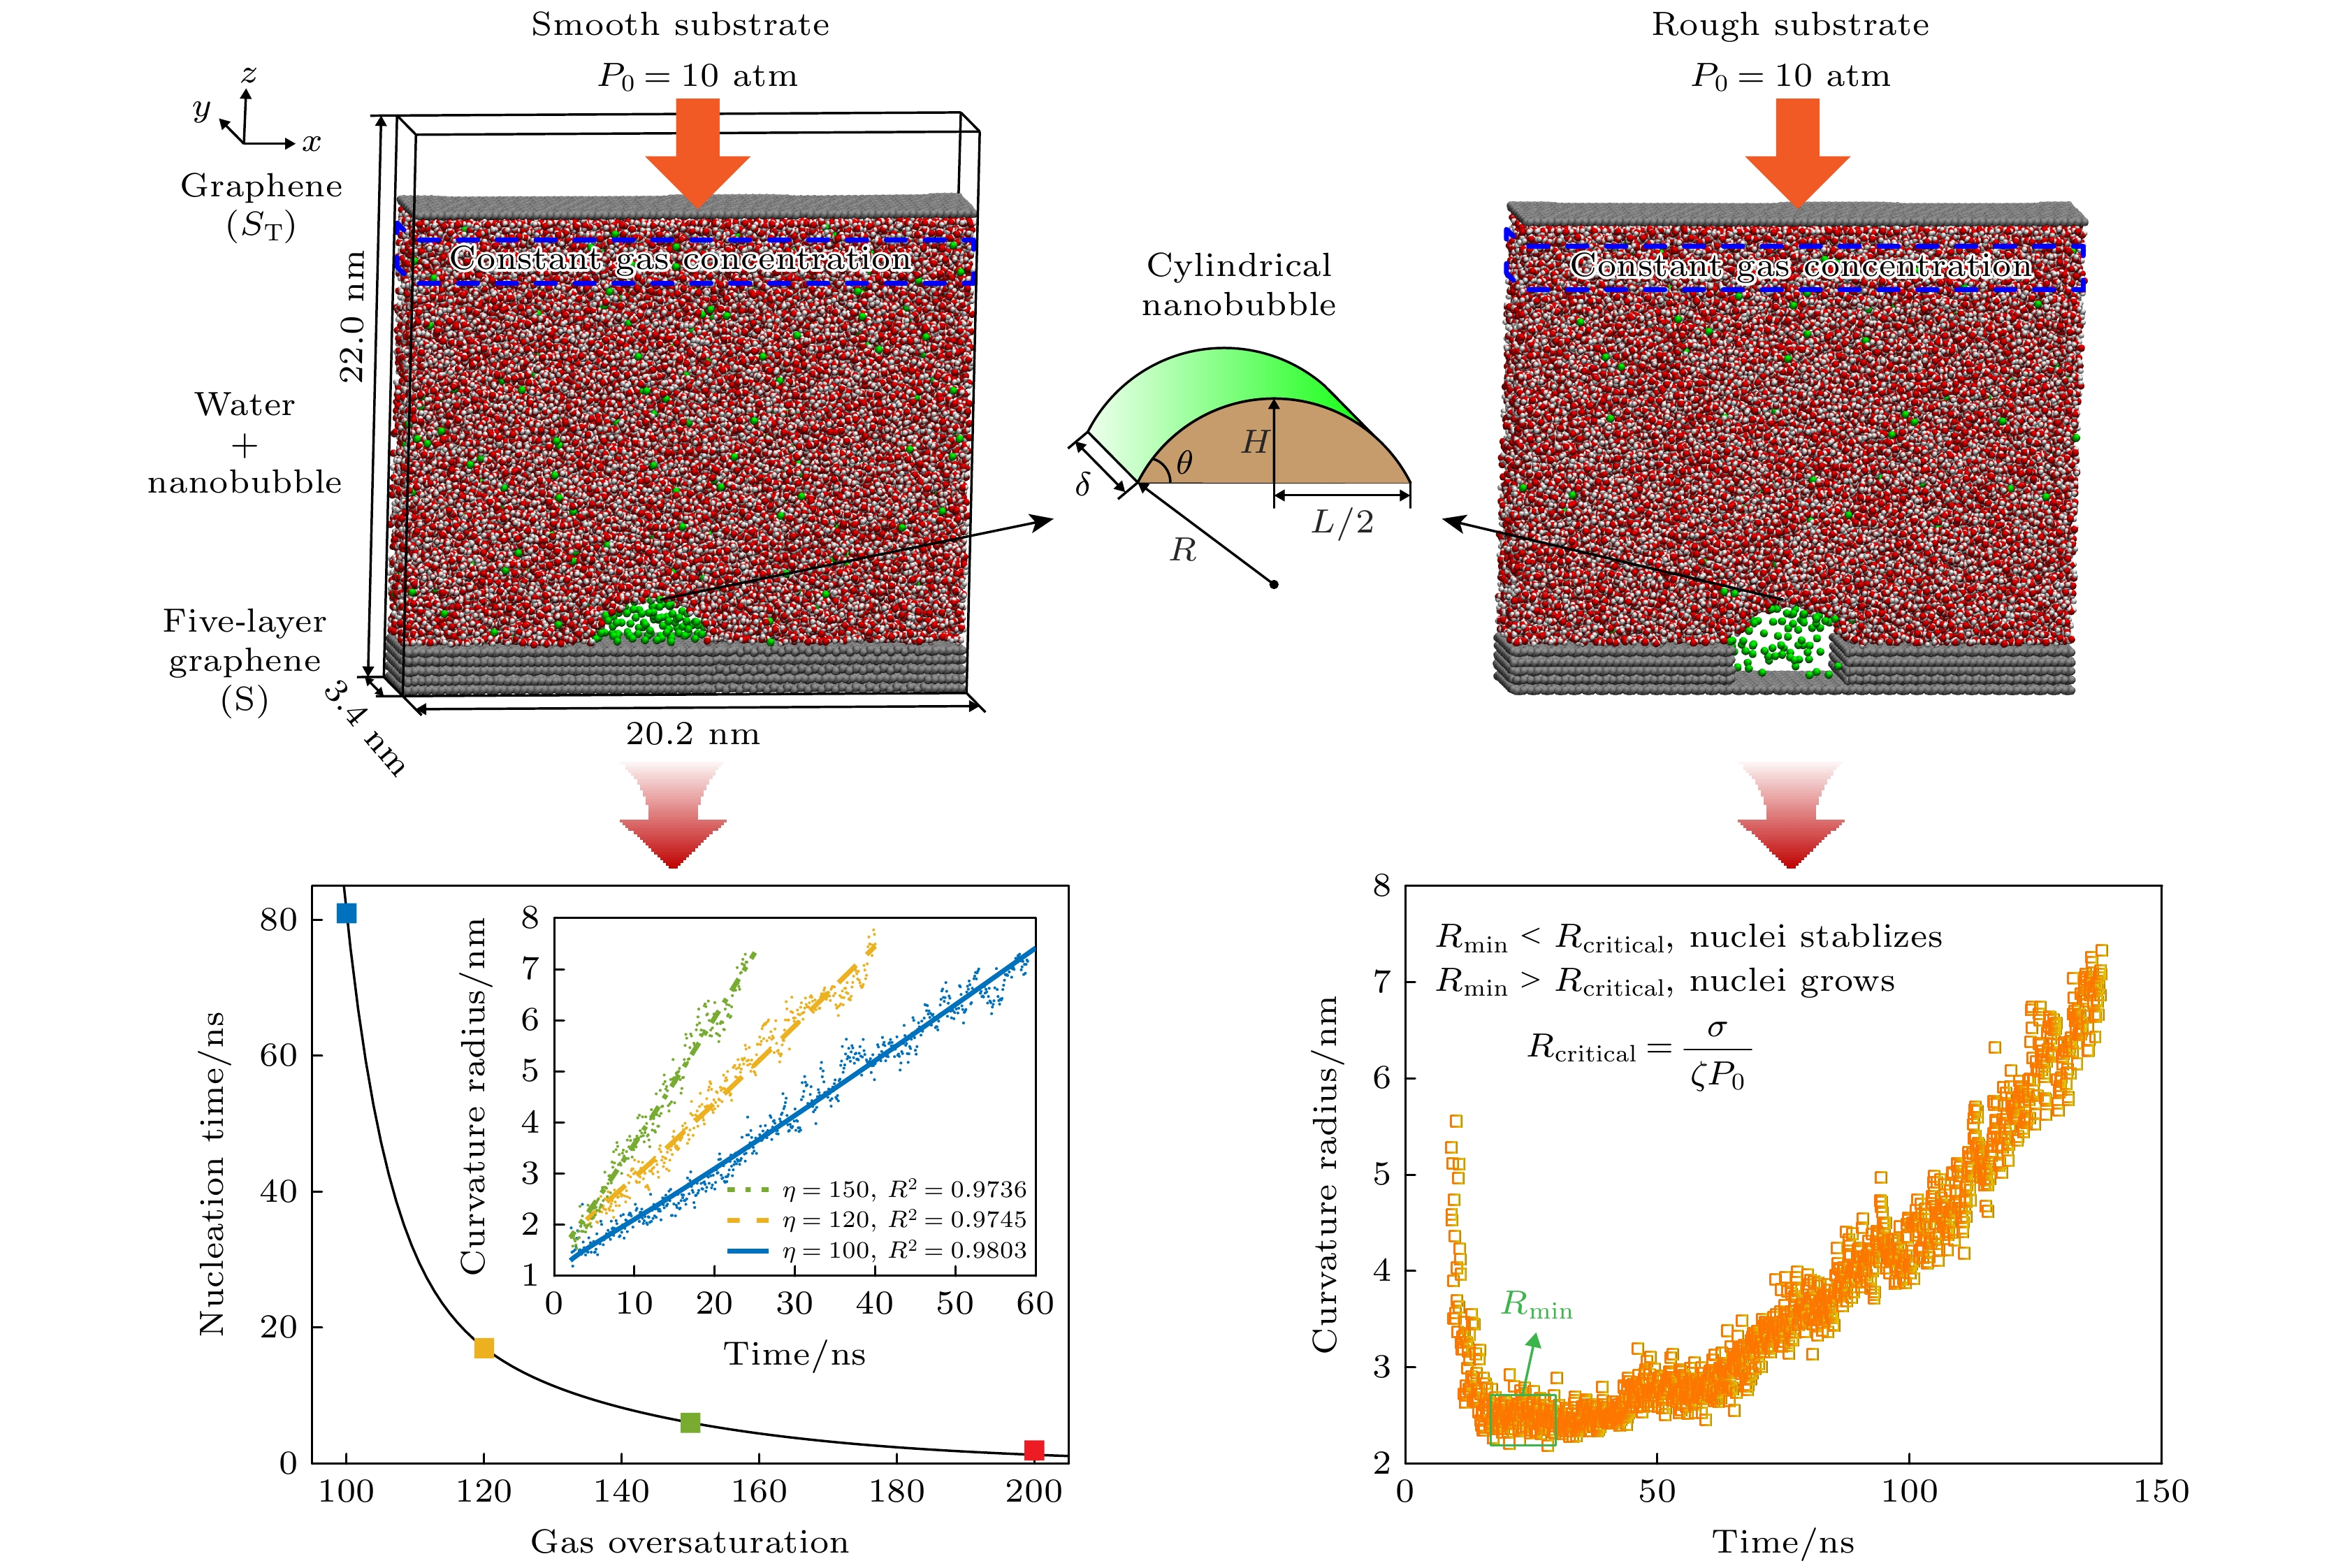
图 1 纳米气泡成核过程模拟模型 (a)光滑表面模型; (b)粗糙表面模型; (c)圆柱形纳米气泡示意图. 图中银色粒子代表固体原子, 绿色代表气体原子, 红色和白色分别代表水分子中的氧原子和氢原子, 1 atm = 1.013×10⁵ Pa
Figure 1. Simulation model of the nanobubble nucleation process: (a) Smooth surface model; (b) rough surface model; (c) schematic diagram of cylindrical nanobubbles, the silver beads represent solid atoms, the green beads represent gas atoms, and the red and white beads represent oxygen and hydrogen atoms of the water molecule, respectively. 1 atm = 1.013×10⁵ Pa.
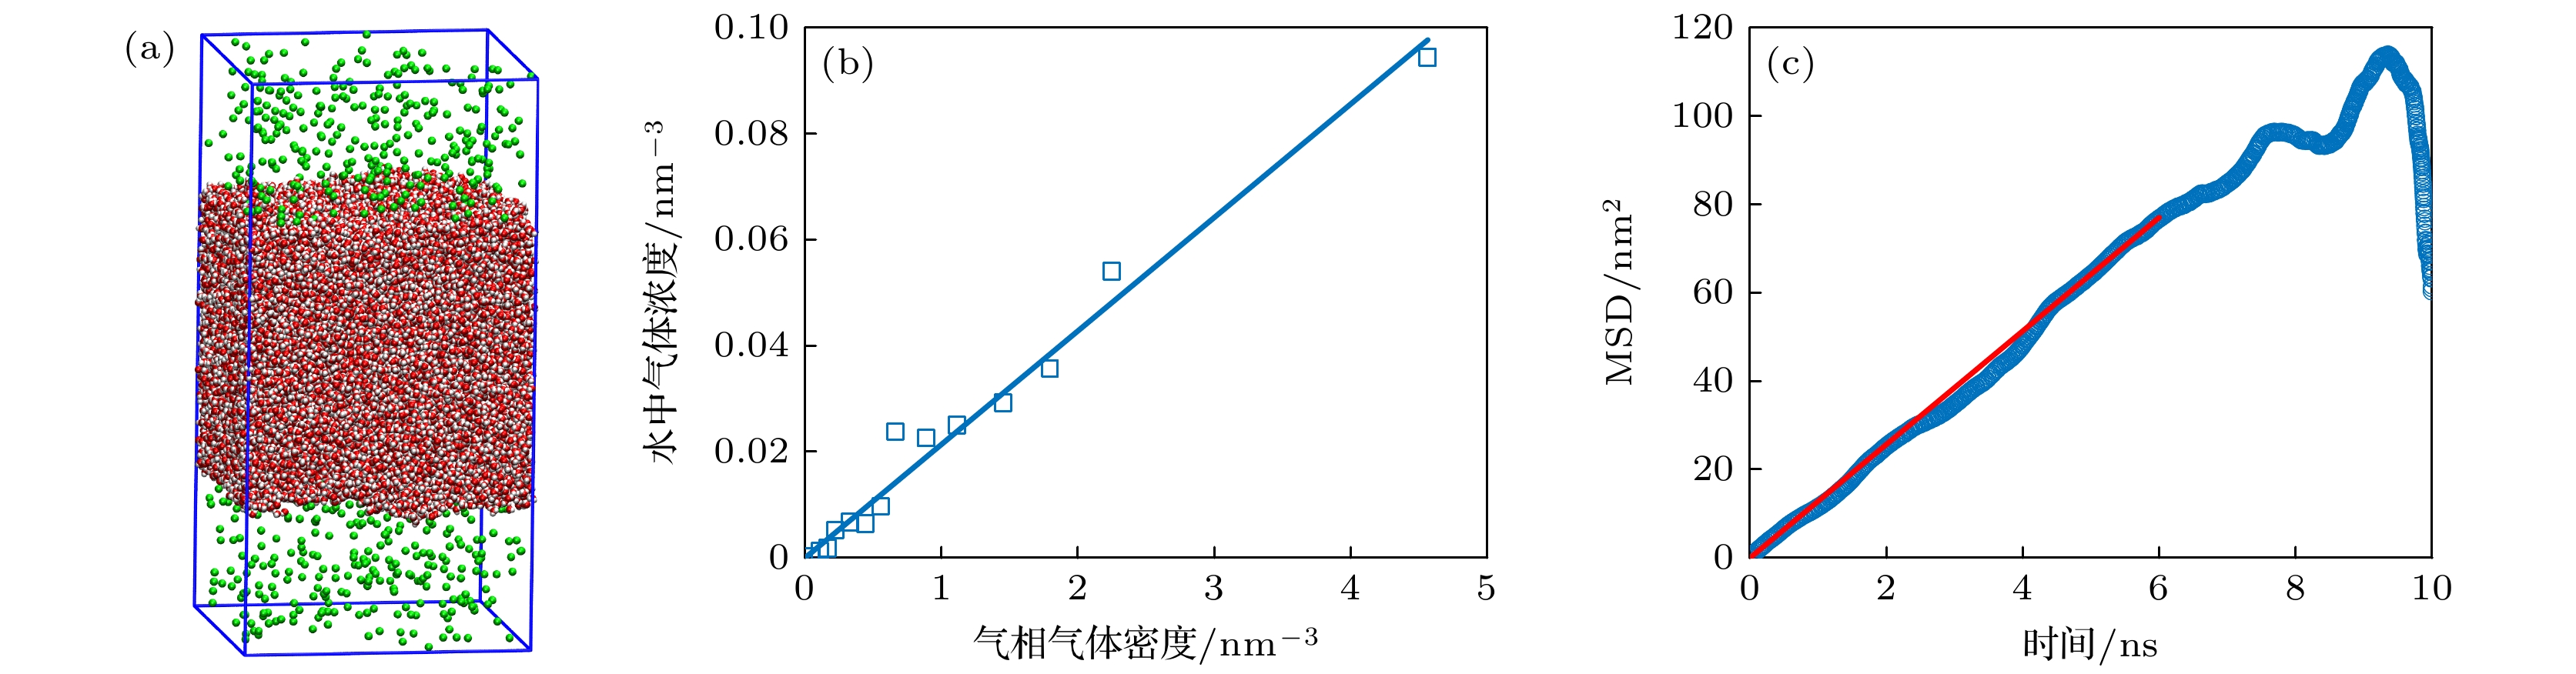
图 2 气体溶解度与扩散系数模拟 (a)气体溶解度模拟模型; (b)水中气体浓度与气相气体浓度间线性关系拟合; (c)气体在水中均方根位移与时间t间关系
Figure 2. Simulation of gas solubility and diffusion coefficient: (a) Simulation model of gas solubility; (b) linear fitting of the relationship between gas concentration in water and gas concentration in the gas phase; (c) relationship between the mean square displacement (MSD) of gas in water and time t.
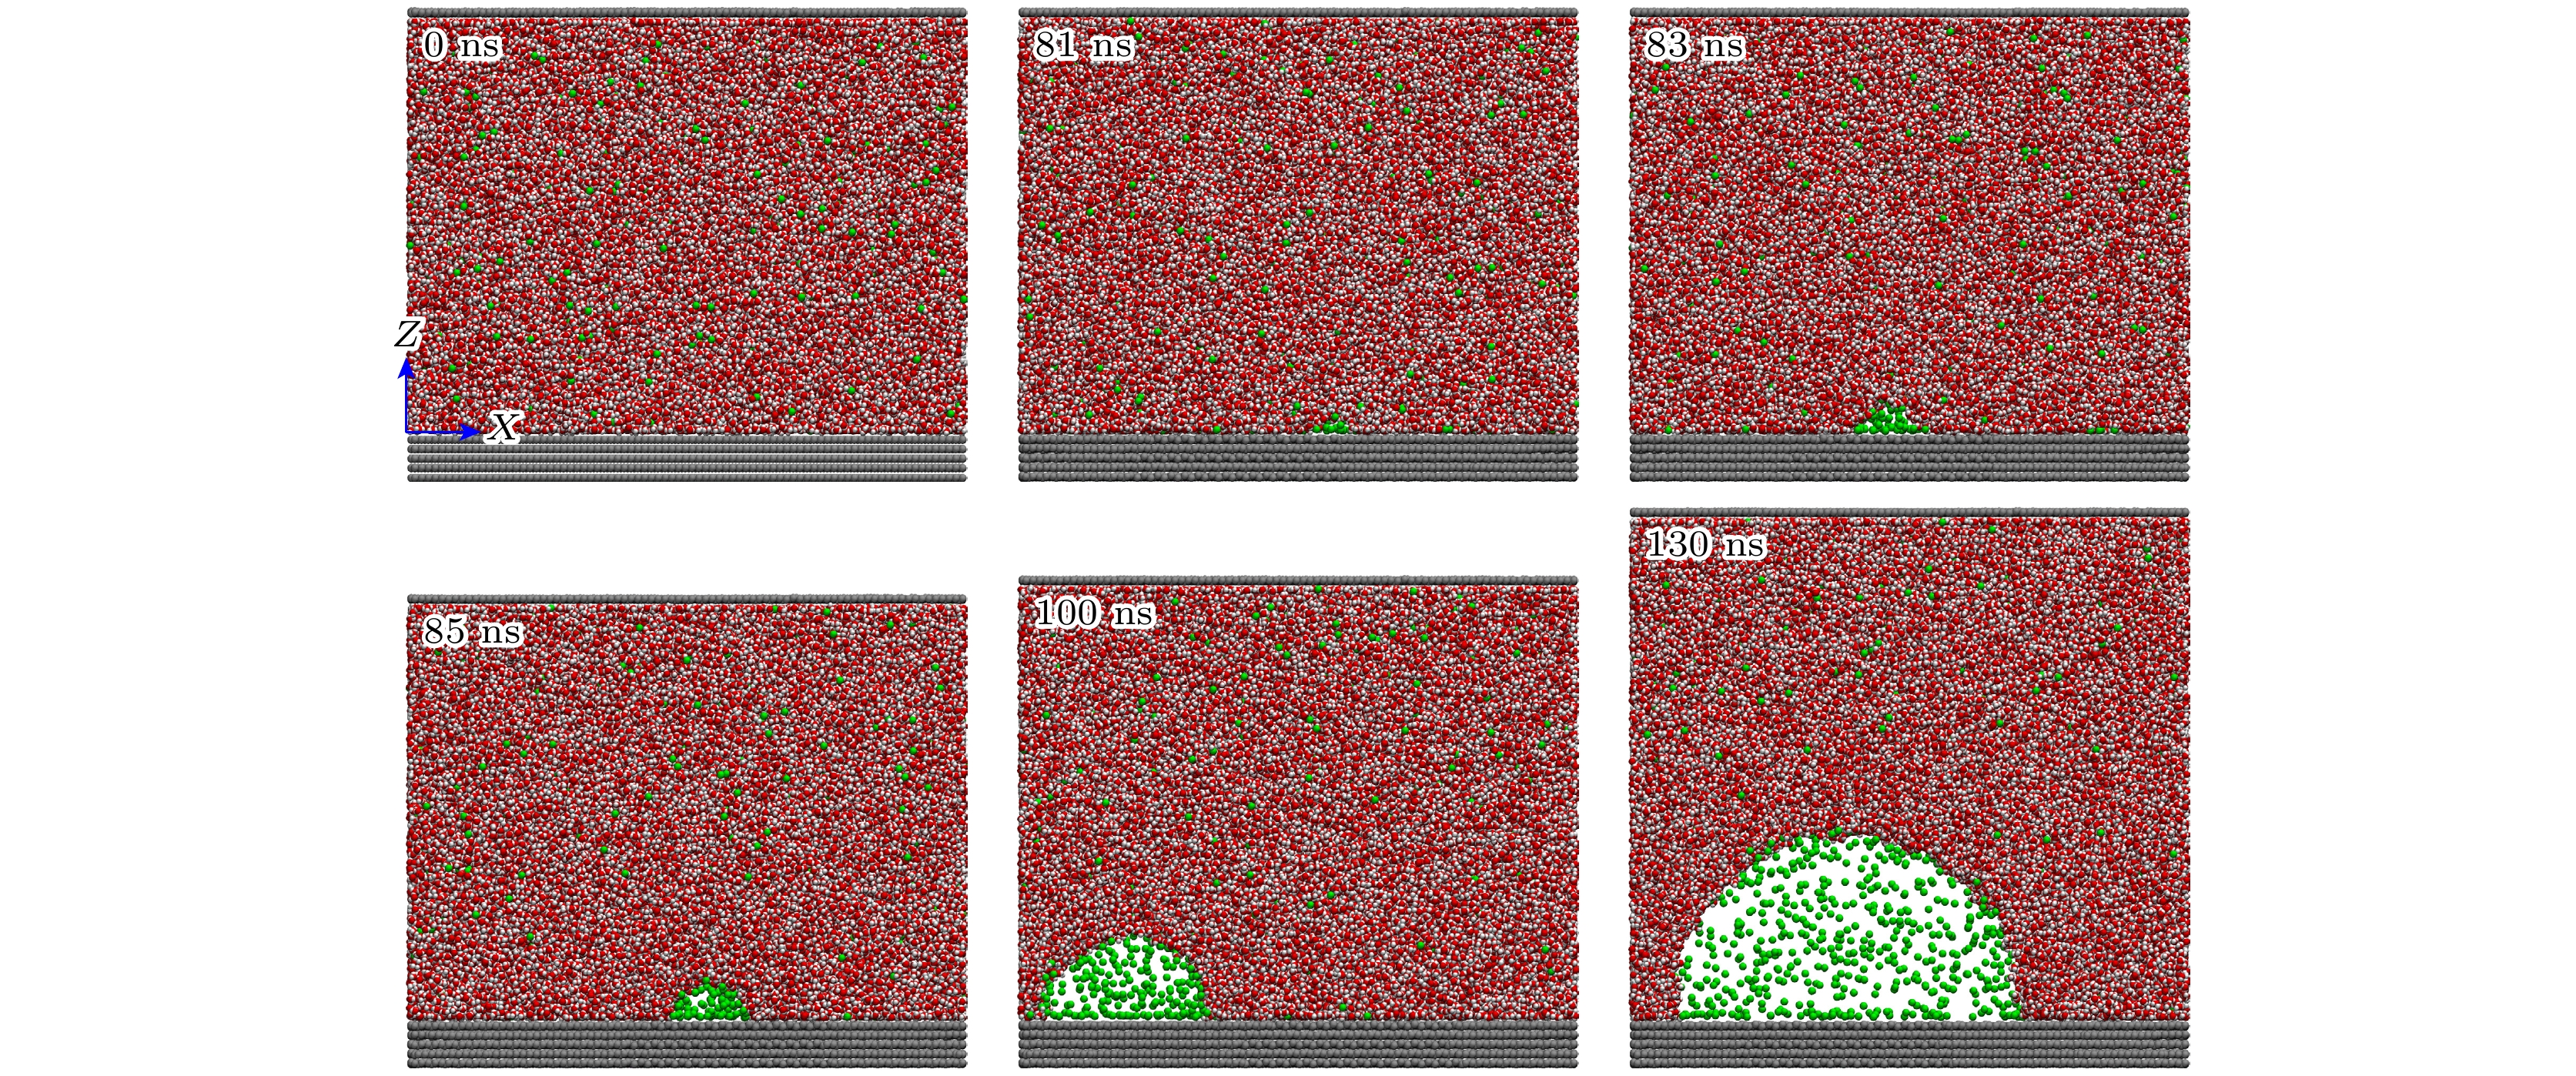
图 3 光滑均质表面上气体过饱和度为100时纳米气泡成核过程, 银色粒子代表固体原子, 绿色代表气体原子, 红色和白色分别代表水分子中的氧原子和氢原子, 分别展示了0, 81, 83, 85 , 100, 130 ns时的快照, 0 ns时气体分子均匀分布在体相液体中, 81 ns时固-液界面出现较小的气体聚集体, 83 ns时气体聚集体明显长大, 85 ns时气体聚集体呈现出纳米气泡形状, 100 ns和130 ns时气泡正在快速生长
Figure 3. Nucleation process of nanobubbles on a smooth homogeneous surface under a gas supersaturation of 100, in the figure, the silver beads represent solid atoms, the green beads represent gas atoms, and the red and white beads represent oxygen and hydrogen atoms of the water molecule, respectively, snapshots are shown at0, 81, 83, 85 , 100, and 130 ns. At 0 ns, gas molecules are uniformly distributed in the bulk liquid. By 81 ns, a small gas aggregate appears at the solid-liquid interface, at 83 ns, the gas aggregate has grown significantly, and by 85 ns, it has taken on a nanobubble shape, at 100 ns and 130 ns, the nanobubble is rapidly expanding.
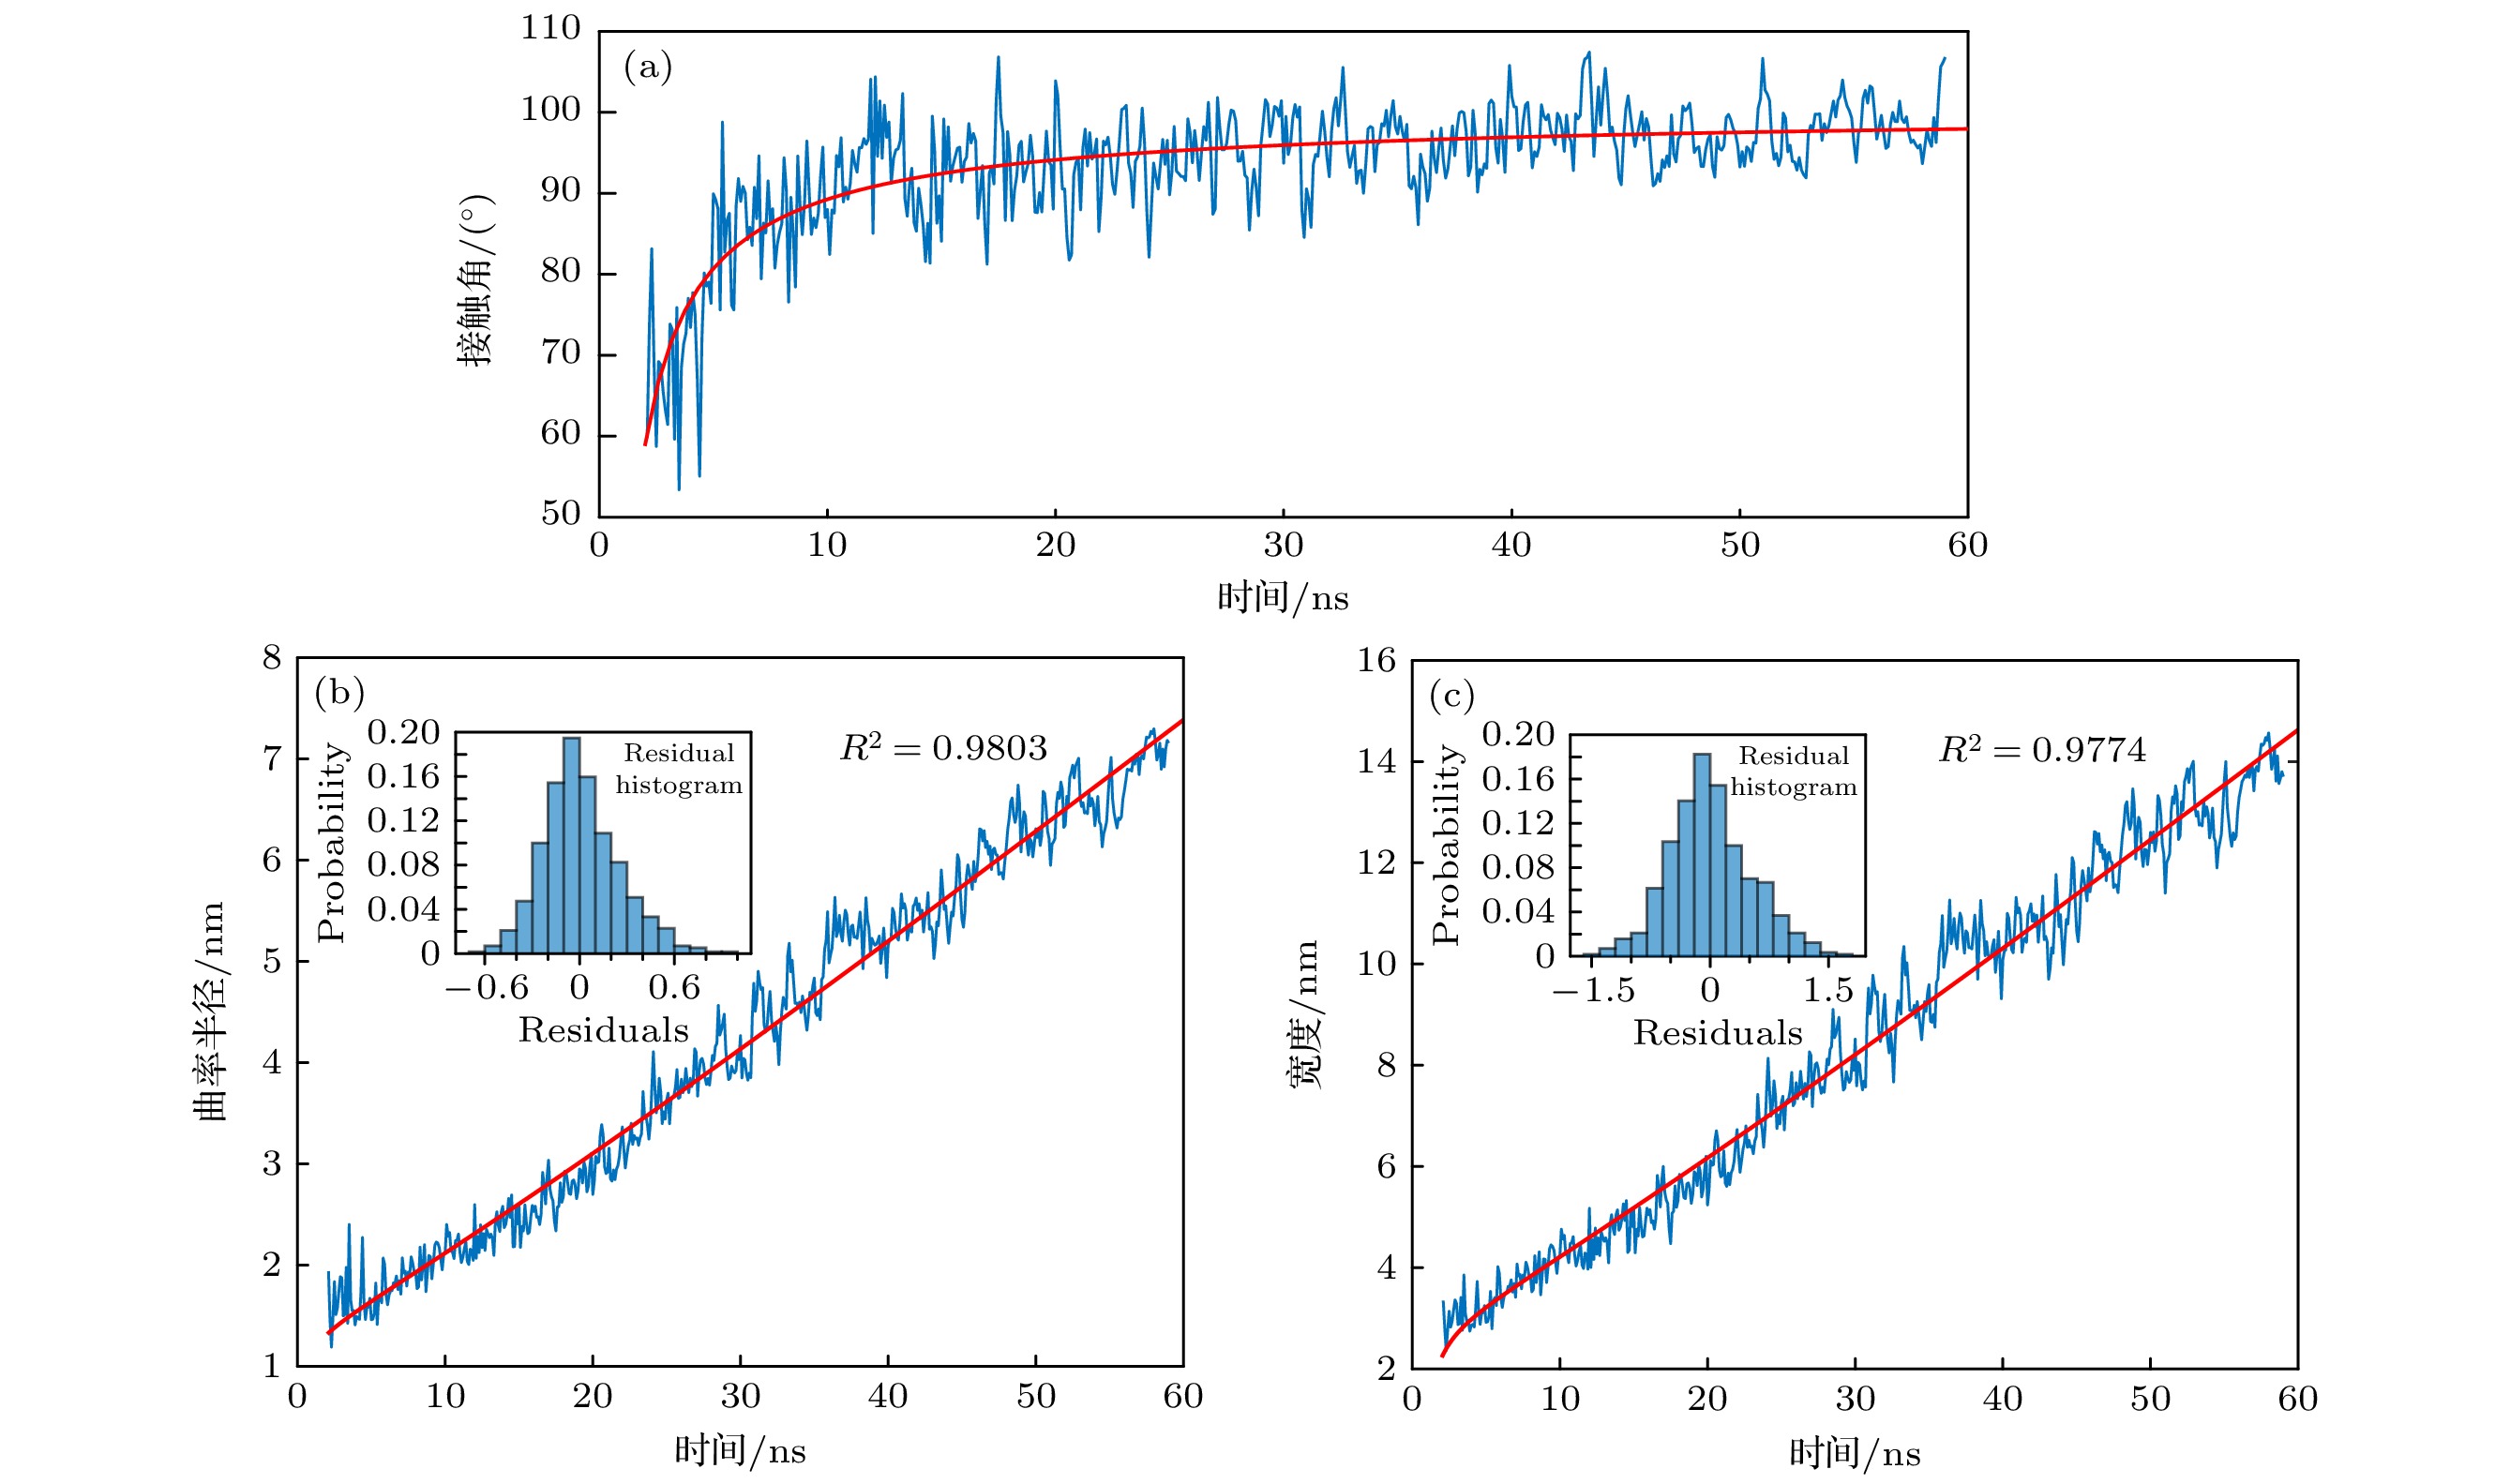
图 4 光滑均质表面上气体过饱和度为100纳米气泡几何特征随时间的演化过程 (a)接触角随时间的变化; (b)曲率半径随时间的变化; (c)宽度随时间的变化. 其中蓝色曲线表示模拟数据, 红色曲线为拟合曲线, 插图为残差直方图
Figure 4. Evolution of the geometric characteristics of a nanobubble over time on a smooth, homogeneous surface with a gas supersaturation of 100: (a) Changes in contact angle over time; (b) changes in curvature radius over time; (c) changes in width over time, where the blue curve represents the simulation data, while the red curve represents the fitted curve, the inset shows the residual histogram.
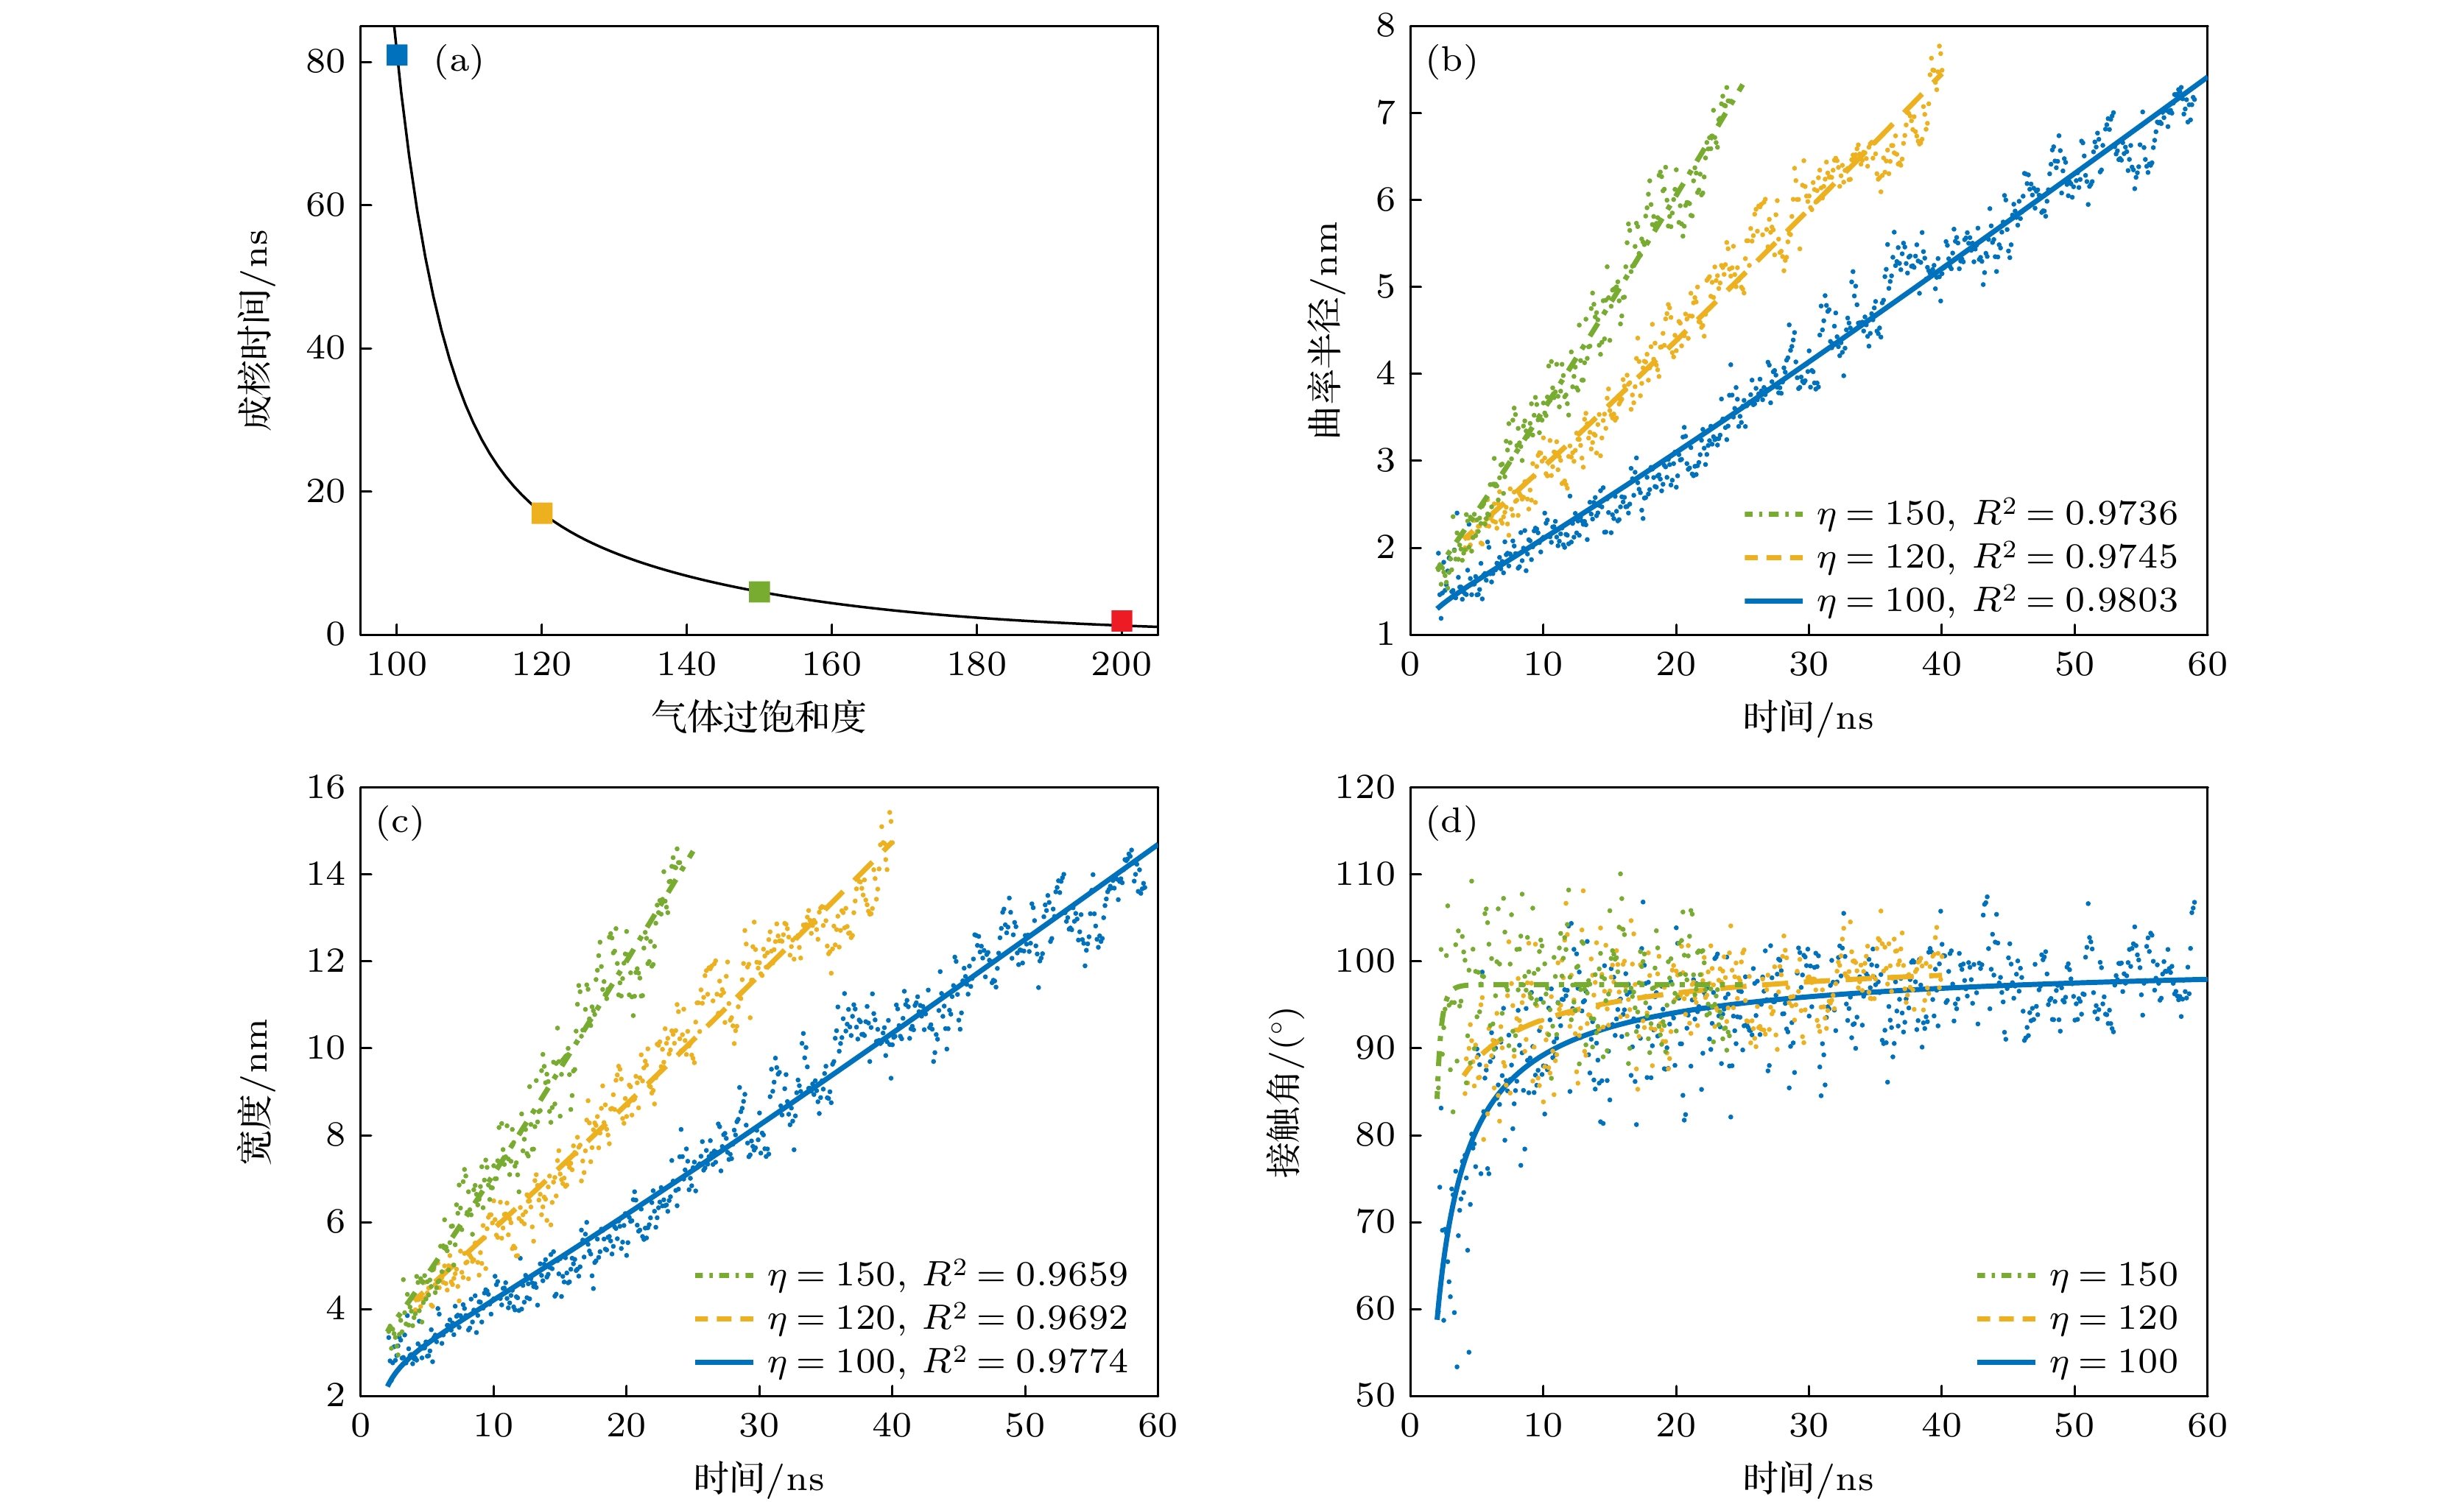
图 5 气体过饱和度对光滑表面上纳米气泡成核动力学的影响 (a)纳米气泡成核所需时间与气体过饱和度的关系; (b)纳米气泡曲率半径随时间的演化; (c)纳米气泡宽度随时间的演化; (d)纳米气泡接触角(气体一侧)随时间的演化
Figure 5. Effect of gas supersaturation on the nucleation kinetics of nanobubbles on a smooth surface: (a) Relationship between the nucleation time of nanobubbles and gas supersaturation; (b) evolution of nanobubble curvature radius over time; (c) evolution of nanobubble width over time; (d) evolution of nanobubble contact angle (on the gas side) over time.
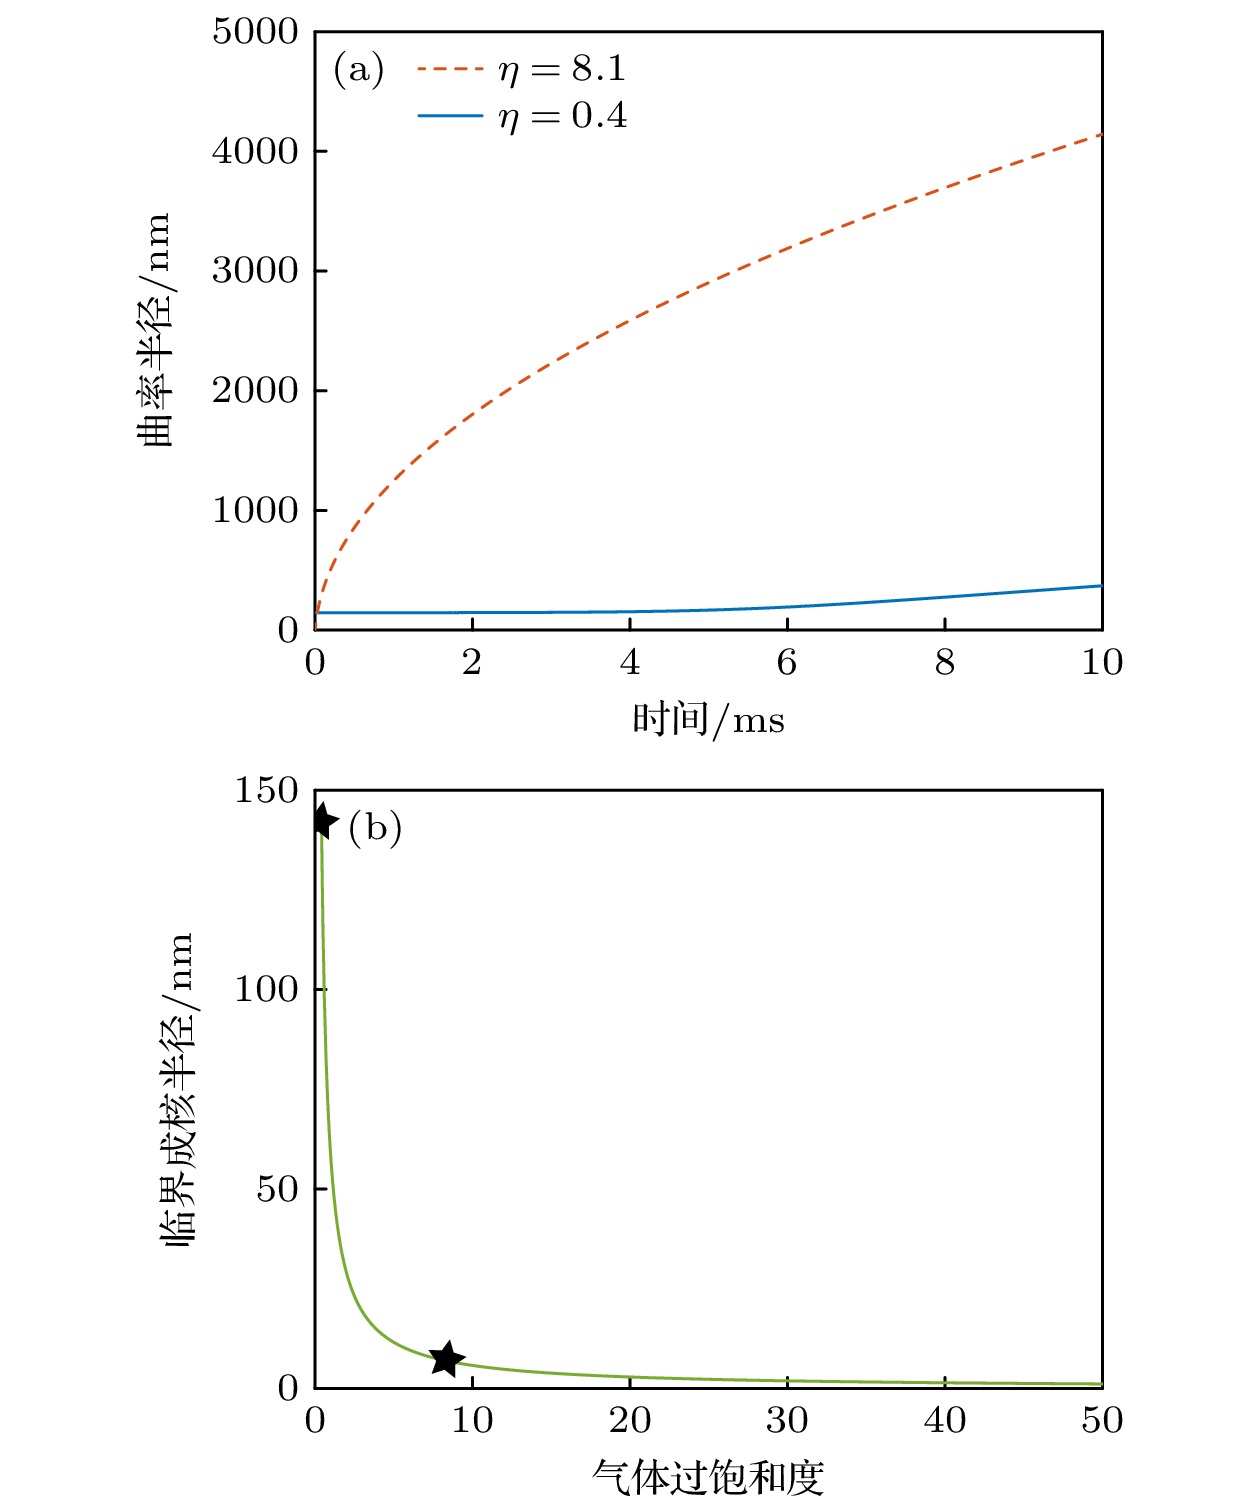
图 6 理论模型预测 (a)温差法和醇水替换法条件下纳米气泡曲率半径随时间的演化; (b)临界成核半径随气体过饱和的变化
Figure 6. The theoretical model predicts: (a) The evolution of the curvature radius of nanobubbles over time under the conditions of the temperature difference method and alcohol-water exchange method; (b) the variation of the critical nucleation radius with gas supersaturation.
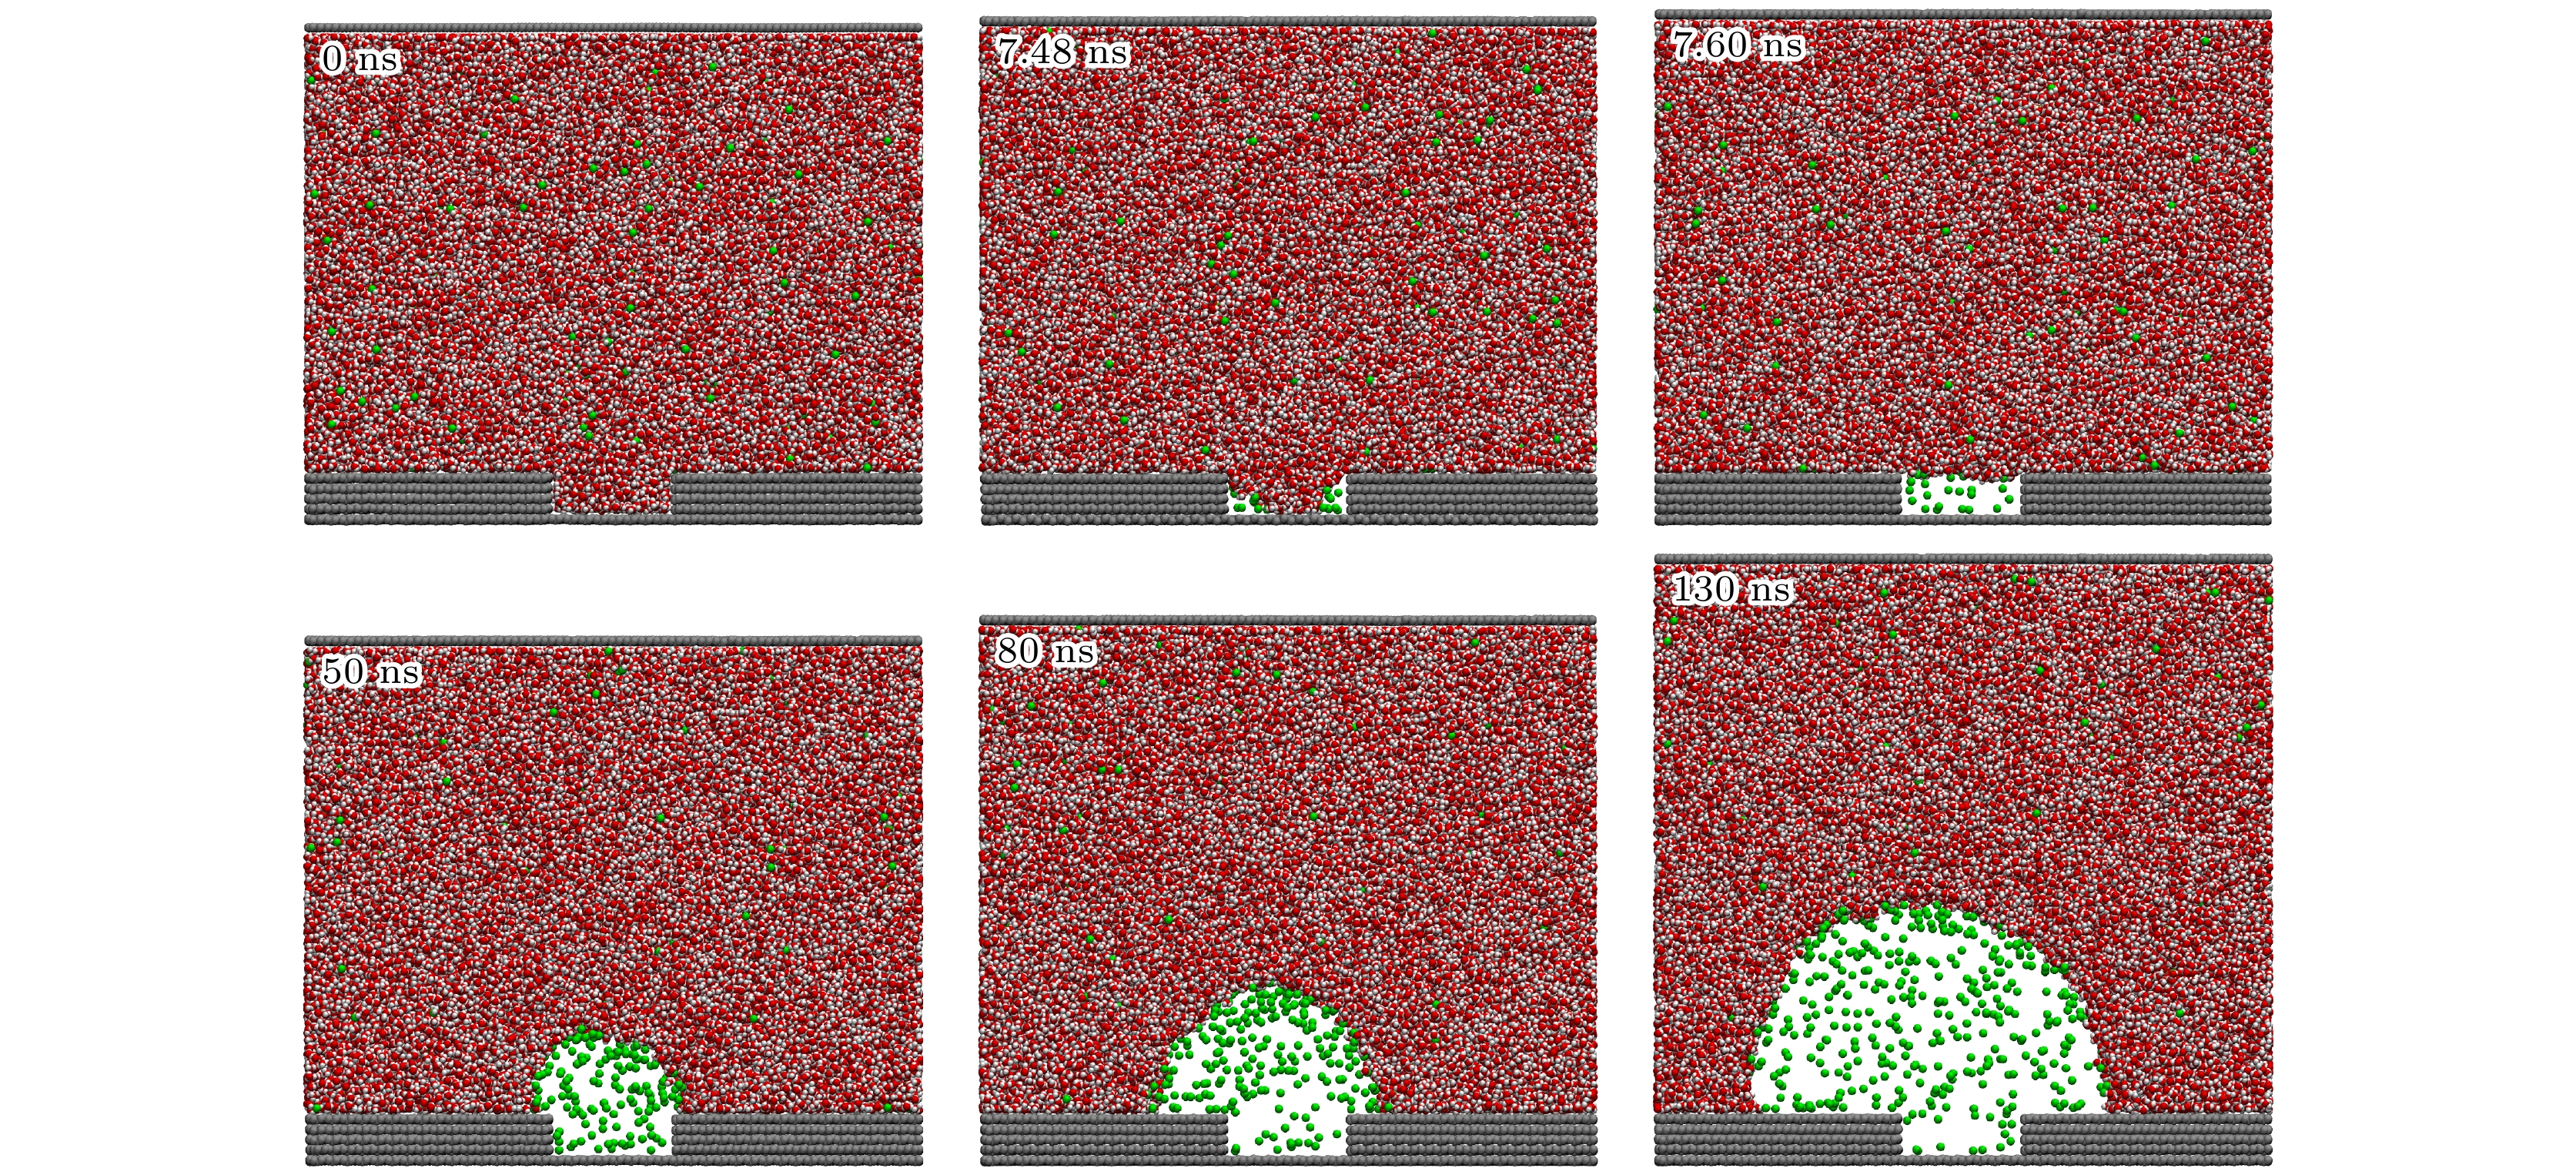
图 7 粗糙表面气体过饱和度为50时纳米气泡成核微观过程, 在固体表面中部设置了一个凹坑, 其宽度4 nm, 深度1.34 nm, 分别展示了0, 7.48, 7.6, 50, 80, 130 ns时的快照, 0 ns时气体分子均匀分布在体相液体中, 7.48 ns时凹坑下边缘出现气体聚集体, 并在随后的0.12 ns内气体聚集体将凹坑完全填充, 从7.6 ns到50 ns凹坑中的纳米气泡的宽度被钉扎, 而高度显著增加, 到80 ns时纳米气泡已摆脱钉扎, 其高度和宽度均增加, 到130 ns时纳米气泡继续以无钉扎模式生长
Figure 7. Microscopic process of nanobubble nucleation on a rough surface at a gas supersaturation level of 50, a pit is created in the center of the solid surface, with a width of 4 nm and a depth of 1.34 nm, snapshots are shown at 0, 7.48, 7.6, 50, 80, and 130 ns. At 0 ns, gas molecules are uniformly distributed in the bulk liquid. At 7.48 ns, two gas clusters appear along the lower edges of the pit, and within the next 0.12 ns, the gas cluster fills the pit completely. From 7.6 ns to 50 ns, the width of the nanobubble within the pit is pinned, while its height increases significantly. By 80 ns, the nanobubble detaches from the pinning, with both its height and width increasing. At 130 ns, the nanobubble continues to grow in an unpinned mode.
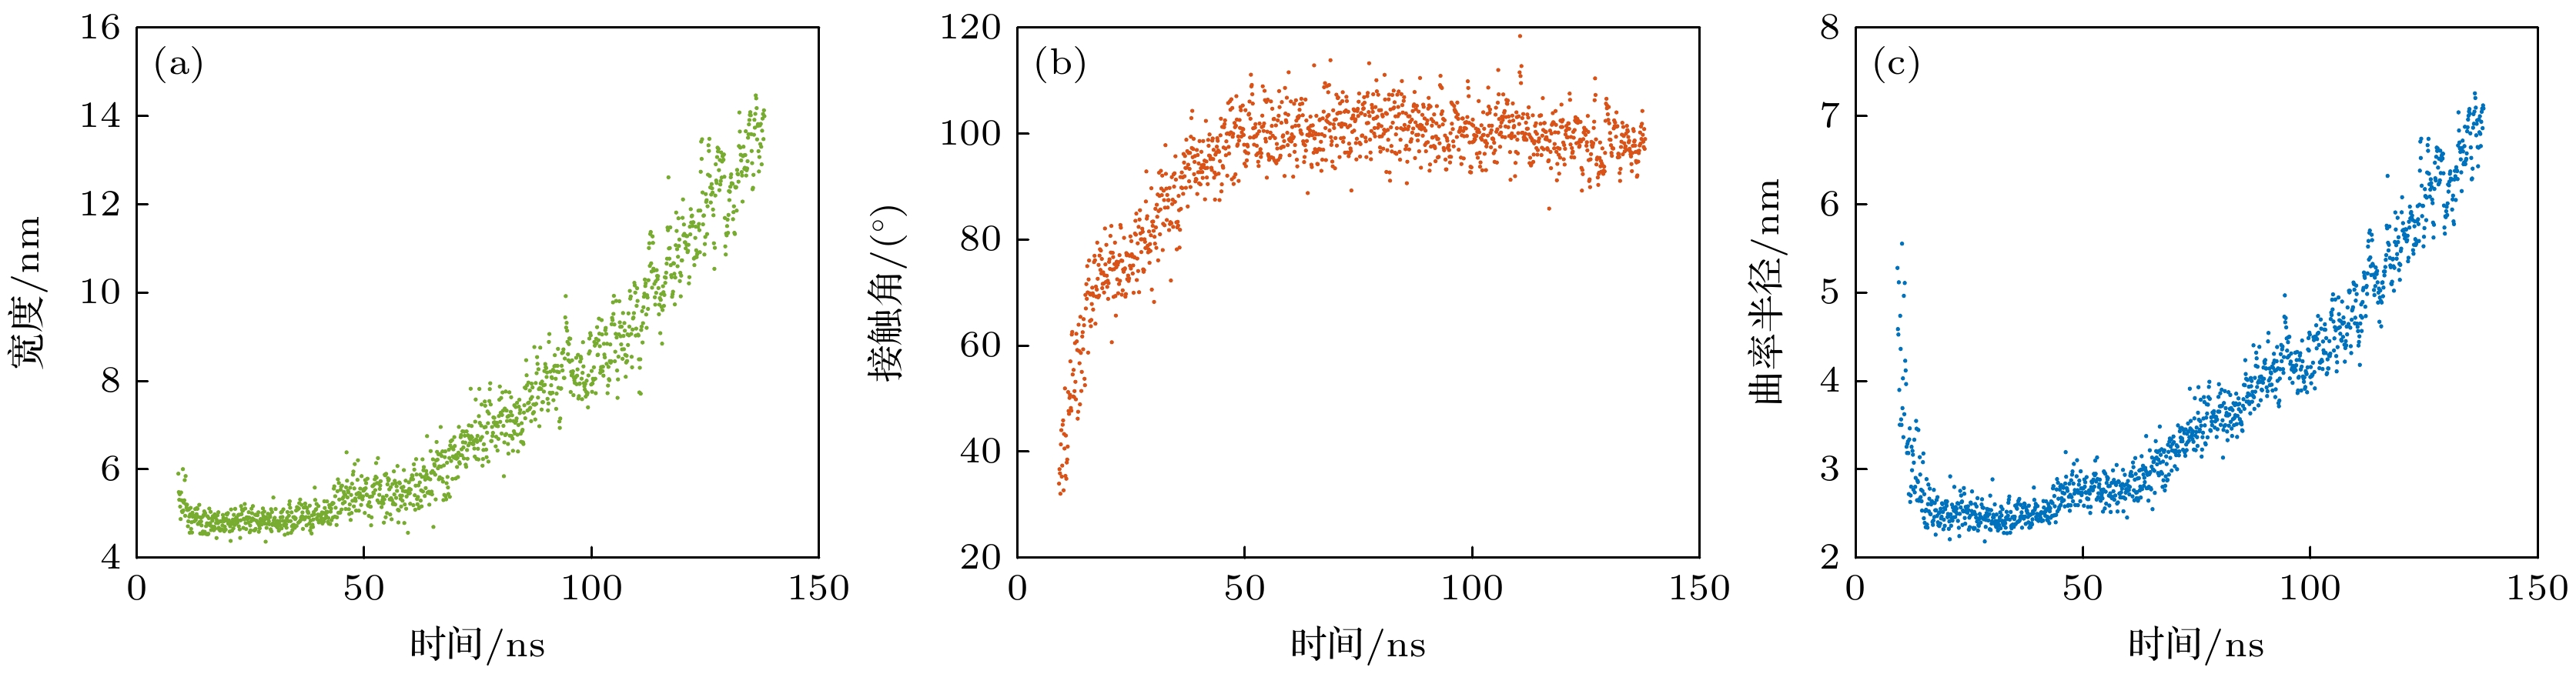
图 8 凹坑宽度4 nm粗糙表面上气体过饱和度为50时纳米气泡几何特征随时间的演化 (a)宽度随时间的变化; (b)接触角随时间的变化; (c)曲率半径随时间的变化
Figure 8. Evolution of nanobubble geometric characteristics over time on a rough surface with a pit width of 4 nm at a gas supersaturation level of 50: (a) Variation of width over time; (b) variation of contact angle over time; (c) variation of curvature radius over time.
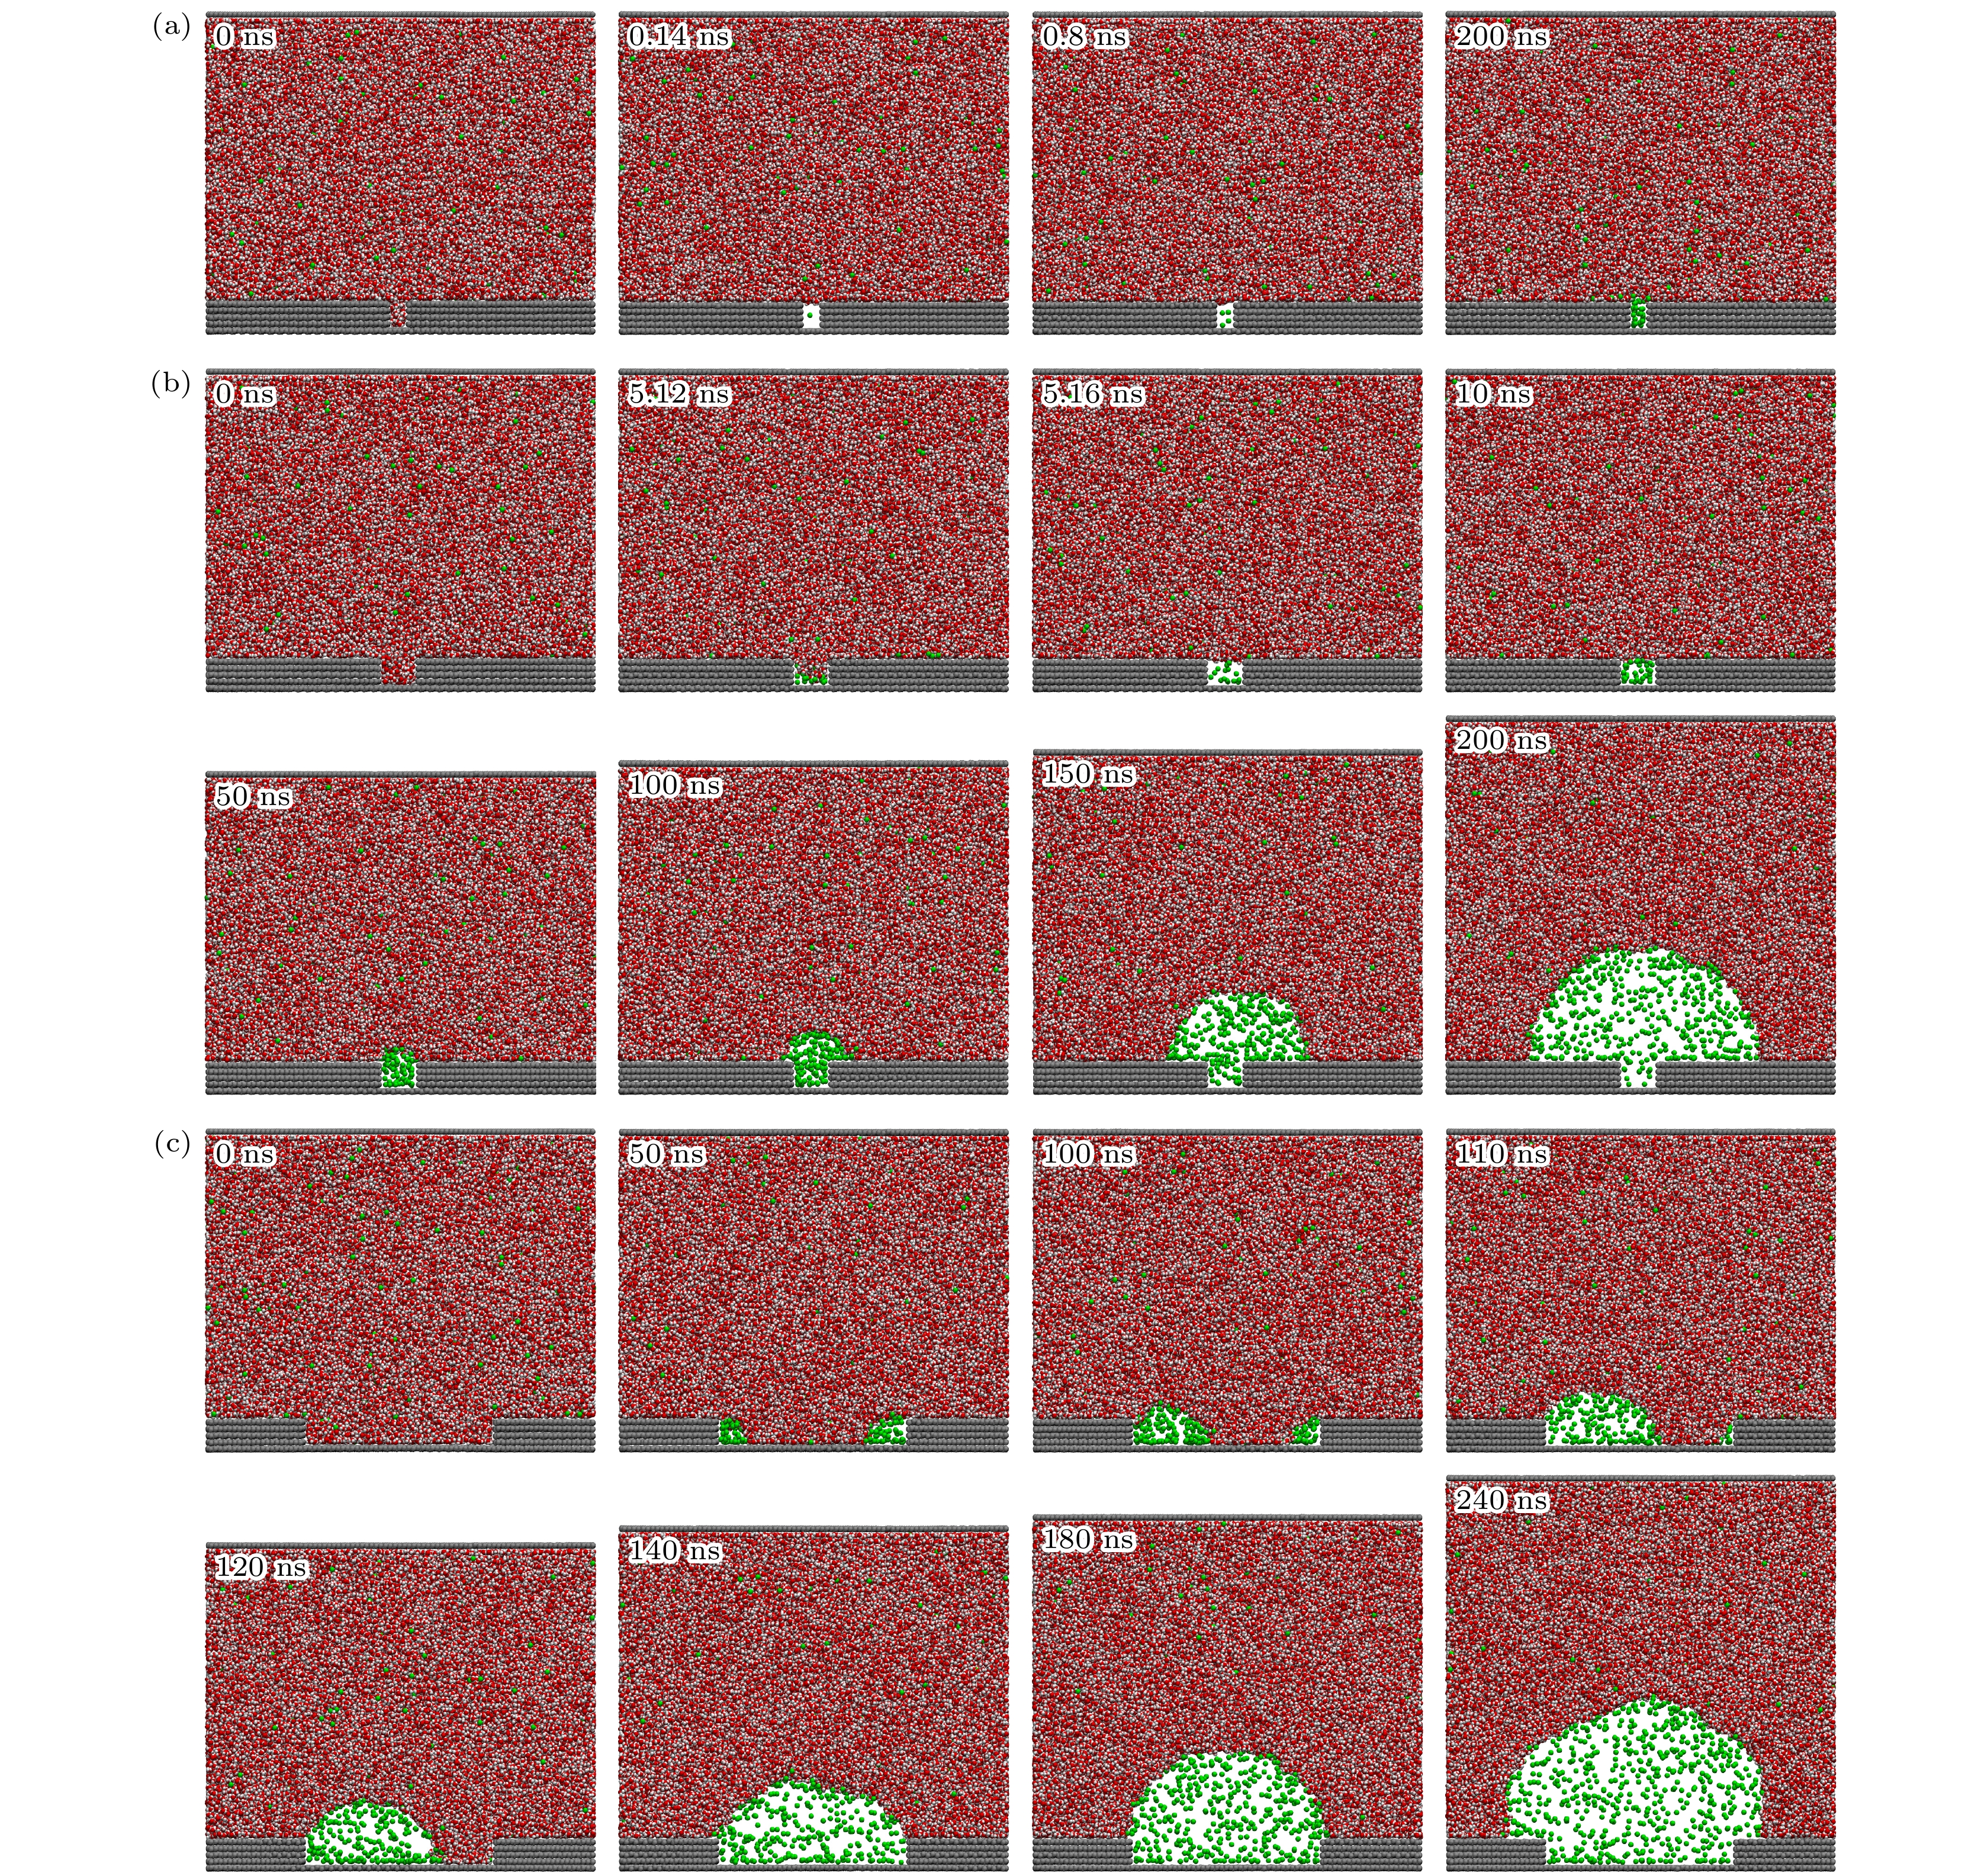
图 9 气体过饱和度为50时凹坑尺寸对纳米气泡成核的影响 (a)凹坑宽度1 nm, 0 ns时气体均匀分布在液相中, 0.14 ns时凹坑已被气相完全填充, 0.8 ns时气体分子逐渐进入凹坑气核中, 200 ns时凹坑气核中聚集了更多气体分子, 但气核未生长为纳米气泡; (b)凹坑宽度2 nm, 在5.12 ns时凹坑中形成气体聚集体, 在5.16 ns时凹坑被气相完全填充, 10 ns时凹坑气核中聚集了更多气体分子, 50 ns时凹坑气核高度增大, 形成凸起, 100 ns时凹坑气核挣脱凹坑, 生长为纳米气泡, 在150 ns和200 ns时纳米气泡以无钉扎模式快速生长; (c)凹坑宽度10 nm, 在50 ns时凹坑底部形成2个气体聚集体, 100 ns, 110 ns和120 ns时1个气体聚集体显著增大, 另一个气体聚集体在奥斯瓦尔德效应下逐渐缩小直至消失, 140 ns时纳米气泡完全占据凹坑, 180 ns时纳米气泡宽度被凹坑边缘钉扎, 高度逐渐增大, 240 ns时纳米气泡挣脱凹坑束缚, 以无钉扎模式增长
Figure 9. The effect of pit size on nanobubble nucleation at a gas supersaturation of 50: (a) Pit width of 1 nm, at 0 ns, the gas is uniformly distributed in the liquid phase, at 0.14 ns, the pit is fully filled with the gas phase, at 0.8 ns, gas molecules gradually enter the gas nucleus in the pit. At 200 ns, more gas molecules have accumulated in the pit's gas nucleus, but the gas nucleus has not yet grown into a nanobubble. (b) Pit width of 2 nm. At 5.12 ns, a gas aggregate forms in the pit, at 5.16 ns, the pit is fully filled with the gas phase, at 10 ns, more gas molecules accumulate in the gas nucleus in the pit, at 50 ns, the height of the gas nucleus increases, forming a protrusion. At 100 ns, the gas nucleus escapes from the pit and grows into a nanobubble, at 150 ns and 200 ns, the nanobubble grows rapidly in a non-pinned mode. (c) Pit width of 10 nm. At 50 ns, two gas aggregates form at the bottom of the pit, at 100 ns, 110 ns, and 120 ns, one of the gas aggregates significantly increases in size, while the other gradually shrinks and disappears due to the Ostwald effect, at 140 ns, the nanobubble fully occupies the pit, at 180 ns, the width of the nanobubble is pinned by the pit edge, and the height gradually increases, at 240 ns, the nanobubble escapes the pit's confinement and grows in a non-pinned mode.
表 1 分子动力学模拟中各原子类型参数
Table 1. L-J parameters of the different atoms used in molecular dynamics simulation.
i-j σ/nm ε/(kJ·mol–1) 电荷/e N-N 0.3698 0.7899 0 Ow-Ow 0.3166 0.6502 –0.8476 Hw-Hw 0 0 0.4238 Ow-N 0.3285 0.8050 0 S-N 0.3549 0.4661 0 S-Ow 0.3367 0.4247 0 ST-N 0.3549 0.4661 0 ST-Ow 0.3367 0.5946 0  下载: 导出CSV
-
[1] Parker J L, Claesson P M, Attard P 1994 J. Phys . Chem. 98 8468 [2] 杨海昌, 郭涵, 邢耀文, 桂夏辉, 曹亦俊 2022 煤炭学报 47 2455 doi: 10.13225/j.cnki.jccs.FX21.1147 Yang H C, Guo H, Xing Y W, Gui X H, Cao Y J 2022 J. China Coal Soc. 47 2455 doi: 10.13225/j.cnki.jccs.FX21.1147 [3] 包西程, 邢耀文, 张凡凡, 张德轲, 刘秦杉, 杨海昌, 桂夏辉 2024 物理学报 73 036801 doi: 10.7498/aps.73.20231109 Bao X C, Xing Y W, Zhang F F, Zhang D K, Liu Q S, Yang H C, Gui X H 2024 Acta Phys. Sin. 73 036801 doi: 10.7498/aps.73.20231109 [4] 邢耀文, 杨海昌, 桂夏辉, 曹亦俊 2024 选煤技术 52 1 doi: 10.16447/j.cnki.cpt.2024.04.001 Xing Y W, Yang H C, Gui X H, Cao Y J 2024 Coal Prep. Technol. 52 1 doi: 10.16447/j.cnki.cpt.2024.04.001 [5] Ebina K, Shi K, Hirao M, et al. 2013 PloS one 8 e65339 doi: 10.1371/journal.pone.0065339 [6] Sang H, Jiao X, Wang S, Guo W, Salahou M, Liu K 2018 Plant Soil Environ. 64 297 doi: 10.17221/240/2018-PSE [7] Batagoda J, Aluthgun Hewage S, Meegoda J 2019 J. Environ. Eng. Sci. 14 1 doi: 10.1680/jenes.2018.14.1.1 [8] Xia Z, Hu L, Kusaba S, Song D 2019 Proceedings of the 8th International Congress on Environmental Geotechnics 1 796 doi: 10.1007/978-981-13-2221-1_90 [9] Liu G, Craig V S 2009 ACS Appl. Mater. Interfaces 1 481 doi: 10.1021/am800150p [10] Zhu J, An H J, Alheshibri M, Liu L D, Terpstra P, Liu G M, Craig V S J 2016 Langmuir 32 11203 doi: 10.1021/acs.langmuir.6b01004 [11] Yang H, Zeng B, Zhang X, Xing Y, Gui X H, Cao Y 2023 Phys. Fluids 35 032108 doi: 10.1063/5.0141614 [12] Zimmerman W B, Tesař V, Bandulasena H 2011 Curr. Opin. Colloid Interface Sci. 16 350 doi: 10.1016/j.cocis.2011.01.010 [13] Ljunggren S, Eriksson J C 1997 Colloids Surfaces A 129 151 [14] Lou S, Ouyang Z, Yi Z, Li X, Hu J, Li M, Yang F 2000 J. Vac. Sci. Technol. B 18 2573 doi: 10.1116/1.1289925 [15] Ishida N, Inoue T, Miyahara M, Higashitani K 2000 Langmuir 16 6377 doi: 10.1021/la000219r [16] 杨海昌 2023 (徐州: 中国矿业大学) Yang H C 2023 Ph. D. Dissertation (Xuzhou: China University of Mining and Technology [17] Karpitschka S, Dietrich E, Seddon J R, Zandvliet H J, Lohse D, Riegler H 2012 Phys. Rev. Lett. 109 066102 doi: 10.1103/PhysRevLett.109.066102 [18] Hain N, Wesner D, Druzhinin S I, Schönherr H 2016 Langmuir 32 11155 doi: 10.1021/acs.langmuir.6b01662 [19] Chan C U, Ohl C D 2012 Phys. Rev. Lett. 109 174501 doi: 10.1103/PhysRevLett.109.174501 [20] Shin D, Park J B, Kim Y J, Kim S J, Kang J H, Lee B, Cho S P, Hong B H, Novoselov K S 2015 Nat. Commun. 6 6068 doi: 10.1038/ncomms7068 [21] Zhang X, Khan A, Ducker W A 2007 Phys. Rev. Lett. 98 136101 doi: 10.1103/PhysRevLett.98.136101 [22] Zhou L, Wang X, Shin H J, et al. 2020 J. Am. Chem. Soc. 142 5583 doi: 10.1021/jacs.9b11303 [23] Ducker W A 2009 Langmuir 25 8907 doi: 10.1021/la902011v [24] Brenner M P, Lohse D 2008 Phys. Rev. Lett. 101 214505 doi: 10.1103/PhysRevLett.101.214505 [25] Lohse D, Zhang X 2015 Phys. Rev. E 91 031003 doi: 10.1103/PhysRevE.91.031003 [26] Tan B H, An H, Ohl C D 2019 Phys. Rev. Lett. 122 134502 doi: 10.1103/PhysRevLett.122.134502 [27] Tan B H, An H J, Ohl C D 2018 Phys. Rev. Lett. 120 164502 doi: 10.1103/PhysRevLett.120.164502 [28] Yang H, Xing Y, Zhang F, Gui X H, Cao Y 2024 Fundamental Res. 4 35 doi: 10.1016/j.fmre.2022.05.005 [29] Wen B, Pan Y, Zhang L, Wang S, Zhou L, Wang C, Hu J 2022 Phys. Rev. Fluids 7 103601 doi: 10.1103/PhysRevFluids.7.103601 [30] Lan L L, Pan Y C, Zhou L M, Kuang H, Zhang L J, Wen B H 2025 J. Colloid. Interf. Sci. 678 322 doi: 10.1016/j.jcis.2024.08.157 [31] Qian J, Craig V S J, Jehannin M 2019 Langmuir 35 718 doi: 10.1021/acs.langmuir.8b03487 [32] Wang X Y, Zhao B Y, Ma W G, Wang Y, Gao X Y, Tai R Z, Zhou X F, Zhang L J 2015 ChemPhysChem 16 1003 doi: 10.1002/cphc.201402854 [33] Hampton M A, Donose B C, Nguyen A V 2008 J. Colloid. Interf. Sci. 325 267 doi: 10.1016/j.jcis.2008.05.044 [34] An H J, Tan B H, Zeng Q, Ohl C D 2016 Langmuir 32 11212 doi: 10.1021/acs.langmuir.6b01531 [35] Zhou L M, Wang S, Qiu J, Wang L, Wang X Y, Li B, Zhang L J, Hu J 2017 Chin. Phys. B 26 106803 doi: 10.1088/1674-1056/26/10/106803 [36] Bouwhuis W, van der Veen R C A, Tran T, et al. 2012 Phys. Rev. Lett. 109 264501 doi: 10.1103/PhysRevLett.109.264501 [37] Zou Z L, Quan N N, Wang X Y, Wang S, Zhou L M, Hu J, Zhang L J, Dong Y M 2018 Chin. Phys. B 27 459 doi: 10.1088/1674-1056/27/8/086803 [38] Mao M, Zhang J, Yoon R H, Ducker W A 2004 Langmuir 20 4310 doi: 10.1021/la040053k [39] Takata Y, Cho J H J, Law B M, Aratono M 2006 Langmuir 22 1715 doi: 10.1021/la052599s [40] Dammer S M, Lohse D 2006 Phys. Rev. Lett. 96 206101 doi: 10.1103/PhysRevLett.96.206101 [41] Weijs J H, Snoeijer J H, Lohse D 2012 Phys. Rev. Lett. 108 104501 doi: 10.1103/PhysRevLett.108.104501 [42] Peng H, Birkett G R, Nguyen A V 2013 Langmuir 29 15266 doi: 10.1021/la403187p [43] Xiao Q X, Liu Y W, Guo Z J, Liu Z P, Lohse D, Zhang X R 2017 Langmuir 33 8090 doi: 10.1021/acs.langmuir.7b01231 [44] Zhang Y, Zhu X, Wood J A, Lohse D 2024 Proceedings of the National Academy of Sciences 121 e2321958121 doi: 10.1073/pnas.2321958121 [45] Yang H C, Jiang H Y, Cheng Y L, Xing Y W, Cao Y J, Gui X H 2024 J. Mol. Liq. 411 125758 doi: 10.1016/j.molliq.2024.125758 [46] 张雪松, 范振忠, 仝其雷, 付沅峰 2024 物理学报 73 204701 doi: 10.7498/aps.73.20241105 Zhang X, Fan Z, Tong Q, Fu Y 2024 Acta Physica Sinica 73 204701 doi: 10.7498/aps.73.20241105 [47] Wang Z L, Yang L, Liu C S, Lin S W 2023 Chin. Phys. B 32 023101 doi: 10.1088/1674-1056/ac786a [48] Yang X D, Yang Q F, Zhou L M, Zhang L J, Hu J 2022 Chin. Phys. B 31 054702 doi: 10.1088/1674-1056/ac464c [49] Páll S, Zhmurov A, Bauer P, Abraham M, Lundborg M, Gray A, Hess B, Lindahl E 2020 J. Chem. Phys. 153 134110 doi: 10.1063/5.0018516 [50] Liu Y, Zhang X 2014 J. Chem. Phys. 141 134702 doi: 10.1063/1.4896937 [51] Epstein P S, Plesset M S 1950 J. Chem. Phys. 18 1505 doi: 10.1063/1.1747520 [52] Enríquez O R, Sun C, Lohse D, Prosperetti A, van der Meer D 2014 J. Fluid Mech. 741 R1 doi: 10.1017/jfm.2013.667 [53] Enríquez O R, Hummelink C, Bruggert G-W, Lohse D, Prosperetti A, van der Meer D, Sun C 2013 Rev. Sci. Instrum. 84 065111 doi: 10.1063/1.4810852 [54] Dietrich E, Zandvliet H J, Lohse D, Seddon J R 2013 J. Phys. Condens. Mat. 25 184009 doi: 10.1088/0953-8984/25/18/184009 [55] Yang H C, Zhang F F, Xing Y W, Gui X H, Cao Y J 2022 Front. Mater. 8 824125 doi: 10.3389/fmats.2021.824125 [56] Zhang F F, Cai H J, Fan G X, Gui X H, Xing Y W, Cao Y J 2024 Colloids Surfaces A 699 134633 doi: 10.1016/j.colsurfa.2024.134633 [57] Li C, Zhang Y, Zhang H 2024 Sep. Purif. Technol. 328 125079 doi: 10.1016/j.seppur.2023.125079 [58] Wang C, Lu Y, Feng D H, Zhou J Y, Li Y F, Zhang H 2023 Tribol. Int. 177 107940 doi: 10.1016/j.triboint.2022.107940 [59] Li D Y, Ji Y T, Zhang Z Q, Li Y 2023 Tribol. Int. 190 109037 doi: 10.1016/j.triboint.2023.109037 [60] Vega-Sanchez C, Peppou-Chapman S, Zhu L, Neto C 2022 Nat. Commun. 13 351 doi: 10.1038/s41467-022-28016-1 [61] Liu G, Wu Z, Craig V S 2008 J. Phys. Chem. C 112 16748 doi: 10.1021/jp805143c -
计量
- 文章访问数: 762
- HTML全文浏览数: 762
- PDF下载数: 6
- 施引文献: 0