
 首页
首页 登录
登录 注册
注册


-
等离子体催化技术通过低温等离子体与催化剂耦合的方式, 可以在接近室温的状态下实现一些常规方法难以进行的化学反应[1,2], 极大提高了化学反应效率[3,4], 在化工合成[5,6]、能源转化[7]以及环境保护[8]等领域具有广泛的应用.
作为一种常用的等离子体催化反应器, 填充床介质阻挡放电(PB-DBD)受到了广泛关注[9–11]. 研究表明, PB-DBD中前后两次放电的传输电荷量基本是相同的, 这与无填充介质阻挡放电(DBD)的情况具有显著区别[12], 表明填充介质的引入能影响反应器的放电特性[13]. 此外, PB-DBD的性能受到反应器结构参数的影响, 当减小电极间距时, 等离子体的电场强度增强, 电子温度和电子密度也升高; 增大阻挡层的介电常数导致电子温度升高, 但电子密度降低[14]. PB-DBD的性能还受到电源参数 (诸如电压、频率和占空比等)的影响[15–19]. 研究还发现, 降低工作气压会引起等离子体的尺度增大[20].
PB-DBD的性能不仅受到以上实验参数的影响, 由于等离子体和催化剂存在相互作用[21], 填充材料的介电常数(εr)[22–24]、填充介质形状[25]、填充珠直径、填充数量和填充位置都会影响PB-DBD的特性[26]. 关于填充材料(不同填充材料对应不同的εr)对PB-DBD的影响, 大量的实验研究和数值模拟表明[27–32], 低εr填充时等离子体尺度更大, 产生连接瞬时阳极和瞬时阴极的微放电, 且微放电工作于沿面流光模式[24]; 在高εr填充时等离子体不会连接两个电极, 而是限制于填充珠间的局部区域, 且局部放电工作于丝状模式[24]. 以往关于PB-DBD的研究, 通常采用某一εr的介质进行填充[33–37], 在实际应用的PB-DBD中需要添加两种不同的催化剂, 才能有效去除挥发性有机物[38,39]. 目前, 对于这种混合填充DBD的放电特性尚不清楚, 严重限制了PB-DBD反应效率的提升.
为了揭示混合填充PB-DBD的放电特性, 本文基于二维PIC/MCC的方法, 对混合填充PB-DBD的放电演化过程进行数值模拟. 通过改变气压、电压幅值、介质直径和工作气体的氮气含量, 研究了这些参数对混合填充PB-DBD中平均电子密度和平均电子温度的影响规律. 本文研究结果对优化PB-DBD的反应器设计具有指导意义.
-
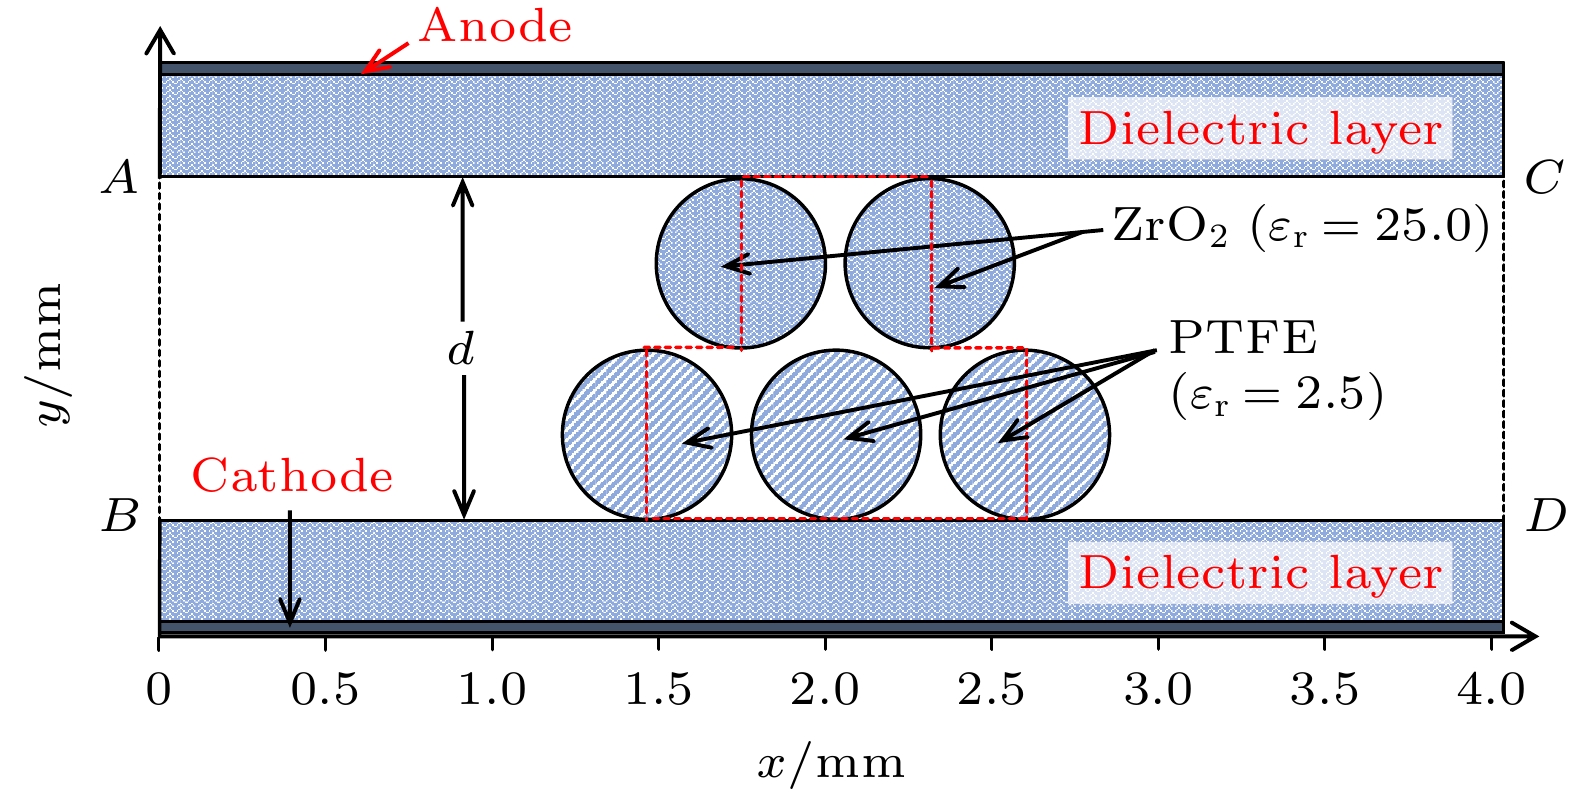
PB-DBD实际上是一个三维系统, 但为了减小运算量通常将三维系统简化为二维系统进行研究[37], 其简化后的反应器如图1所示. PB-DBD包含两个水平放置的平板金属电极, 电极长度为x = 4.0 mm. 其中下电极接地, 作为瞬时阴极. 上电极施加上升时间为0.1 ns的正极性脉冲电压, 作为瞬时阳极, 在0.1 ns后电压达到幅值(Va)不再随时间变化. 两电极被厚度均为0.3 mm的介质板(
$ {{\mathrm{\varepsilon }}}_{{\mathrm{r}}} $ = 25.0)所覆盖. 宽度为d的电极间隙填充有交错排列的电介质柱(介质珠, 二维情况下可以视为柱体), 其中上层介质柱是ZrO2 (εr = 25.0), 下层是PTFE (εr = 2.5). 同一水平面上的相邻介质柱圆心距离为2.2R (其中R为圆柱的半径), 两层介质柱间圆心竖直方向距离为2R. 由于外加电场大小会影响等离子体的放电特性[21,40], 因此在后文中改变R时将成比例地改变Va, 以保持外加电场固定.为了保持模拟的稳定性, 时间步长(Δt)和空间步长(Δx, Δy)应满足Courant-Friedrichs-Lewy条件[41]:
其中本模型中粒子速度最大值(vm)为5.5×10⁶ m/s. 显然, 减小时空步长会增大模拟过程的精确度, 但同时会增加计算量. 综合考虑, 本文PB-DBD研究中选择了Δt = 1.0×10⁻¹³ s, Δx × Δy = 4.0 μm×3.0 μm, 这样的时空步长与以往PIC模拟中选取的相似[30], 甚至比文献[42]报道的更小. 在放电过程中电荷只能在介质的表面堆积, 形成表面电荷, 这些积累的表面电荷会影响带电粒子的运动[16], 但电荷不会在边界堆积. 图1中虚线AB (x = 0) 和CD (x = 4.0 mm) 属于边界, 采用了Neumann边界条件[30,41,43]. 在模拟过程中, 考虑了电子(e), 正离子(
$ {\text{N}}_{2}^{+} $ 和$ {\text{O}}_{2}^{+} $ )以及负离子($ {\text{O}}_{2}^{-} $ ). 反应包括弹性碰撞、激发、电离和附着, 见表1[41,43–45]. 忽略了复合反应, 碰撞解离成O原子和N原子的反应, 生成O+, N+, 以及氮氧之间的化学反应. 相比于其他反应过程, 生成$ {\text{N}}_{2}^{+} $ ,$ {\text{O}}_{2}^{+} $ 和$ {\text{O}}_{2}^{-} $ 的碰撞以及激发碰撞阈值能量较低, 碰撞截面更大, 所以这些碰撞更容易发生. 此外, 文中流光传播过程只需约2.2 ns (见下文), 时间很短, 而复合反应进行较慢, 其弛豫时间约为100 ns[46]. 类似地, 生成O+, N+以及氮氧间的化学反应也需要较长时间[42], 所以在2.2 ns内可以忽略这些反应. 前人研究已经证明, 为了加快模拟运输过程, 省略一些解离反应等过程几乎不会影响PB-DBD的放电动力学行为[43,46].在PIC中为了避免数值模拟的不稳定性, 需要通过一阶粒子云插值法将电荷密度 (
$ \rho $ )分配到网格点上, 通过求解泊松方程得到电势($ \varphi $ ):其中
$ {\varepsilon }_{0} $ 为真空介电常数.$ \varphi $ 微分可得到电场(E). 利用第n个时间步长($ \Delta t $ )的速度(vi)和位置(ri)信息, 通过牛顿运动方程可求解粒子在(n+1)$ \Delta t $ 时的vi和ri:其中mi和qi表示第i类粒子的质量及电荷. 在一个网格中粒子的碰撞采用MCC处理. 电子与中性粒子的碰撞概率P表示为[47,48]
其中, N为中性粒子密度,
$ \sigma \left({\varepsilon }_{{\mathrm{i}}}\right) $ 是有关粒子能量的碰撞截面; u是两碰撞粒子的相对速度. 若P大于系统生成的随机数, 则认为粒子间发生了碰撞, 且相关截面决定发生的碰撞类型 (弹性碰撞、激发、电离、还是附着). 若不发生碰撞, 则由PIC方法继续循环处理. 关于阴极表面的二次电子发射: 由于离子的迁移速率很低, 本模型中考虑流光传播过程 (数ns的时间内), 离子几乎不动, 所以很少有离子到达阴极表面, 因此本模型中没有考虑二次电子发射, 这与文献[23,49]的模型类似.采用商业软件VSim (9.0版)执行模拟运算[23], 计算平台为72核的并行处理工作站. 在处理复杂几何曲面边界时采用了Cutting-Cell算法, 化曲为直, 用折线处理复杂的边界[50]. 例如介质珠的圆形边界划分为多条折线, 从而将边界上累积的电荷耦合到电场中. 在放电的初始时刻向模拟区域内加入电子密度为1015 m–3 的准中性等离子体, 其中
$ {\text{N}}_{2}^{+} $ :$ {\text{O}}_{2}^{+} $ : e = 4∶1∶5[23,43]. 实际上, 初始电子密度仅能影响模拟过程的速度, 而不会改变最终的模拟结果[49]. 利用相同的模型, 我们已经对单珠填充的PB-DBD进行了模拟研究[23], 模拟结果表明介质珠具有高介电常数(εr = 25.0)时放电由介质珠上的表面流光, 介质珠与介质板接触点附近的局部放电以及介质板上的沿面放电组成. 当表面流光到达介质珠表面中点后, 会沿着介质珠下半表面传播, 随后与沿面放电相遇; 低εr (εr = 2.0)时接触点附近不会产生局部放电, 且表面流光在到达介质珠表面中点后垂直向介质板传播. 这些模拟结果与实验结果吻合很好[22], 从而说明了模型的有效性. -
图2为大气压空气条件下Va = 10.0 kV时混合填充PB-DBD中电子密度(ne)和电场强度(E)的时空演化结果. 在外加电场作用下介质柱发生极化效应, 极化电场会增强介质柱外表面附近的电场[26,34]. 由于两层介质柱极化电场的增强作用, 最强电场(约为3.6×10⁷ V/m)出现在高εr介质柱底部空间(0.07 ns). 由于电场远高于空气的击穿电场(约为3.0×10⁶ V/m), 这表明放电是在过电压情况下产生, 此时放电运行于流光机制[51]. 也就是说, 0.07 ns时流光最先在高εr介质柱的底部产生. 外加电场随时间增强, 高εr介质柱底部放电的ne随时间增大. 之后(0.16 ns)流光沿着低εr介质柱的缝隙向下传播, 在流光传播过程中, 最大ne和E出现在流光头附近[26,52]. 在0.2 ns时流光头到达下介质板附近, 流光头净余正离子, 所以流光头的正离子和下介质板(阴极)间诱导出较强电场. 除了这个较强电场区, 流光轨迹被大量电子和离子充满, 即中性等离子体连接了PB-DBD的瞬时阳极和瞬时阴极, 这预示着放电从流光传播转化为体放电过程. 体放电呈现纺锤形, 最大ne出现在纺锤的中点(低εr介质柱间最小缝隙处). 最大E出现在下介质板表面, 达到约1.26×10⁸ V/m, 这表明下介质板附近产生了一个鞘层. 0.75 ns时, 高εr介质柱底部外侧产生的放电传播到气隙中. 实际应用中, 上层一般不会是两个介质柱, 因此这部分放电我们不予考虑. 纺锤形的体放电呈现两侧高而中间低的ne分布, 原因可能是双极扩散导致下层(低εr)介质柱表面沉积电子, 这些表面电荷会使电子减速向其表面移动, 从而使得电子在体放电外侧堆积, 造成ne中间低而两侧高. 该体放电会在高εr介质柱的下表面堆积电子, 因此放电空间上半部分间隙中电场增强. 此外, 由于高εr介质柱的极化增强作用, 上半部分的最强电场出现上介质板附近, 从而引发上介质板附近产生一个新的流光, 该流光沿着高εr介质柱缝隙向下传播(2.00 ns). 由于外加电场较低, 该流光在2.20 ns停止传播, 同时体放电的ne和E均有所减小. 在上述放电过程中, 低εr介质柱缝隙中的放电始终强于高εr介质柱缝隙的放电.
图3为不同时刻PB-DBD的电子能量分布函数, 可以看出, 高能电子比例先随时间增大, 在0.8 ns后随时间减小. 图4是混合填充(上层
$ {\varepsilon }_{{\mathrm{r}}} $ = 25.0, 下层2.5) PB-DBD中e,$ {\text{N}}_{2}^{+} $ ,$ {\text{O}}_{2}^{+} $ 和$ {\text{O}}_{2}^{-} $ 数量随时间的变化. 对于任意时刻气体中各种电荷数量为e >$ {\text{N}}_{2}^{+} $ >$ {\text{O}}_{2}^{+} $ >$ {\text{O}}_{2}^{-} $ . 分析如下, 由于空气中O2的浓度低于N2, 且O2电离率低于N2[40], 这导致任意时刻放电中$ {\text{O}}_{2}^{+} $ 数量比$ {\text{N}}_{2}^{+} $ 数量低. 在放电中, O2电离概率要大于附着概率[45], 因此$ {\text{O}}_{2}^{+} $ 数量比$ {\text{O}}_{2}^{-} $ 数量高. 此外, 图4表明电子数, 正离子($ {\text{N}}_{2}^{+} $ 和$ {\text{O}}_{2}^{+} $ )数随时间先增加, 在0.8 ns后电子数随时间减少, 但正离子数几乎保持不变. 利用电子能量分布函数对各粒子的时间变化趋势可以分析如下. 在0.8 ns前, 随着放电的发展, 高能电子增多, 使得更多电子具有电离能力从而导致电子和正离子($ {\text{N}}_{2}^{+} $ 和$ {\text{O}}_{2}^{+} $ )数增多. 在这段时间, 由于总电子数增多, 导致更多电子被氧分子吸附, 所以$ {\text{O}}_{2}^{-} $ 也随时间增加. 在0.8 ns之后, 随着高能电子减少, 基于上述相同的原因会导致电子和正离子($ {\text{N}}_{2}^{+} $ 和$ {\text{O}}_{2}^{+} $ )的生成减少. 沉积在介质上的电子数与附着反应消耗的电子数之和大于电离生成的电子数, 因此总电子数会随时间减少. 相比于电子, 正离子迁移速率小, 所以正离子在介质上的沉积几乎与离子的生成达到平衡, 所以正离子数在0.8 ns后几乎保持不变. 在整个放电过程中吸附反应一直存在, 导致即使在0.8 ns后$ {\text{O}}_{2}^{-} $ 也一直随着时间增加.在应用中, 等离子体催化的效率和气压有关[53]. 为了进一步了解气压对放电的影响, 图5为Va = 10.0 kV时介质柱缝隙中平均电子密度(
$ {\bar{n}}_{{\mathrm{e}}}/{{\mathrm{m}}}^{-3} $ )和平均电子温度($ {\bar{T}}_{{\mathrm{e}}}/{\mathrm{e}}{\mathrm{V}} $ )随气压的变化关系. 其中取平均的空间对应图1中红色虚线框内介质柱缝隙(白色区域). 从图5可以发现, 随气压的升高$ {\bar{n}}_{{\mathrm{e}}} $ 和$ {\bar{T}}_{{\mathrm{e}}} $ 均减小. 造成这一现象的机制分析如下. 随着气压的升高, 分子数密度增大, 电子的碰撞频率升高, 平均自由程减小. 碰撞频率的增大和平均自由程的减小导致单位时间内电子损失的能量增大而从电场获得的能量减小[54]. 因此, 电子的平均能量(亦即$ {\bar{T}}_{{\mathrm{e}}} $ )会随着气压升高而减小.$ {\bar{T}}_{{\mathrm{e}}} $ 随气压升高而减小, 表明由于气压较高, 击穿位于帕邢曲线的右支, 这导致击穿电压会随着气压升高而增大[51]. 在固定电压下意味着电子能量的减少, 即$ {\bar{T}}_{{\mathrm{e}}} $ 随气压升高而减小. 这一结果与介质阻挡放电的模拟结果一致[55]. 随着$ {\bar{T}}_{{\mathrm{e}}} $ 的减小, 决定电子产生过程的电离碰撞系数(汤森第一电离系数α)也会减小, 这导致放电产生的电子数会减少, 因此$ {\bar{n}}_{{\mathrm{e}}} $ 会减小.图6为大气压空气条件下介质柱缝隙中
$ {\bar{n}}_{{\mathrm{e}}} $ 和$ {\bar{T}}_{{\mathrm{e}}} $ 随电压幅值(Va)的变化关系. 显然,$ {\bar{n}}_{{\mathrm{e}}} $ 和$ {\bar{T}}_{{\mathrm{e}}} $ 随Va升高均增大. 以上现象的分析如下: 当电压升高时, 电场强度增大, 在气压恒定的情况下电子温度主要由电场决定[56]. 因此,$ {\bar{T}}_{{\mathrm{e}}} $ 随Va升高而变大. 从α系数而言,$ {\bar{T}}_{{\mathrm{e}}} $ 增大导致α系数增大. 这意味着放电过程中会产生更多电子, 因此,$ {\bar{n}}_{{\mathrm{e}}} $ 随着Va上升而增大. 具体来说, 15.0 kV时介质柱缝隙中$ {\bar{n}}_{{\mathrm{e}}} $ 比5.0 kV时要高一个数量级.填充材料的空间尺寸决定了气体停留时间, 接触面积和放电性能, 从而也会影响了等离子体催化效率[57]. 基于此, 图7研究了大气压空气条件下介质柱缝隙中
$ {\bar{n}}_{{\mathrm{e}}} $ 和$ {\bar{T}}_{{\mathrm{e}}} $ 随介质柱半径(R)的变化关系. 如模型描述部分所述, 为了保持外加电场不变Va也随着R成比例变化. 图7表明,$ {\bar{n}}_{{\mathrm{e}}} $ 和$ {\bar{T}}_{{\mathrm{e}}} $ 均随R的增大而增大. 当R变大时, 介质柱的表面积也随之增大, 这意味着介质柱内表面会产生更多的极化电荷, 从而在介质柱外面产生更强的极化电场. 由于极化电场会增强介质柱附近的电场, 导致$ {\bar{T}}_{{\mathrm{e}}} $ 增大, 即$ {\bar{T}}_{{\mathrm{e}}} $ 随R的增大而增大. 从α系数考虑,$ {\bar{T}}_{{\mathrm{e}}} $ 增大会使得$ {\bar{n}}_{{\mathrm{e}}} $ 增大. 此外, R减小时, 介质柱间的缝隙也会减小, 使得没有足够的空间进行电离过程[58],$ {\bar{n}}_{{\mathrm{e}}} $ 就会减小.图8是大气压条件下Va = 10.0 kV时介质柱缝隙中
$ {\bar{n}}_{{\mathrm{e}}} $ 和$ {\bar{T}}_{{\mathrm{e}}} $ 随混合气体中N2含量的变化关系. 从图8可以看出,$ {\bar{T}}_{{\mathrm{e}}} $ 随着N2含量的增大(O2含量的减小)而单调增大.$ {\bar{n}}_{{\mathrm{e}}} $ 随着N2含量的增大先减小, 在N2含量达到50%后会随着N2含量的增大而增大. 对以上现象的原因分析如下. 电子和O2发生电离碰撞的阈值能量是12.06 eV, 低于电子与N2电离碰撞的阈值 (15.58 eV)[41]. 这意味着随着N2含量的增大, 在放电的碰撞过程中电子有机会积累到更高的能量. 因此,$ {\bar{T}}_{{\mathrm{e}}} $ 随着N2含量的增大而增大. 此外, 介质柱缝隙中$ {\bar{n}}_{{\mathrm{e}}} $ 随N2含量的变化应该由电离速率(kion)和附着速率(katt)决定[59]:其中α为汤森第一电离系数, η是附着速率系数, ve电子速度, N气体密度. 通过(7)式和(8) 式确定了不同N2含量的kion和katt, 如表2所示, katt比kion低两个量级. 这说明附着反应对于
$ {\bar{n}}_{{\mathrm{e}}} $ 的影响几乎可以忽略. 因此,$ {\bar{n}}_{{\mathrm{e}}} $ 随N2含量的变化应该由电离速率公式进行分析. 表2说明, 随着N2含量的增大kion先减小, 当N2含量达到50%后随N2含量继续增加kion增大. 因此,$ {\bar{n}}_{{\mathrm{e}}} $ 随N2含量增大先减小后增大. 关于kion随N2含量呈现不同的变化趋势, 可能是由于O2比N2的电离碰撞阈值能量低, 表明O2比N2更容易电离. 随着N2含量的增大, 由于N2相比O2更难于电离, 因此会导致电离数量减少, 从而导致kion减小. 另一方面, 随着N2含量的增大, 会导致$ {\bar{T}}_{{\mathrm{e}}} $ 增大, 这种因素会导致kion增大. -
本文采用二维PIC/MCC的方法, 研究了ZrO2 (εr = 25.0)和PTFE(εr = 2.5) 混合填充PB-DBD的放电特性及实验参数(气压, Va, R和N2含量)对等离子体参数的影响. 研究结果表明, 当上电极施加上具有一定斜率的脉冲电压后, 在外加电场作用下介质柱通过极化增强了电场, 使得流光先在高εr介质柱底部产生并沿着低εr介质柱缝隙向下传播, 最终转化为体放电. 体放电发展一定时间后, 在上介质板附近产生一个新的流光并沿着高εr介质柱缝隙向下传播. 相比于高εr介质柱缝隙, 低εr介质柱缝隙的放电ne较大. 放电过程中的e,
${\text{N}}_{2}^{+} $ 和${\text{O}}_{2}^{+} $ 的数量随时间先增加, 在0.8 ns后${\text{N}}_{2}^{+} $ 和${\text{O}}_{2}^{+} $ 数量几乎保持不变. 由于氧附着反应的消耗, 电子数在0.8 ns后随时间减少,${\text{O}}_{2}^{-} $ 数量单调增加. 当气压升高时,$ {\bar{n}}_{{\mathrm{e}}} $ 和$ {\bar{T}}_{{\mathrm{e}}} $ 均减小. 随着Va或R的增大,$ {\bar{n}}_{{\mathrm{e}}} $ 和$ {\bar{T}}_{{\mathrm{e}}} $ 均增大. 当氮氧混合气体中的N2含量改变时, 随着N2含量的增大$ {\bar{n}}_{{\mathrm{e}}} $ 先减小后增大, 但$ {\bar{T}}_{{\mathrm{e}}} $ 单调增大. 对$ {\bar{n}}_{{\mathrm{e}}} $ 和$ {\bar{T}}_{{\mathrm{e}}} $ 随实验参数的变化规律进行了定性分析.
混合填充下介质阻挡放电特性的粒子云网格/蒙特卡罗碰撞模拟
Particle-in-cell/Monte Carlo collision simulations of dielectric barrier discharge packed with mixed dielectrics
-
摘要: 填充床介质阻挡放电通常采用某一种材料进行填充以实现等离子体催化反应, 而利用不同材料混合填充可以实现更复杂的化学反应. 为了深入理解混合填充放电的物理机制, 本文基于粒子云网格/蒙特卡罗碰撞(PIC/MCC)模型对其动力学行为进行研究. 结果表明, 流光最先在高介电常数(εr)的介质柱底部产生, 并沿着低εr介质柱缝隙向下传播. 当流光传播到下介质板后, 该放电转化为体放电. 随后, 在上介质板附近又产生一个新的流光, 并沿着高εr介质柱缝隙向下传播. 研究发现, 电子和正离子的数量随时间先增加, 在0.8 ns后电子数随时间减少, 但正离子数几乎保持不变. 在此过程中负离子数随时间单调增加. 此外, 介质柱缝隙中平均电子密度($ {\bar{n}}_{{\mathrm{e}}} $)和平均电子温度($ {\bar{T}}_{{\mathrm{e}}} $)随气压升高均减小. 它们随着电压幅值或介质柱半径的增大而增大. 随工作气体中氮气含量的增大, $ {\bar{n}}_{{\mathrm{e}}} $先减小后增大, 而$ {\bar{T}}_{{\mathrm{e}}} $单调增大. 这些研究结果对优化反应器设计, 进一步提升填充床介质阻挡放电的反应效率具有重要意义.
-
关键词:
- 填充床介质阻挡放电 /
- 粒子云网格/蒙特卡罗碰撞 /
- 动力学行为 /
- 流光
Abstract: Packed bed dielectric barrier discharge (PB-DBD) is extremely popular in plasma catalysis applications, which can significantly improve the selectivity and energy efficiency of the catalytic processes. In order to achieve some complex chemical reactions, it is necessary to mix different materials in practical applications. In this work, by using the two-dimensional particle-in-cell/Monte Carlo collision (PIC/MCC) method, the discharge evolution in PB-DBD packed with two mixed dielectrics is numerically simulated to reveal the discharge characteristics. Due to the polarization of dielectric columns, the enhancement of electric field induces streamers at the bottom of the dielectric columns with high electrical permittivity (εr). The streamers propagate downward in the voids between the dielectric columns with low εr, which finally converts into volume discharges. Then, a new streamer forms near the upper dielectric plate and propagates downward along the void of the dielectric columns with high εr. Moreover, electron density between the columns with high εr is lower than that between the dielectric columns with low εr. In addition, the numbers of e, $ {\text{N}}_{2}^{+} $, $ {\text{O}}_{2}^{+} $ and $ {\text{O}}_{2}^{-} $ present different profiles versus time. All of e, $ {\text{N}}_{2}^{+} $ and $ {\text{O}}_{2}^{+} $ increase in number before 0.8 ns. After 0.8 ns, the number of electrons decreases with time, while the numbers of $ {\text{N}}_{2}^{+} $ and $ {\text{O}}_{2}^{+} $ keep almost constant. In the whole process, the number of $ {\text{O}}_{2}^{-} $ keeps increasing with time increasing. The reason for the different temporal profiles can be analyzed as follows. The sum of electrons deposited on the dielectric and those lost in attachment reaction is greater than the number of electrons generated by ionization reaction, resulting in the declining trend of electrons. Comparatively, the deposition of $ {\text{N}}_{2}^{+} $ and $ {\text{O}}_{2}^{+} $ on the dielectric almost balances with their generation, leading to the constant numbers of $ {\text{N}}_{2}^{+} $ and $ {\text{O}}_{2}^{+} $. In addition, the variation of averaged electron density ($ {\bar{n}}_{{\mathrm{e}}} $) and averaged electron temperature ($ {\bar{T}}_{{\mathrm{e}}} $) in the voids between the dielectric columns are also analyzed under different experimental parameters. Simulation results indicate that both of them decrease with pressure increasing or voltage amplitude falling. Moreover, they increase with dielectric column radius enlarging. In addition, $ {\bar{n}}_{{\mathrm{e}}} $ increases and then decreases with the increase of N2 content in the working gas, while $ {\bar{T}}_{{\mathrm{e}}} $ monotonically increases. The variations of $ {\bar{n}}_{{\mathrm{e}}} $ and $ {\bar{T}}_{{\mathrm{e}}} $ in the voids can be explained as follows. With the increase of pressure, the increase of collision frequency and the decrease of average free path lead to less energy obtained per unit time by electrons from the electric field, resulting in the decreasing of $ {\bar{T}}_{{\mathrm{e}}} $. Moreover, the first Townsend ionization coefficient decreases with the reduction in $ {\bar{T}}_{{\mathrm{e}}} $, resulting in less electrons produced per unit time. Hence, both $ {\bar{n}}_{{\mathrm{e}}} $ and $ {\bar{T}}_{{\mathrm{e}}} $ decrease with pressure increasing. Additionally, $ {\bar{T}}_{{\mathrm{e}}} $ is mainly determined by electric field strength. Therefore, the rising voltage amplitude results in the increase of and $ {\bar{T}}_{{\mathrm{e}}} $. Based on the same reason for pressure, $ {\bar{n}}_{{\mathrm{e}}} $ also increases with the augment of voltage amplitude. Consequently, both $ {\bar{n}}_{{\mathrm{e}}} $ and $ {\bar{T}}_{{\mathrm{e}}} $ increase with voltage amplitude increasing. In addition, the surface area of dielectric columns increases with dielectric column radius enlarging. Therefore, more polarized charges are induced on the inner surface of the dielectric column, inducing a stronger electric field outside. Accordingly, the enlarging of dielectric column radius leads $ {\bar{n}}_{{\mathrm{e}}} $ and $ {\bar{T}}_{{\mathrm{e}}} $ to increase. Moreover, the variation of $ {\bar{n}}_{{\mathrm{e}}} $ with N2 content is analyzed from the ionization rate, and that of $ {\bar{T}}_{{\mathrm{e}}} $ is obtained by analyzing the ionization thresholds of N2 and O2. -

-
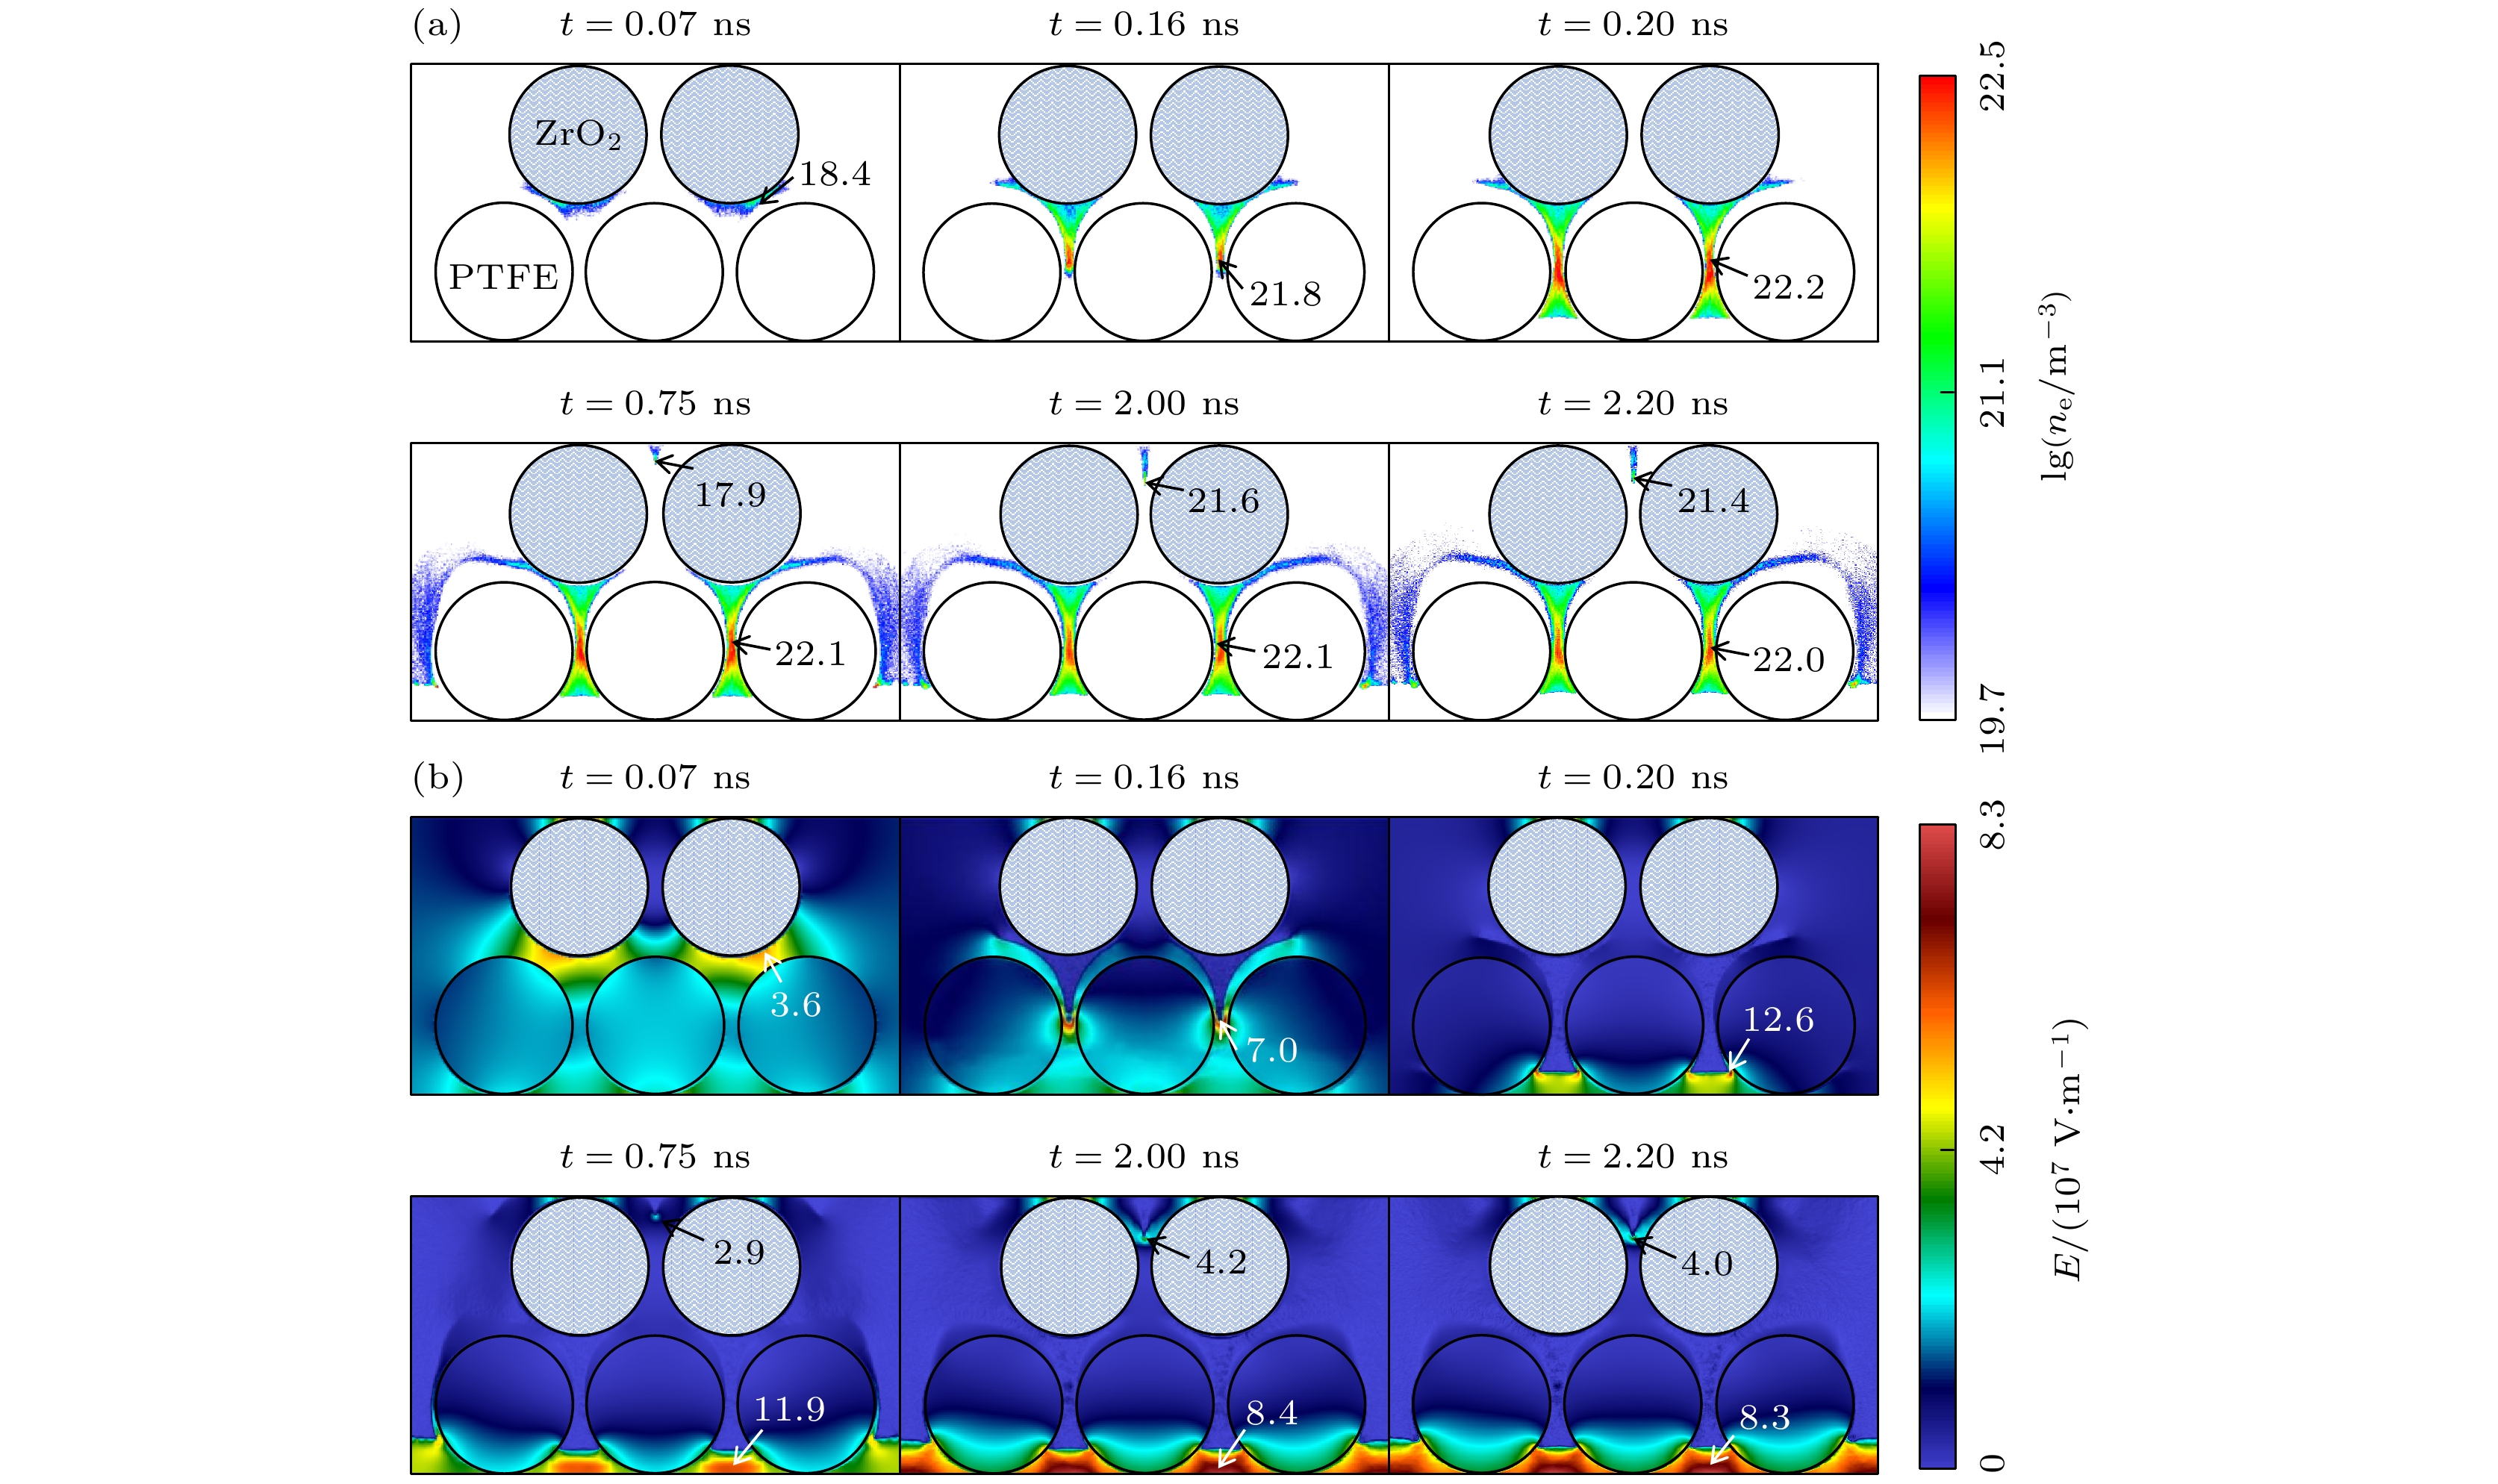
图 2 混合填充 (
$ {\varepsilon }_{{\mathrm{r}}} $ = 2.5和25.0) PB-DBD中ne (m–3) (a)和E (V/m) (b)的时空演化图. 图(a), (b)中的数值分别对应最大的 lg (ne) 和E (×107)Figure 2. Spatial-temporal evolution of ne (m–3) (a) and E (V/m) (b) in PB-DBD packed by mixed dielectric columns with
$ {\varepsilon }_{{\mathrm{r}}} $ = 2.5 and 25.0. The maximal (×107 V/m) values correspond to maximal lg (ne) and E (×107), respectively.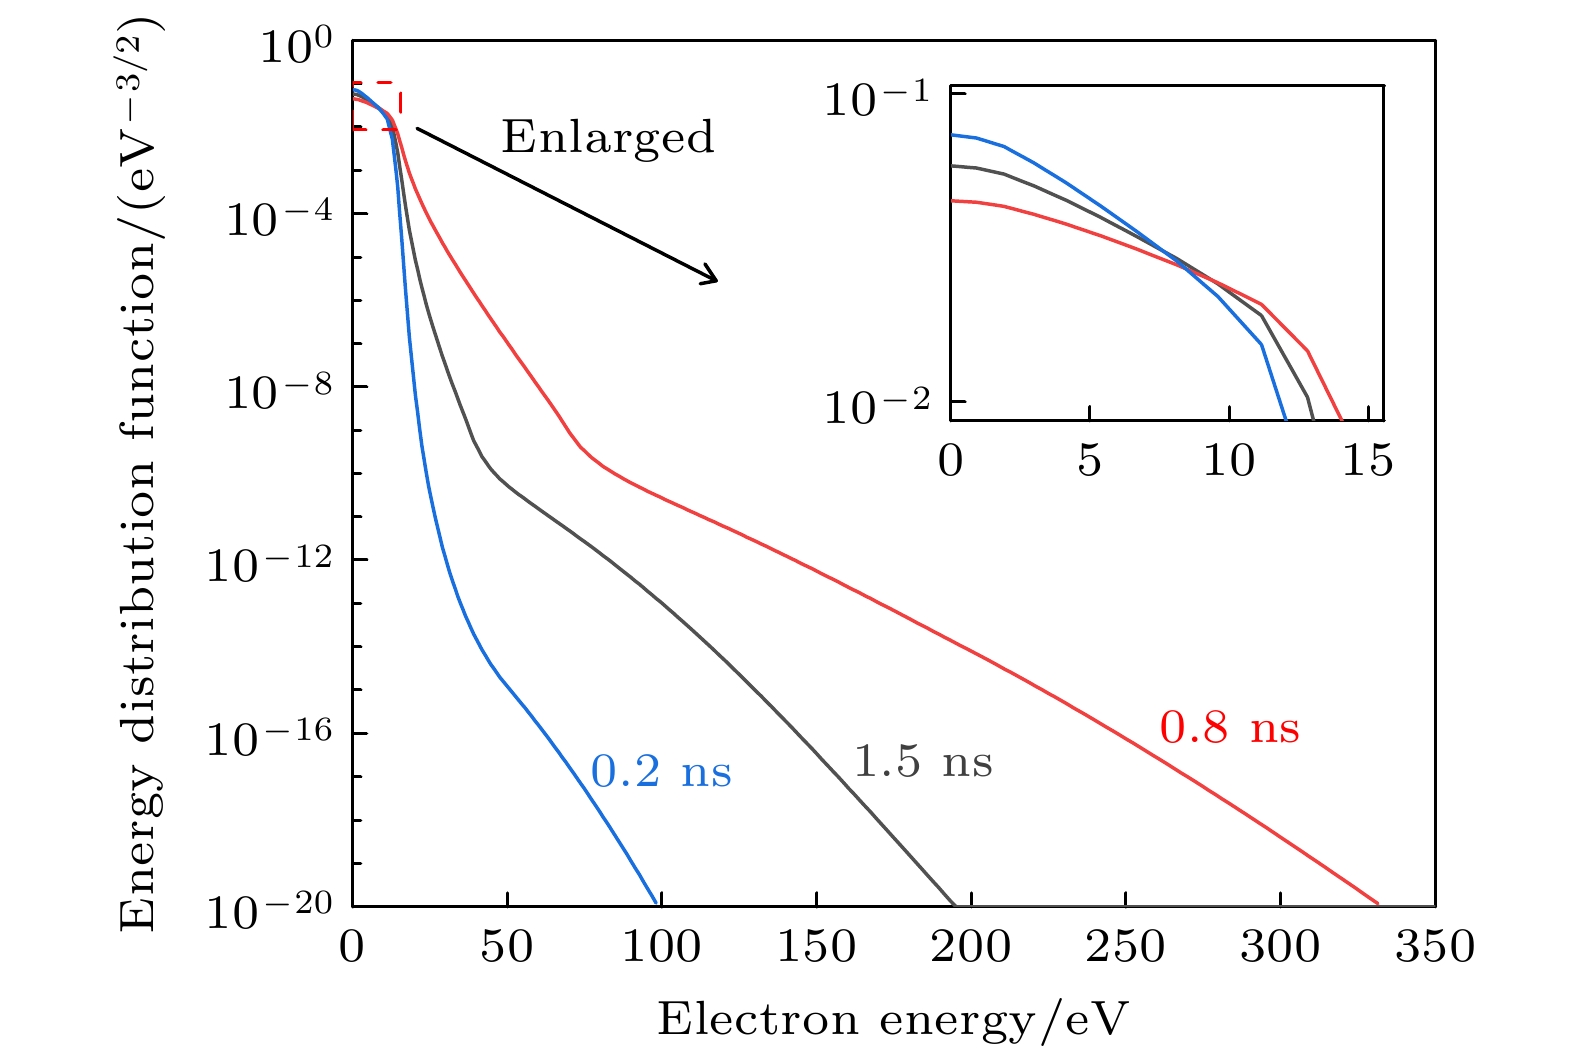
图 3 不同时刻的电子能量分布函数
Figure 3. Electron energy distribution function at different discharge moments.
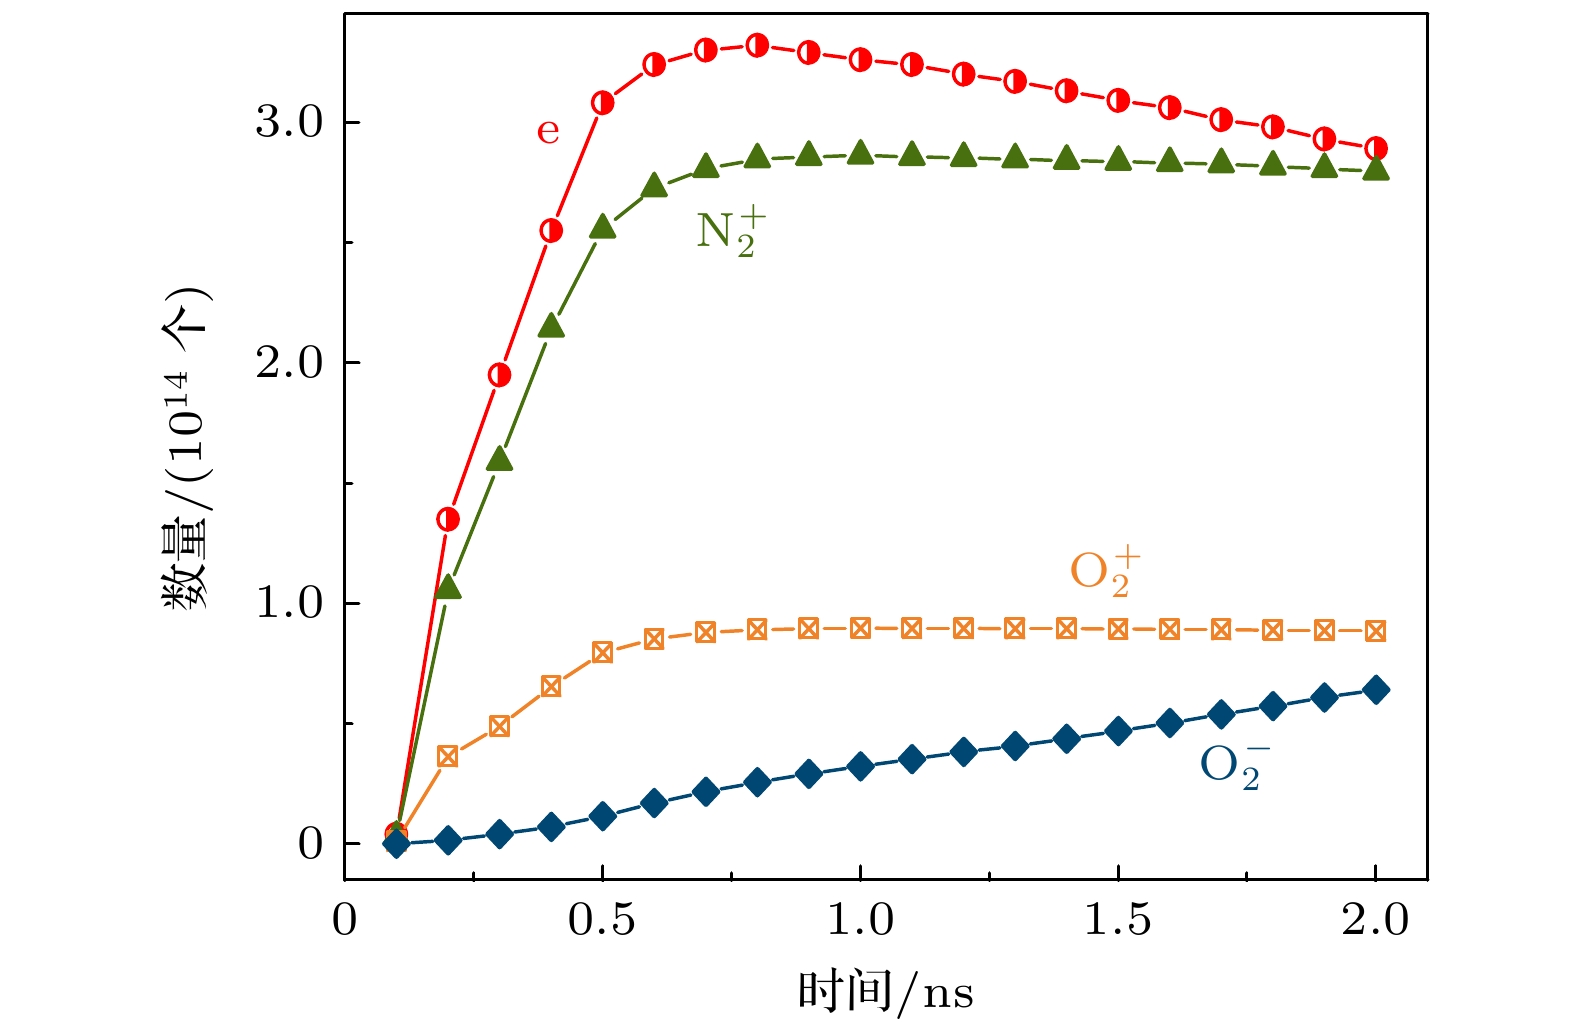
图 4 混合填充 (
$ {\varepsilon }_{{\mathrm{r}}} $ = 2.5和25.0) PB-DBD中e,$ {\text{N}}_{2}^{+} $ ,$ {\text{O}}_{2}^{+} $ 和$ {\text{O}}_{2}^{-} $ 数量随时间的变化Figure 4. Numbers of e,
$ {\text{N}}_{2}^{+} $ ,$ {\text{O}}_{2}^{+} $ and$ {\text{O}}_{2}^{-} $ versus time in PB-DBD packed by mixed dielectric columns with$ {\varepsilon }_{{\mathrm{r}}} $ = 2.5 and 25.0.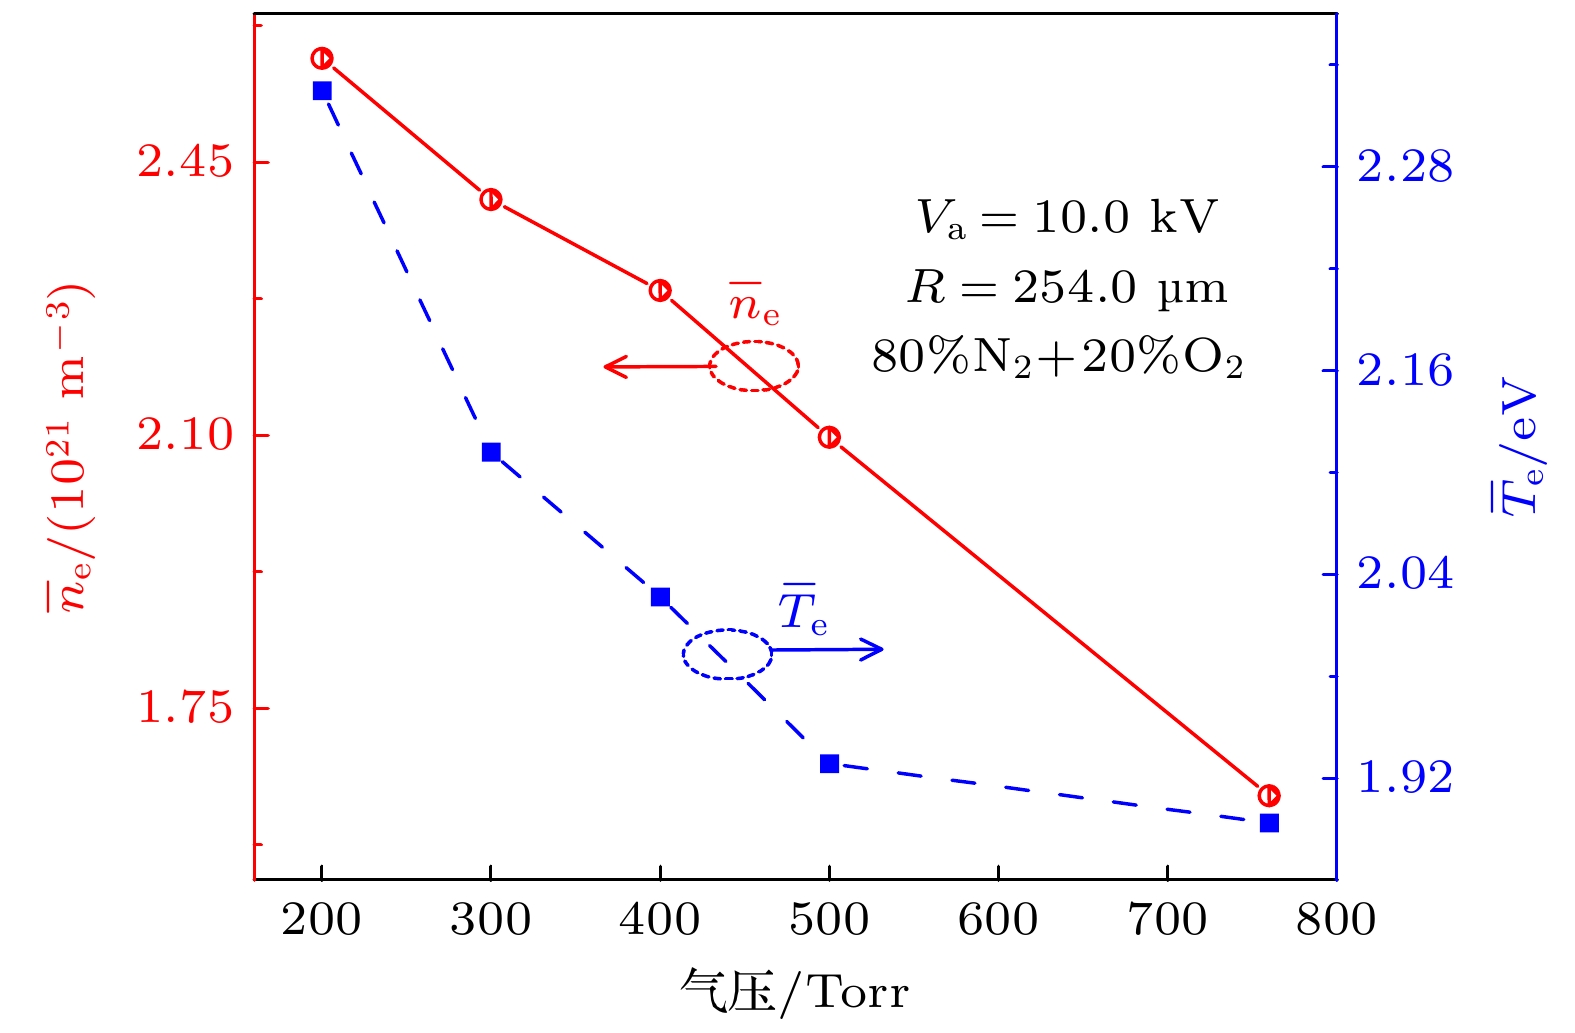
图 5 介质柱缝隙中平均电子密度(
$ {\bar{n}}_{{\mathrm{e}}} $ )和平均电子温度($ {\bar{T}}_{{\mathrm{e}}} $ )随气压的变化. 其中取平均的空间对应图1中红色虚线框内介质柱缝隙(白色区域)Figure 5. Averaged electron density (
$ {\bar{n}}_{{\mathrm{e}}} $ ) and averaged electron temperature ($ {\bar{T}}_{{\mathrm{e}}} $ ) as functions of pressure, the average is made in the voids between the dielectric columns surrounded by the red dashed lines (the white regions) in Fig. 1.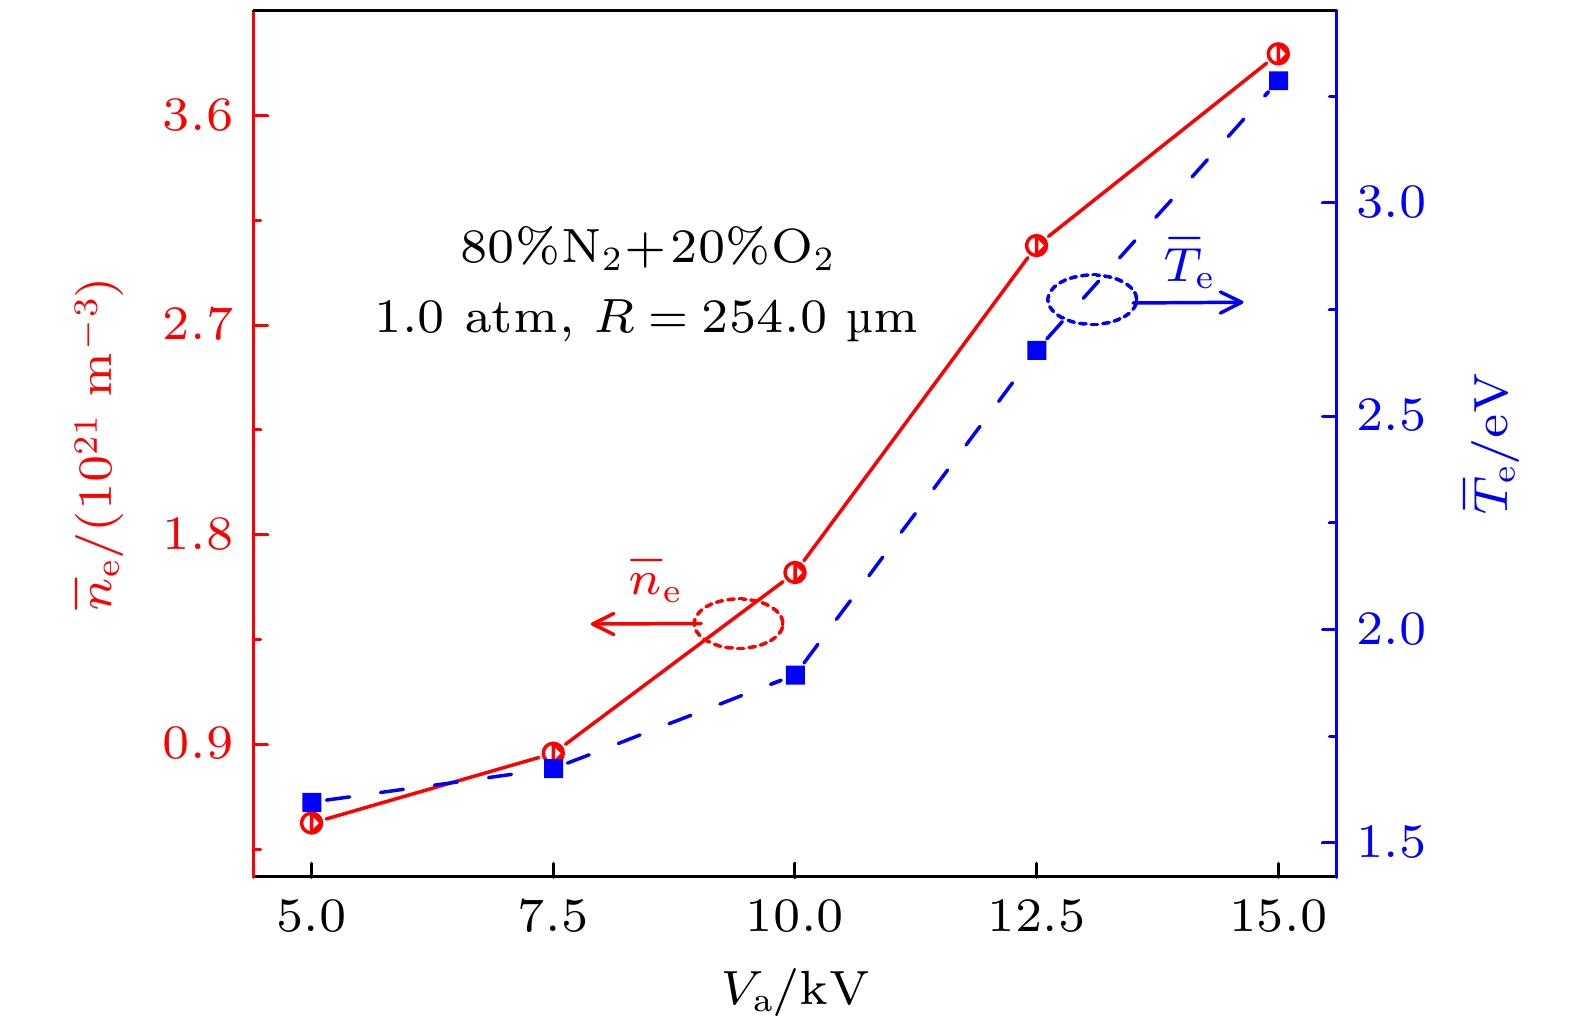
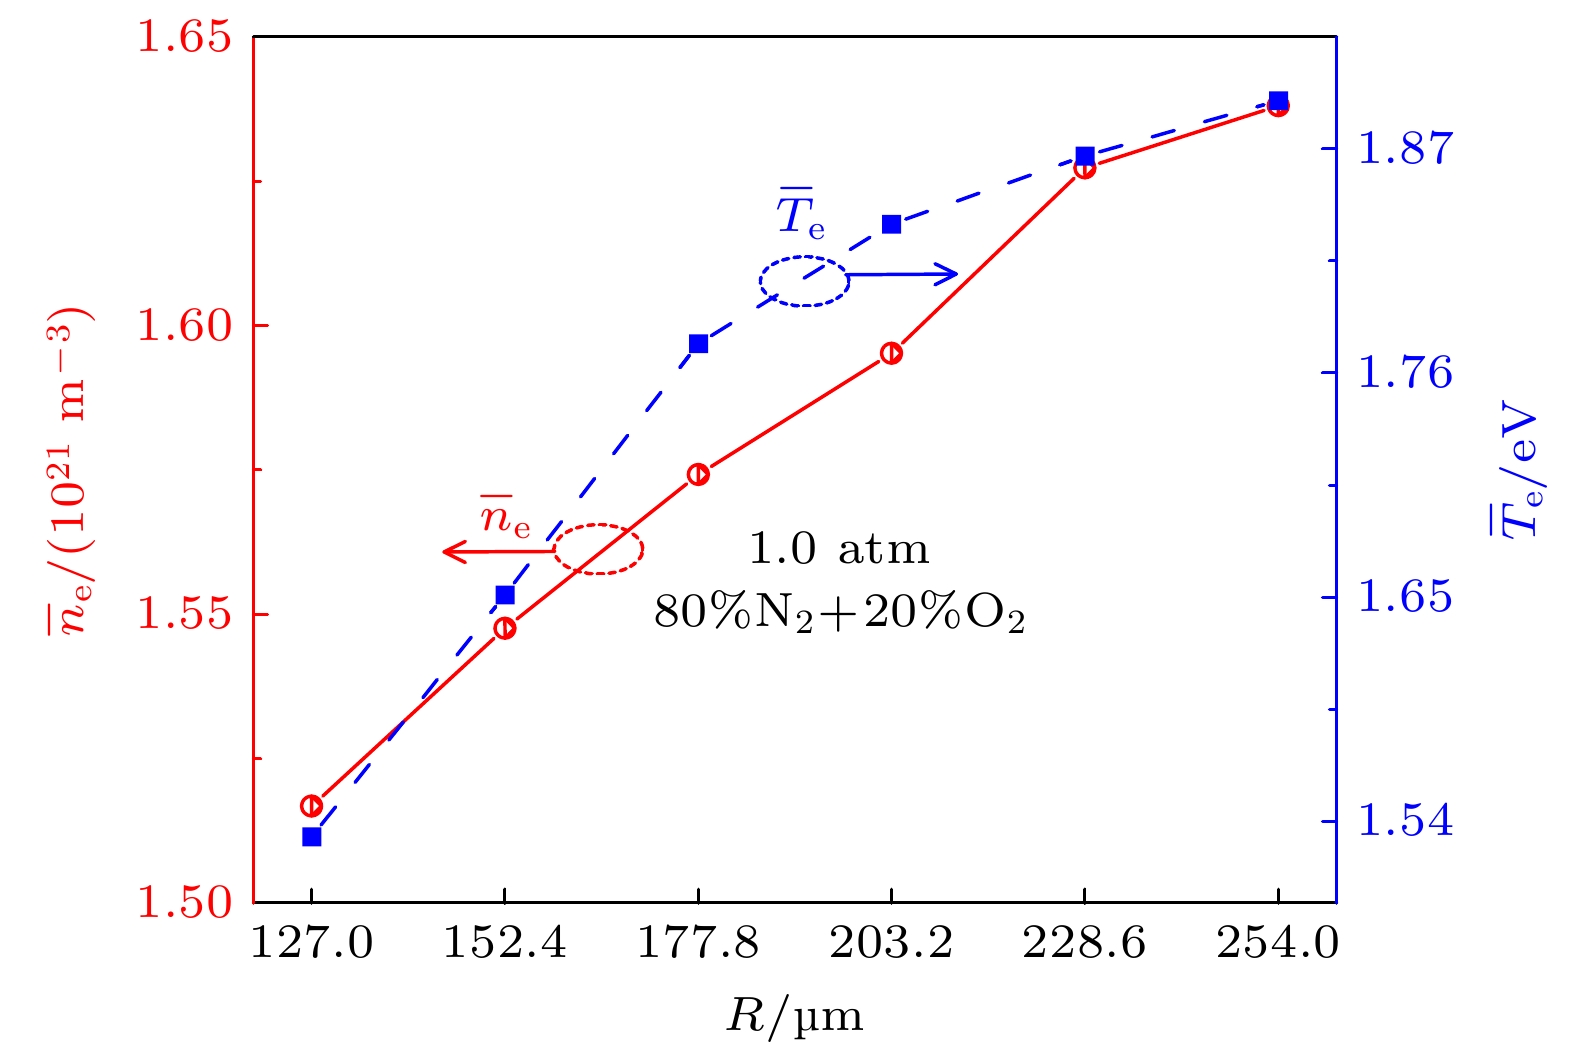
图 7 介质柱缝隙中
$ {\bar{n}}_{{\mathrm{e}}} $ 和$ {\bar{T}}_{{\mathrm{e}}} $ 随介质柱半径 (R) 的变化关系. 其中取平均的空间与图5相同. 对于不同R, Va也成比例变化以保持外加电场不变Figure 7. The
$ {\bar{n}}_{{\mathrm{e}}} $ and$ {\bar{T}}_{{\mathrm{e}}} $ in the voids between the dielectric columns as functions of dielectric column radius (R), the voids are the same with those in Fig. 5. Va is varied for different R to keep applied E constant.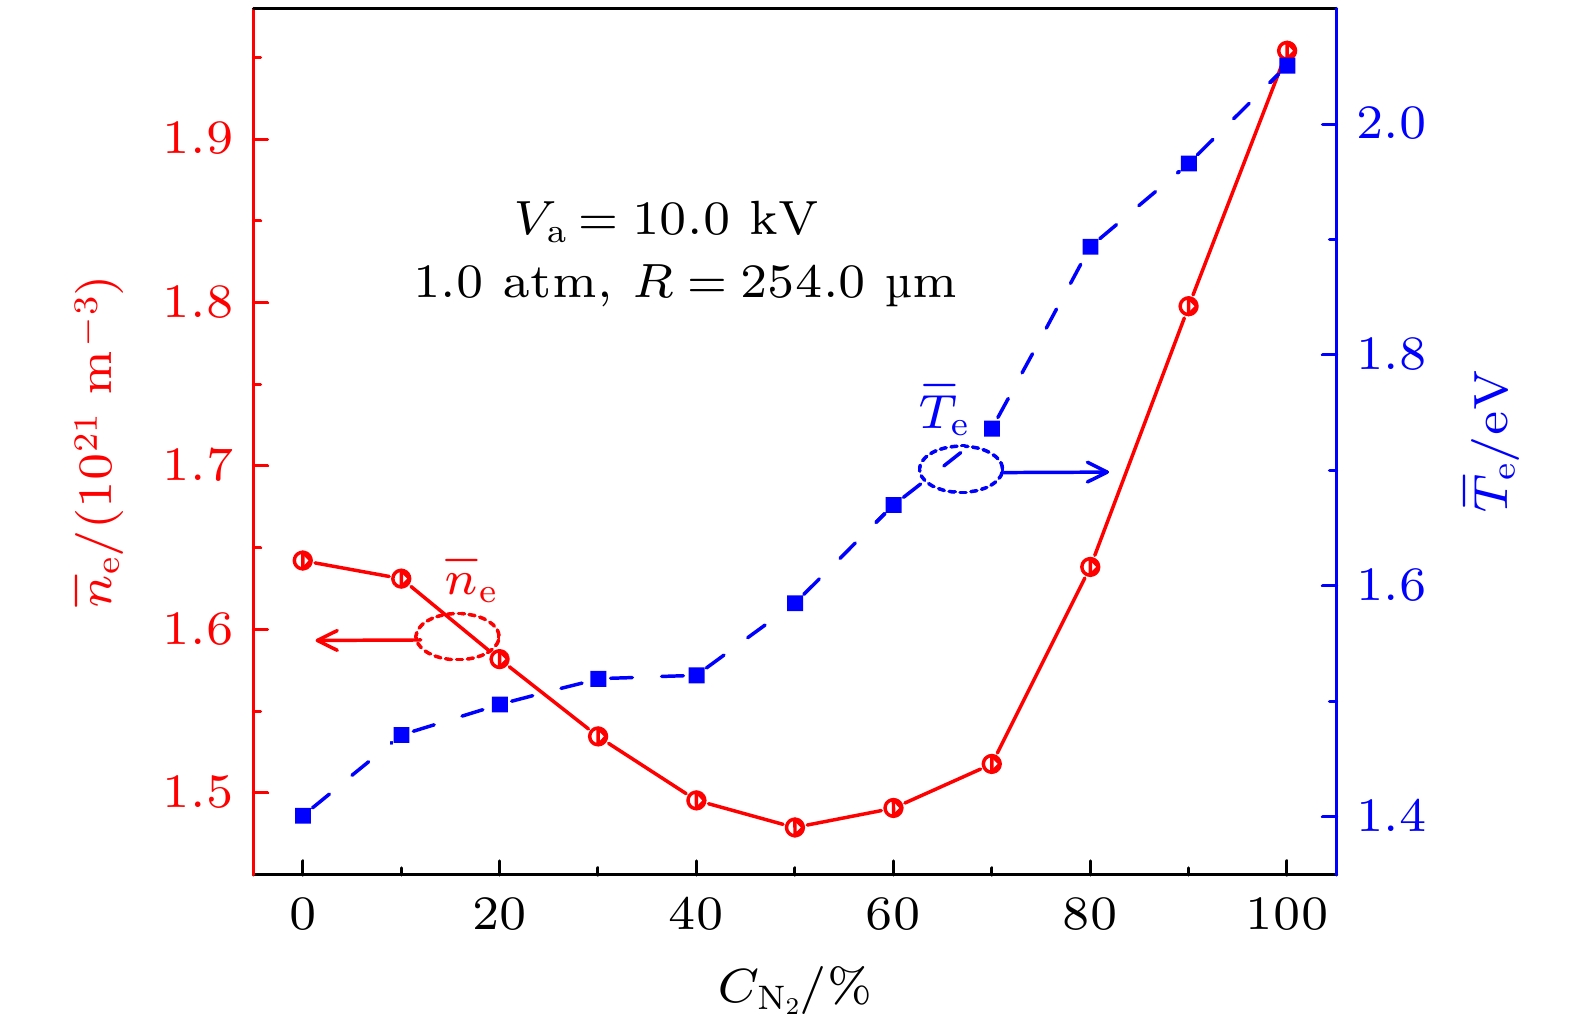
图 8 介质柱缝隙中
$ {\bar{n}}_{{\mathrm{e}}} $ 和$ {\bar{T}}_{{\mathrm{e}}} $ 随混合气体中N2含量的变化关系, 其中取平均的空间与图5相同Figure 8. The
$ {\bar{n}}_{{\mathrm{e}}} $ and$ {\bar{T}}_{{\mathrm{e}}} $ in the voids between the dielectric columns as functions of N2 content in the mixture, the voids are the same with those in Fig. 5.表 1 模型中所考虑的电子与N2和O2的碰撞
Table 1. Collisions of electrons with neutral N2 and O2 considered in the model.
Reaction Threshold/eV Reference Electron-impact ionization [41,43–45] $ {\mathrm{e}}+{{\mathrm{O}}}_{2} \to 2 {\mathrm{e}}+{{\mathrm{O}}}_{2}^{+} $ 12.06 $ {\mathrm{e}}+{{\mathrm{N}}}_{2} \to 2 {\mathrm{e}}+{{\mathrm{N}}}_{2}^{+} $ 15.58 Attachment [41,43–45] $ {\mathrm{e}}+{{\mathrm{O}}}_{2}+{{\mathrm{O}}}_{2} \to {{\mathrm{O}}}_{2}^{-}+{{\mathrm{O}}}_{2} $ Elastic collision [43–45] $ {\mathrm{e}}+{{\mathrm{O}}}_{2} \to {\mathrm{e}}+{{\mathrm{O}}}_{2} $ $ {\mathrm{e}}+{{\mathrm{N}}}_{2} \to {\mathrm{e}}+{{\mathrm{N}}}_{2} $ Electron-impact excitation [43–45] $ {\mathrm{e}}+{{\mathrm{O}}}_{2} \to {\mathrm{e}}+{{\mathrm{O}}}_{2}^{{\mathrm{*}}} $ 0.98 $ {\mathrm{e}}+{{\mathrm{O}}}_{2} \to {\mathrm{e}}+{{\mathrm{O}}}_{2}^{{\mathrm{*}}} $ 1.63 $ {\mathrm{e}}+{{\mathrm{O}}}_{2} \to {\mathrm{e}}+{{\mathrm{O}}}_{2}^{{\mathrm{*}}} $ 6.0 $ {\mathrm{e}}+{{\mathrm{O}}}_{2} \to {\mathrm{e}}+{{\mathrm{O}}}_{2}^{{\mathrm{*}}} $ 8.4 $ {\mathrm{e}}+{{\mathrm{O}}}_{2} \to {\mathrm{e}}+{{\mathrm{O}}}_{2}^{{\mathrm{*}}} $ 10.0 $ {\mathrm{e}}+{{\mathrm{N}}}_{2} \to {\mathrm{e}}+{{\mathrm{N}}}_{2}^{{\mathrm{*}}} $ 6.169 $ {\mathrm{e}}+{{\mathrm{N}}}_{2} \to {\mathrm{e}}+{{\mathrm{N}}}_{2}^{{\mathrm{*}}} $ 7.353 $ {\mathrm{e}}+{{\mathrm{N}}}_{2} \to {\mathrm{e}}+{{\mathrm{N}}}_{2}^{{\mathrm{*}}} $ 7.362 $ {\mathrm{e}}+{{\mathrm{N}}}_{2} \to {\mathrm{e}}+{{\mathrm{N}}}_{2}^{{\mathrm{*}}} $ 8.165 $ {\mathrm{e}}+{{\mathrm{N}}}_{2} \to {\mathrm{e}}+{{\mathrm{N}}}_{2}^{{\mathrm{*}}} $ 8.399 $ {\mathrm{e}}+{{\mathrm{N}}}_{2} \to {\mathrm{e}}+{{\mathrm{N}}}_{2}^{{\mathrm{*}}} $ 8.549 $ {\mathrm{e}}+{{\mathrm{N}}}_{2} \to {\mathrm{e}}+{{\mathrm{N}}}_{2}^{{\mathrm{*}}} $ 8.89 $ {\mathrm{e}}+{{\mathrm{N}}}_{2} \to {\mathrm{e}}+{{\mathrm{N}}}_{2}^{{\mathrm{*}}} $ 9.7537 $ {\mathrm{e}}+{{\mathrm{N}}}_{2} \to {\mathrm{e}}+{{\mathrm{N}}}_{2}^{{\mathrm{*}}} $ 11.032  下载: 导出CSV
表 2 电离速率与附着速率随混合气体中N2含量(10%, 40%, 60%, 90%)的变化
Table 2. Change of ionization rate and attachment rate with N2 content (10%, 40%, 60%, 90%) in mixed gas.
$ {C}_{{{\mathrm{N}}}_{2}} $ /%kion/(m3·s–1) katt/(m3·s–1) 10 5.0×10⁻¹⁴ 9.0×10⁻¹⁷ 40 2.7×10⁻¹⁴ 1.5×10⁻¹⁶ 60 1.3×10⁻¹⁴ 3.1×10⁻¹⁶ 90 7.2×10⁻¹⁴ 8.0×10⁻¹⁶
下载: 导出CSV
-
[1] Bogaerts A, Kozák T, Van Laer K, Snoeckx R 2015 Faraday Discuss. 183 217 doi: 10.1039/C5FD00053J [2] 陈少伟, 陈奕, 牛江奇, 刘天奇, 黄建国, 陈焕浩, 范晓雷 2024 化工进展 44 1375 doi: 10.16085/j.issn.1000-6613.2024-1375 Chen S W, Chen Y, Niu J Q, Liu T Q, Huang J G, Chen H H, Fan X L 2024 Chem. Ind. Eng. Pro. 44 1375 doi: 10.16085/j.issn.1000-6613.2024-1375 [3] 程 鹤, 雷孝廷, 张文超, 卢新培 2024 高电压技术 50 5206 doi: 10.13336/j.1003-6520.hve.20231829 Cheng H, Lei X T, Zhang W C, Lu X P 2024 High Volt. Eng. 50 5206 doi: 10.13336/j.1003-6520.hve.20231829 [4] 张海宝, 陈强 2021 物理学报 70 095203 doi: 10.7498/aps.70.20202233 Zhang H B, Chen Q 2021 Acta Phys. Sin. 70 095203 doi: 10.7498/aps.70.20202233 [5] Lee S, Ha J, Li O L 2024 Nanomaterials 14 1313 doi: 10.3390/nano14151313 [6] Li J, Guo Q, Zhao X, Hu Y K, Zhang S Z, Zhao Y, Li S Z 2023 Mol. Catal. 549 113494 doi: 10.1016/j.mcat.2023.113494 [7] Zhang S, Gao Y, Sun H, Fan Z, Shao T 2022 High Volt. 7 718 doi: 10.1049/hve2.12201 [8] Hu G T, Ma Y C, Hao Q L, Liu D L, Dou B J, Bin F 2024 New J. Chem. 48 2624 doi: 10.1039/D3NJ05057B [9] Xu W C, Buelens L C, Galvita V V, Bogaerts A, Meynen V 2024 J. CO2 Util. 83 102820 doi: 10.1016/j.jcou.2024.102820 [10] Lv X, Zhang H P, Zhang H, Shao Y Y, Zhu J S 2024 Prog. Coat. 192 108499 doi: 10.1016/j.porgcoat.2024.108499 [11] Xu S S, Chansai S, Shao Y, Xu S J, Wang Y C, Haigh S, Mu Y B, Jiao Y L, Stere C E, Chen H H, Fan X L, Hardacre C 2020 Appl. Catal. B: Environ. 268 118752 doi: 10.1016/j.apcatb.2020.118752 [12] Zhang S, Gao Y, Sun H, Fan Z, Shao T 2021 Plasma Sci. Technol. 23 064007 doi: 10.1088/2058-6272/abed30 [13] Michielsen I, Uytdenhouwen Y, Pype J, Michielsen B, Mertens J, Reniers F, Meynen V, Bogaerts A 2017 Chem. Eng. J. 326 477 doi: 10.1016/j.cej.2017.05.177 [14] Van Laer K, Bogaerts A 2017 Plasma Processes Polym. 14 1600129 doi: 10.1002/ppap.201600129 [15] Lu X P, Fang Z, Dai D, Shao T, Liu F, Zhang C, Liu D W, Nie L L, Jiang C Q 2023 High Volt. 8 1132 doi: 10.1049/hve2.12382 [16] Ren C H, Huang B D, Luo Y, Zhang C, Shao T 2023 Plasma Chem. Plasma Process. 43 1613 doi: 10.1007/s11090-023-10374-3 [17] Li S Q, Liu Y H, Yuan H, Liang J P, Zhang M, Li Y, Yang D Z 2022 Appl. Sci. 12 8895 doi: 10.3390/app12178895 [18] Gómez-Ramírez A, Montoro-Damas A M, Cotrino J, Lambert R M, González-Elipe A R 2017 Plasma Processes Polym. 14 e1600081 doi: 10.1002/ppap.201600081 [19] Jiang N, Lu N, Shang K F, Li J, Wu Y 2013 J. Hazardous Mater. 262 387 doi: 10.1016/j.jhazmat.2013.08.072 [20] Engeling K W, Kruszelnicki J, Kushner M J, Foster J E 2018 Plasma Sources Sci. Technol. 27 085002 doi: 10.1088/1361-6595/aad2c5 [21] Wang W Z, Butterworth T, Bogaerts A 2021 J. Phys. D: Appl. Phys. 54 214004 doi: 10.1088/1361-6463/abe8ff [22] Li Y, Yang D Z, Qiao J J, Zhang L, Wang W Z, Zhao Z L, Zhou X F, Yuan H, Wang W C 2020 Plasma Sources Sci. Technol. 29 055004 doi: 10.1088/1361-6595/ab844e [23] Li X C, Zhang L L, Chen K, Ran J X, Pang X X, Jia P Y 2024 IEEE Trans. Plasma Sci. 52 1619 doi: 10.1109/TPS.2024.3401040 [24] Van Laer K, Bogaerts A 2017 Plasma Sources Sci. Technol. 26 085007 doi: 10.1088/1361-6595/aa7c59 [25] Zhao P, Gu J G, Wang H Y, Zhang Y, Xu X Y, Jiang W 2020 Plasma Sci. Technol. 22 034013 doi: 10.1088/2058-6272/ab65b3 [26] Zhu M, Hu S Y, Wu F F, Ma H, Xie S Y, Zhang C H 2022 J. Phys. D: Appl. Phys. 55 225207 doi: 10.1088/1361-6463/ac55c1 [27] Zhu X B, Hu X L, Wu X Q, Cai Y X, Zhang H B, Tu X 2020 J. Phys. D: Appl. Phys. 53 164002 doi: 10.1088/1361-6463/ab6cd1 [28] Jo S, Lee D H, Kang W S, Song Y H 2013 Phys. Plasmas 20 123507 doi: 10.1063/1.4843875 [29] Li J, Zhu S J, Lu K, Ma C H, Yang D Z, Yu F 2021 J. Environ. Chem. Eng. 9 104654 doi: 10.1016/j.jece.2020.104654 [30] Xiong R X, Zhao P, Wang H Y, Zhang Y, Jiang W 2020 J. Phys. D: Appl. Phys. 53 185202 doi: 10.1088/1361-6463/ab6ccf [31] Gadkari S, Gu S 2018 Phys. Plasmas 25 063513 doi: 10.1063/1.5030508 [32] Mujahid Z, Korolov I, Liu Y, Mussenbrock T, Schulze J 2022 J. Phys. D: Appl. Phys. 55 495201 doi: 10.1088/1361-6463/ac99ea [33] 彭毅, 汪纯婧, 李晶, 高凯悦, 徐汉城, 陈传杰, 钱沐杨, 董冰岩, 王德真 2025 物理学报 74 025202 doi: 10.7498/aps.74.20241241 Peng Y, Wang C J, Li J, Gao K Y, Xu H C, Chen C J, Qian M Y, Dong B Y, Wang D Z 2025 Acta Phys. Sin. 74 025202 doi: 10.7498/aps.74.20241241 [34] Kourtzanidis K 2023 Plasma Sources Sci. Technol. 32 105016 doi: 10.1088/1361-6595/ad0430 [35] Liu J, Zhu X B, Hu X L, Tu X 2022 Plasma Sci. Technol. 24 025503 doi: 10.1088/2058-6272/ac39fb [36] Kang W S, Kim H H, Teramoto Y, Ogata A, Lee J Y, Kim D W, Hur M, Song Y H 2018 Plasma Sources Sci. Technol. 27 015018 doi: 10.1088/1361-6595/aaa7d0 [37] Van Laer K, Bogaerts A 2016 Plasma Sources Sci. Technol. 25 015002 doi: 10.1088/0963-0252/25/1/015002 [38] Li S J, Yu X, Dang X Q, Wang P Y, Meng X K, Wang Q, Hou H 2022 J. Clean. Prod. 340 130774 doi: 10.1016/j.jclepro.2022.130774 [39] Li S J, Yu X, Dang X Q, Wang P Y, Meng X K, Zheng H C 2022 Plasma Sci. Technol. 24 015504 doi: 10.1088/2058-6272/ac17e4 [40] Gao M X, Zhang Y, Wang H Y, Guo B, Zhang Q Z, Bogaerts A 2018 Catal. 8 248 doi: 10.3390/catal8060248 [41] Zhang Y, Wang H Y, Zhang Y R, Bogaerts A 2017 Plasma Sources Sci. Technol. 26 054002 doi: 10.1088/1361-6595/aa66be [42] Zhang Q Z, Zhang L, Yang D Z, Schulze J, Wang Y N, Bogaerts A 2020 Plasma Processes Polym. 18 e2000234 doi: 10.1002/ppap.202000234 [43] Zuo X, Zhou Y Y, Zhang Q Z, Wang H Y, Li Z H, Zhu J Z, Jiang X W, Zhang Y 2022 Plasma Processes Polym. 19 e2200025 doi: 10.1002/ppap.202200025 [44] Biagi V8.9 Database. [Online]. 2015 Available: https://www.lxcat.net [45] Gu J G, Zhang Y, Gao M X, Wang H Y, Zhang Q Z, Yi L, Jiang W 2019 J. Appl. Phys. 125 153303 doi: 10.1063/1.5082568 [46] Zhang Y, Wang H Y, Jiang W, Bogaerts A 2015 New J. Phys. 17 083056 doi: 10.1088/1367-2630/17/8/083056 [47] Kuhfeld J, Lepikhin N D, Luggenholscher D, Gzarnetzki U, Donko Z 2023 Plasma Sources Sci. Technol. 32 084001 doi: 10.1088/1361-6595/acdaf3 [48] 石峰, 王昊, 朱红伟 2018 真空与低温 24 188 doi: 10.3969/j.issn.1006-7086.2018.03.009 Shi F, Wang H, Zhu H W 2018 Vacuum Cryogenics 24 188 doi: 10.3969/j.issn.1006-7086.2018.03.009 [49] Zhang L Y, Zhang Q Z, Mujahid Z U, Neuroth C, Berger B, Schulze J 2024 Plasma Sources Sci. Technol. 33 105016 doi: 10.1088/1361-6595/ad83ed [50] Meierbachtol C S, Greenwood A D, Verboncoeur J P, Shanker B 2015 IEEE Trans. Plasma Sci. 43 3778 doi: 10.1109/TPS.2015.2487522 [51] Raizer Y P, Kisin V I, Allen J E 1991 Gas Discharge Physics p336 [52] Naidis G V 2011 Appl. Sci. 98 141501 doi: 10.1063/1.3576940 [53] Rad R H, Brüser V, Schiorlin M, Schäfer J, Brandenburg R 2023 Chem. Eng. J. 456 141072 doi: 10.1016/j.cej.2022.141072 [54] Mei D H, Zhu X B, He Y L, Yan J D, Tu X 2015 Plasma Sources Sci. Technol. 24 015011 doi: 10.1088/0963-0252/24/1/015011 [55] Wang X B, Zhu C Y, Wang L, Liu J Q, Jin A 2022 Radiat. Eff. Defect. S. 177 1117 doi: 10.1080/10420150.2022.2113078 [56] 张雪雪, 贾鹏英, 冉俊霞, 李金懋, 孙焕霞, 李雪辰 2024 物理学报 73 085201 doi: 10.7498/aps.73.20231946 Zhang X X, Jia P Y, Ran J X, Li J M, Sun H X, Li X C 2024 Acta Phys. Sin. 73 085201 doi: 10.7498/aps.73.20231946 [57] Cui Z L, Zhou C, Jafarzadeh A, Meng S Y, Yi Y H, Wang Y F, Zhang X X, Hao Y P, Li L C, Bogaerts A 2022 High Volt. 7 1048 doi: 10.1049/hve2.12230 [58] Kumar P, Saha S K, Sharma A 2023 Chem. Eng. S. 282 119372 doi: 10.1016/j.ces.2023.119372 [59] Chachereau A, Pancheshnyi S 2014 IEEE Trans. Plasma Sci. 42 3328 doi: 10.1109/TPS.2014.2354676 -
计量
- 文章访问数: 122
- HTML全文浏览数: 122
- PDF下载数: 3
- 施引文献: 0