
 首页
首页 登录
登录 注册
注册


HTML
-
Strongly correlated transition metal oxides exhibit a wide range of intriguing physical properties, including magnetoresistance, superconductivity, and metal–insulator transition (MIT), which arise from their strong electron–electron correlation effects.[1–6] These materials have attracted significant attention in recent years and hold great potential for various applications.[7–11] Among them, vanadium dioxide VO2 stands out as a representative material that has been extensively studied due to its remarkable feature known as the metal-to-insulator transition.[12] This transition was first discovered by Morin in 1959 and occurs around 340 K, accompanied by a simultaneous structural change from the high-temperature conducting rutile (R) phase to the low-temperature insulating monoclinic (M) phase, with a band gap of approximately 0.6 eV.[12–14] The MIT of VO2 near room temperature is associated with rapid changes in its structural, electrical, optical, thermal, and magnetic properties.[15–19] The reversible nature of this transition, along with the relative ease of synthesis,[20–23] makes VO2 an ideal material for various applications, including smart windows,[24,25] photoelectric switches,[26] information storage,[27] and thermal control of spacecraft.[28] Moreover, the unique MIT behavior of VO2 has gained renewed attention with the development of new ultrafast microscopy techniques.[29,30] The MIT in VO2, with its drastically changed physical properties, can be triggered by different stimuli such as temperature, pressure, light, electric field, and doping.[31,32]
Furthermore, VO2 not only provides a playground for exploring the peculiar MIT and corresponding applications, but paves the way for tackling strongly correlated systems. Unfortunately, the precise elucidation of the physical properties of materials with strongly correlated electronic behavior has continued to be a challenging subject in condensed matter physics. An inexpensive and reliable way to evaluate the physical features of with strong correlated d/f electrons is the calculations based on or beyond the density functional theory (DFT). As a consequence, extensive theoretical works have been performed, including but not limited to classical DFT within the local density approximation (LDA),[33,34] and the generalized gradient approximation (GGA),[35] hybrid functions,[36] GW (G refers to Green’s function and W denotes the dynamically screened Coulomb interaction),[37] and dynamical mean field theory (DMFT).[38] It is noticed that LDA and GGA cannot describe the electronic structure of M-VO2 correctly. The GW approximation and the random phase approximation (RPA) have been proved rather useful to describe the excitation of materials. The DMFT may correctly describe the electronic properties of both R and M phases of VO2. Unfortunately, these three methods fall short for the calculations of forces and suffer from the high computational cost. Though hybrid functional may be used to calculate forces, it still suffers from the high computational cost and fails in describing the metallic behavior of R-VO2.[39] Generally, the DFT + U method is tuned to be extensively used to study ground state properties such as structural, electronic and thermal properties with an economic computational cost. The strong electron–electron Coulomb interaction in the 3d orbital of VO2 and the drastic change in electrical conductivity following MIT make this system can be studied using Hubbard model with the consideration of U parameter.[40] Taking Hubbard U as an adjustable parameter, DFT + U method is easy to reproduce the nature of VO2, and it is suitable to calculate the total energy, atomic force, and stress accurately. These physical quantities, including the phase transition, mechanical properties, characteristics of surface and interface, and chemical reactions, are essential for better understanding of the richness of VO2. Usually, the conventional DFT, adding a Hubbard U parameter representing the strong electron–electron interaction of strongly correlated materials, can cure the deficiencies of local or semi-local exchange-correlation functions and maintain relatively low computational cost.[41–43]
As was reported, the accuracy of outcomes by DFT + U is tend to depend on the magnitude of U parameter. In the need of the correct description of strongly correlated system properties, it is necessary to determine a reliable U value firstly. Hence, many methods have been proposed to determine the optimal U value. The widely used approach reported in literature for choosing effective U is adjusting calculated results to fitting experimental data (for instance, fitting the experimental bandgaps, seeback effect or electrical conductivity).[42,44,45] On the other hand, several pure theoretical perspectives have also been developed to determine the U non-empirically, for example, the linear response method based on constrained DFT (CDFT) by Cococcioni and de Gironcoli1,[46] the constrained random-phase approximation (cRPA) method,[47] and self-consistent methods from the local electron density based on the Thomas–Fermi screening mode.[48] However, these methods have shortcomings more or less. For example, the limitation of determining Hubbard U by fitting the experimental band gap data may lead to a huge U in some materials, which is a lack of physical meaning. Meanwhile, several pure theoretical methods may either suffer significant expensive computation and fall short for Hellmann–Feynman force calculations,[37,49] or fail to obtain the effective U value correctly describing two VO2 phases simultaneously.[50] Considering the efficiency and accuracy, the effective U value can also be indirectly appreciated by the comparing calculated phase transition temperature Tc based on quasi-harmonic approximation (QHA) with that of experiment, from the thermodynamical aspect during MIT process. Actually already in 2014, Budai et al. provided a full thermodynamic understanding the nature of VO2 MIT by using x-ray and neutron scattering margins, revealing the importance of anharmonic phonons of lattice vibrations in phase-transition process.[51] The QHA, which takes into part of the anharmonic effects, may be a much more straightforward and computationally cheap method used to investigate thermodynamics properties, including the thermal expansion coefficients, the heat capacities, vibration entropy, and free energy.
In this paper, we propose a method to determine the optimal Hubbard U value of VO2 based on the transition temperature Tc using the QHA from a thermodynamic perspective. We demonstrate that the obtained U value is highly effective in capturing the correct physical properties of both the monoclinic (M) and rutile (R) structures of VO2. Focusing on the metal-to-insulator transition of vanadium dioxide, we choose to fit the phase transition temperature to determine the Hubbard U in DFT + U calculations with the quasi-harmonic approximation. Different U values have been evaluated for the properties of either monoclinic or rutile phase, including structural information, band structure, as well as the phase transition temperature. After considering the electronic part of free energy, the U of 1.5 eV is proved to be an optimal one for Perdew–Burke–Ernzerhof (PBE) + U calculations of VO2. It can well reproduce the essential properties of VO2, which is efficient in the calculations. Overall, our method provides a reliable approach for determining the appropriate U value in DFT + U calculations of strongly correlated materials like VO2.
-
In this work, we performed the geometrical optimization and electronic properties’ calculations under the framework of density functional theory, as implemented in the Vienna ab initio simulation package (VASP).[52,53] The projector augmented-wave (PAW)[54] pseduo potential was employed to describe the interaction between the core and valence electrons. The exchange–correlation interaction was described by the PBE functional.[55] The electron wavefunction was expanded in a plane-wave basis set with an energy cutoff of 520 eV. In order to ensure a reliable energy comparison between two VO2 phases, a reciprocal-grid density of
The PHONOPY software[56,57] was employed to calculate the phonon related information at harmonic and quasi-harmonic levels, including phonon dispersion, vibration free energy, the heat capacity, Helmholtz free energy, and the Gibbs free energy. The force constants of the supercell including 48 atoms for either M or R phase were calculated through the density-functional perturbation theory (DFPT).[58] A mesh grid of 40 × 40 × 40 q-points was generated to make calculation more accurate.
The finite temperature-dependent physical quantities were obtained by using the QHA,[56,59] including vibration free energy, the heat capacity, Helmholtz free energy, and the Gibbs free energy. The temperature was assumed to indirectly affect phonon frequencies through thermal expansion and temperature dependence of phonon frequencies. Within the QHA, the Helmholtz free energy of a crystal is expressed as
where Estatic(V,0 K) is the first-principles zero-temperature energy of a static lattice at volume V. The second term in Eq. (1), Ezpe(V,0 K), is the zero-point energy that can be written as
The last term is the phonon free energy due to lattice vibration, given by
where ωi,q(V) is the volume-dependent vibrational frequency of i-th mode at wavevector q, kB and ℏ are the Boltzmann and the reduced Planck constant, respectively. Hence the vibrational entropy can be obtained by
Then the heat capacity can be calculated from vibrational entropy
The Helmholtz free energies F(V,T) shown in Eq. (1) were calculated at 9 volume points of each specified temperature. Furthermore, the Vinet equation of state was used to fit the nine of F(V,T) at each T variable within a specified temperature window considered, and the equilibrium volume at each T was obtained corresponding to the minimum value of fitted curve. The Gibbs free energy as a function of temperature/pressure can be written as
where p = ∂E/∂V ≈ 0 under the atmosphere. Transition temperature can be obtained by tracking and comparing Gibbs free energies of M and R phases as a function of temperature, satisfying Eq. (6). When Gibbs free energies of R and M phases are equal, the transition occurs naturally and the Tc can be obtained simultaneously.
-
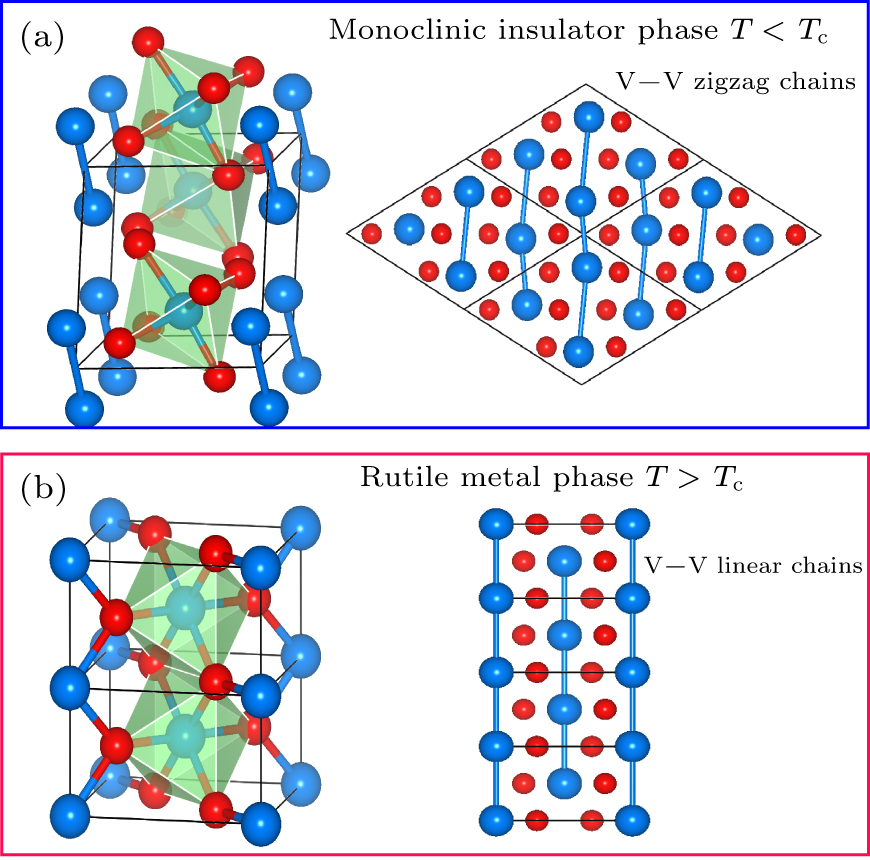
At a temperature below Tc, the VO2 is a monoclinic (M) structure with space-group P21/c (No. 14) with the unit cell parameters of a ≈ 5.388 Å, b ≈ 4.614 Å, c ≈ 5.441 Å. The V4+ ions deviates from the vertex and center of the unit cell, which results in the twist VO6 octahedral cages as basic building blocks (shown in the left part of Fig. 1(a)). Another feature of M phase is that the vanadium atoms title and dimerize to form zigzag-like chains with alternating different V–V bond distances, as shown in right panel of Fig. 1(a). As shown in Fig. 1(b), at ambient pressure and above Tc, the thermodynamically stable phase of VO2 belongs to the P42/mnm (No. 136) space group with tetragonal rutile (R) structure. It has the lattice constants of a = b ≈ 4.627 Å, c ≈ 2.797 Å. In the R-VO2 phase, the V4+ ions occupy the apex and body center of the tetragonal crystal cell, and six O2− ions surrounding one V4+ ion constitute an octahedral VO6 unit (see the left panel of Fig. 1(b)). In addition, the octahedral unit forms edge-sharing chains along the c axis. As illustrated in right panel of Fig. 1(b), vanadium atoms form equally spaced V–V straight chains in c direction.
As described above, one of the distinguishing features of VO2 is its strongly correlated 3d electrons. Although the periodic plane-wave DFT calculations with typical exchange-correlation functions, such as LDA or GGA, have significant success in describing many materials, they fail to treat strongly correlated systems. Usually, they may underestimate the band gaps and sometimes even predict qualitatively incorrect metallic ground state, e.g., insulating nature M-VO2. This discrepancy is mainly due to inaccurate treatment of electron correlation effects. Therefore, in order to overcome this shortcoming, the DFT + U method with a moderate computational cost was used in the present work to better understand the electronic properties of two VO2 phases. The strong Coulomb interactions between V-3d electrons are represented by the Hubbard U parameter. In the case of M-VO2, the band should open a reliable gap and restore insulating character. However, previous studies have shown that the calculation results depend on the magnitude of effective U values, so we systematically examined the effects of different U values on band gaps. Here, we mainly focus on the effect of Hubbard U parameter on electronic structure rather than the geometrical structure. Hence, the V–V distances for the two phases shown in Table 1 are obtained from the fully optimized crystal structures by the PBE function without considering the Hubbard U parameter. The PBE function can correctly reproduce two different dimerized V–V bond distances for the monoclinic phase (2.50 Å and 3.19 Å compared to the experimental values 2.62 Å and 3.16 Å, respectively). In the rutile phase, the optimized equal V–V bond length is ∼2.80 Å, which is close to the experimentally reported value of 2.85 Å. Taking U as the adjustable parameter in a range between 1 eV and 4 eV, the DFT + U results reproduce the insulating nature of M phase. The band gaps are 0.21 eV, 0.44 eV, 0.71 eV, and 1.00 eV with U = 1 eV, 2 eV, 3 eV, 4 eV, respectively. It shows a positive correlation between the band gaps and the U values. Meanwhile, the metallic character of R structure is preserved. From these results, we may speculate that the tuning U in the region of 2–3 eV may be required to match the optical gap (0.67 eV) from the experiments. However, one should remember that the experimental gap is measured by photoemission in an exciting progress, in which the interacting electron–hole pair is also included. A good agreement between calculation and experiment can only be achieved by considering the excitonic effects, especially in the case that there is a semiconductor or an insulator. The Bethe–Salpeter equation under the GW approximation (GW-BSE) may be appropriate for this process, but it makes the calculation expensive and cumbersome. Therefore, we would like to use a relatively inexpensive DFT + U method to capture the correct qualitative features of VO2 system in the present work, where the reliable V–V bonds for both the phases and a finite band gap of M phase (but not the same value as the experimental one) should be reproduced.
-
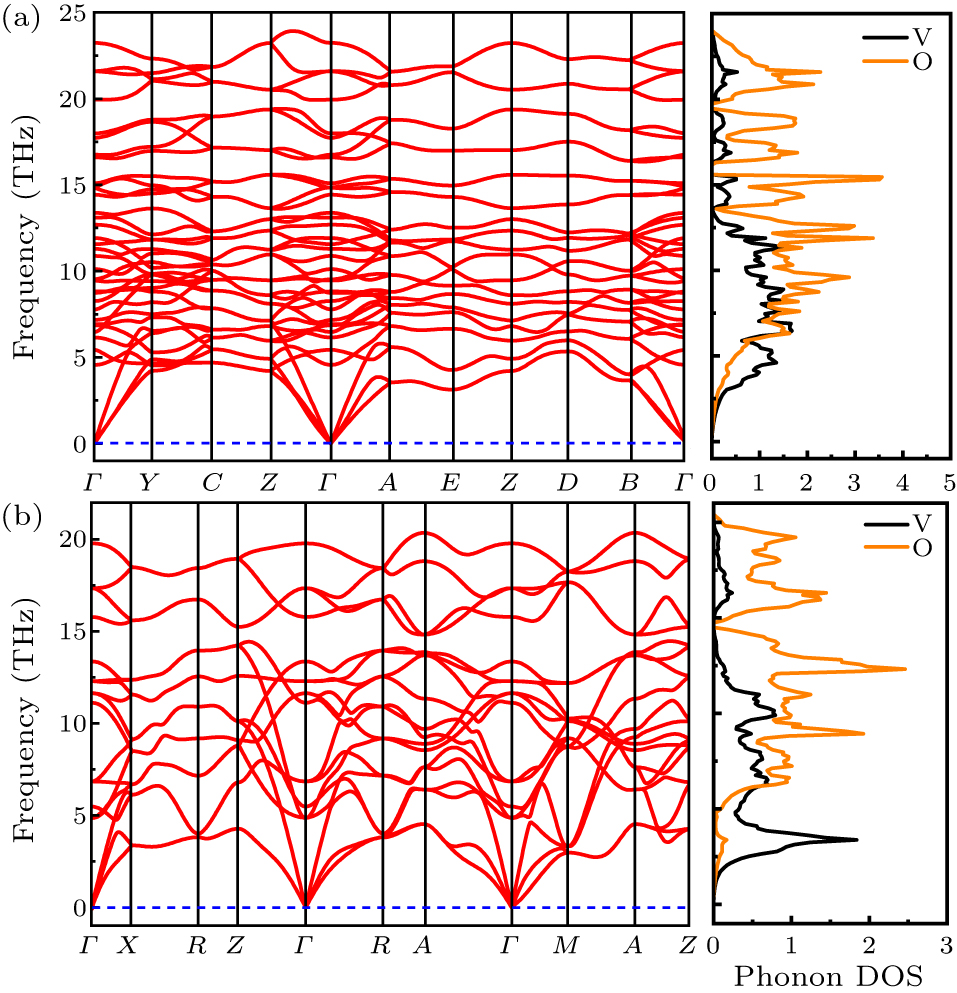
According to the workflow of QHA method, the phonon spectra based on force constants obtained by the density-functional perturbation theory (DFPT) are required prior to the actual thermodynamically physical quantities calculation. For instance, the ωi,q is used to calculate zero-point energy and free energy of lattice vibration, as seen on the right-hand sides of Eqs. (2) and (3). Hence, we have first calculated the phonon dispersion curves for both M-VO2 and R-VO2 using DFT + U with U = 1 eV (Fig. 2). In a cell with n-atoms, there would be 3 acoustic branches, 3n–3 optical branches. There are 36 and 18 branches in the primitive cells of M and R phases, respectively. As shown in Figs. 2(a) and 2(b), there is no imaginary frequency existing in the whole Brillouin zone for both the phases. It provides a direct proof of their dynamical stability under the simulated condition. From the projected phonon density of states of both the phases shown in Fig. 2, the low frequency part is mainly contributed by V atoms (black solid line), and the high frequency is mainly originated from O atoms (red solid line). In addition, V atoms is more dominant for phonon modes with frequencies lower than 5 THz. These results are in agreement with the other phonon calculations given by Lee et al.[62] For the R phase, our results are different with the results from Hua et al.,[63] where there were a lot of imaginary frequencies without considering a Hubbard U. This difference highlights the necessity of considering the correlation effect in rutile phase VO2. Additionally, the three non-degenerated acoustic branches, one longitude and two transverse branches, indicated that M and R phases are both anisotropic. The phonon dispersion curves by DFT + U with other U values were also calculated. Though the details may vary slightly, there is no imaginary frequency in phonon spectra for the two phases. To keep the present text succinct, only the results of U = 1 eV is presented in Fig. 2.
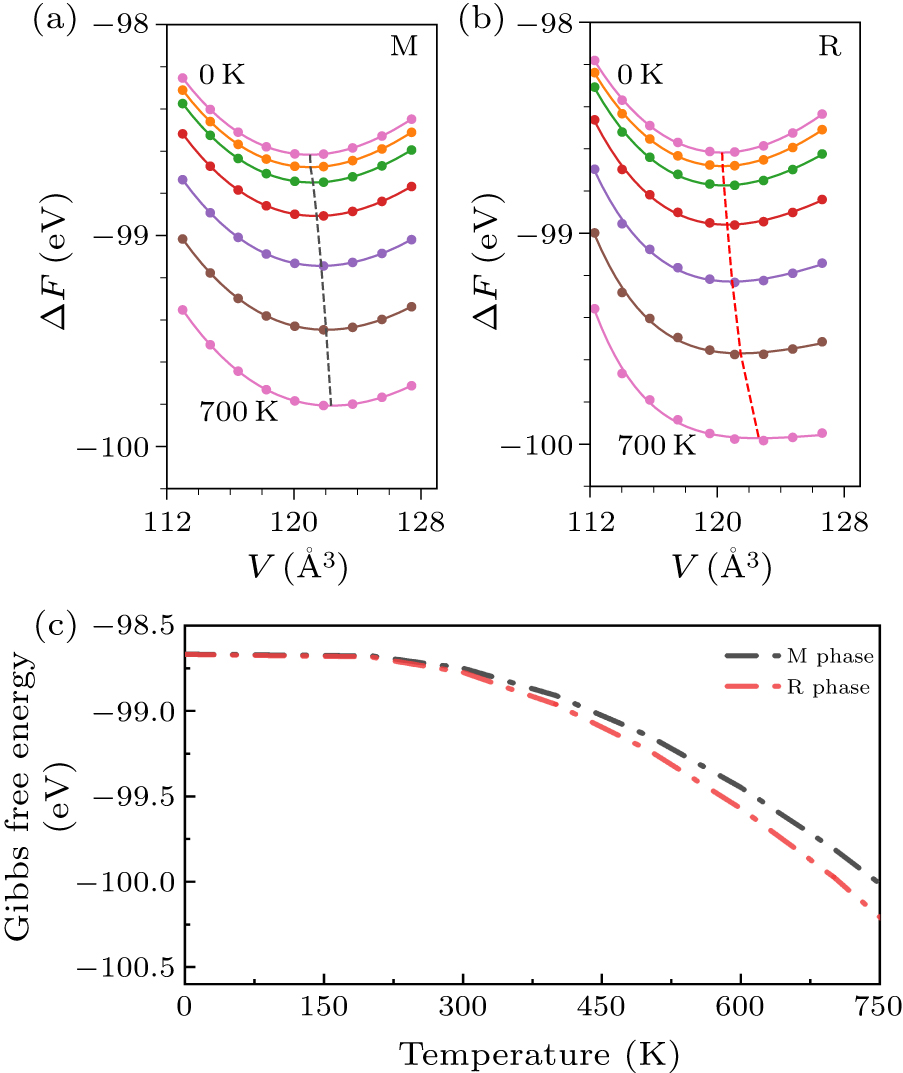
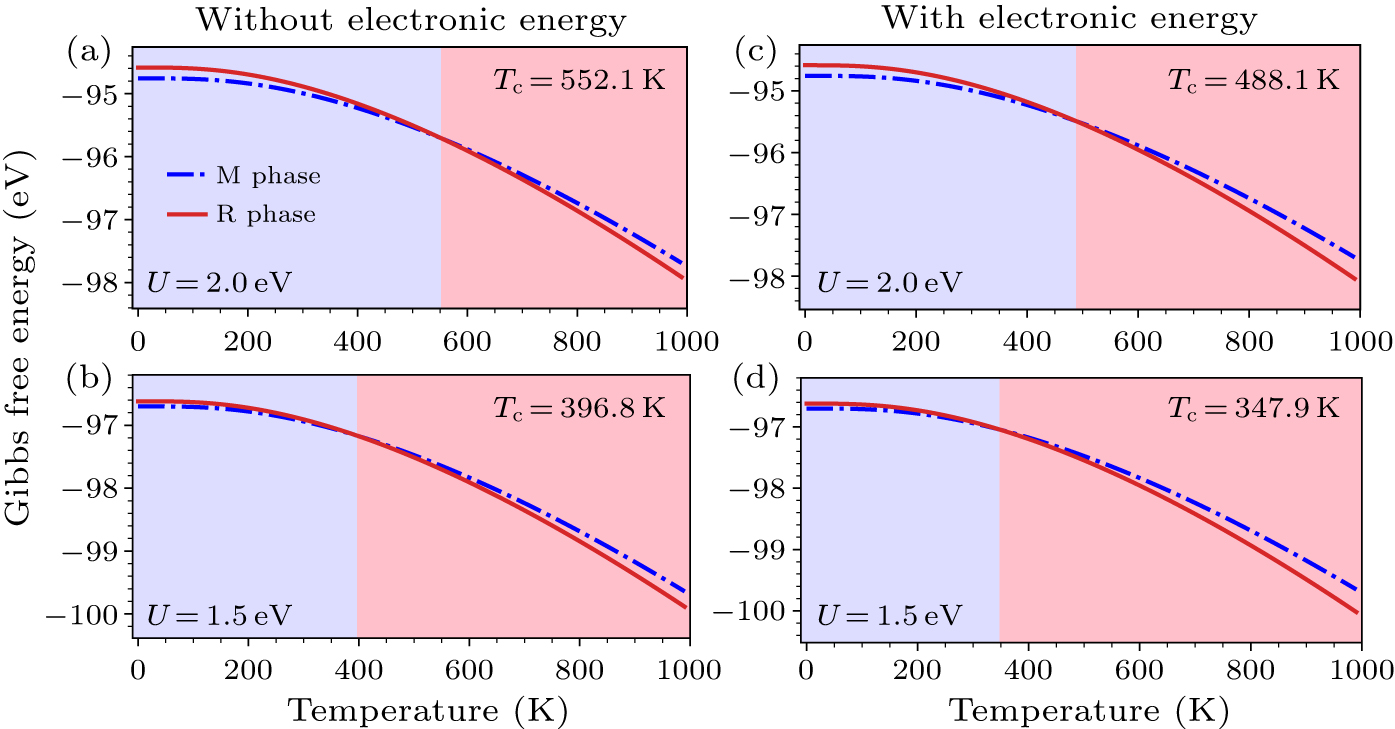
The thermodynamic properties are calculated consequently, including the entropy, free energy, heat capacity, and so on. Figures 3(a) and 3(b) show the volume-dependent quasi-harmonic Helmholtz free energies of M and R phases. The free energies as a function of lattice cell volume at each specified temperature from 0 K to 700 K with a step of 100 K calculated with QHA for U = 1.0 eV are depicted by filled circles. These calculated points are fitted by the Vinet equation of states (EOS)[64] to get the equilibrium volumes at different temperatures. As shown in Figs. 3(a) and 3(b), using QHA makes it possible to preserve part of the finite temperature effect caused by the changes of phonon frequencies with the increase in equilibrium lattice volume at different temperatures. Within the framework of the QHA, the Gibbs free energy at given temperatures and a certain pressure can be obtained (the crossed points of black or red dashed line and colored solid lines). The Gibbs free energy of both M and R phases as functions of temperatures are presented in Fig. 3(c). It is well known that the Gibbs free energies of the two phases at the transition point are equal. Therefore, the transition temperature Tc can be evaluated from the cross point of two Gibbs free energy curves. However, from Fig. 3(c) we can find that the Gibbs free energy of R-VO2 is always lower than that of M-VO2 in the whole temperature window, which is counter-intuitive and no obvious Tc. This issue may be due to the irrationally selected Hubbard U = 1.0 eV, which is inadequate to correct electron–electron strongly correlated interactions.
Keep the above results in mind, one may expect to enhance the Tc by adjusting the U parameter. We thus go one step further to obtain the Gibbs free energy with U = 2.0 eV. As illustrated in Fig. 4(a), the Gibbs free energy of M phase is lower than that of R phase in the region of 0–552.1 K, which implies that the M phase is more stable than the R phase and the phase transition occurs at 552.1 K. However the Tc is higher than the experimental data.[12] Although the cross point leftwards with the decreasing Hubbard U to 1.5 eV, the Tc ≈ 396.8 K [Fig. 4(b)] slightly deviates from the measured value of ∼340 K. Additionally, the other contributions to the free energy in Eq. (1) should be considered to adjust the Tc further. As is well known, the temperature-dependent electronic energy Eelec(V,T) [Eq. (7)], usually ignored for semiconductors, should be emphasized in metal.[65] Further calculations show that the Gibbs free energy of R phase cannot be correctly describe without taking into account the electronic energy (∼0.14 eV error in 0–1000 K). The reason of this issue is attributed to the large density states at Fermi level of R phase, which yields a substantial contribution of the electronic entropy. Substituting Eelec(V,T) for Estatic(V,0 K) in Eq. (1), the modified Gibbs energies of both the phases are shown in Figs. 4(c) and 4(d). The substantial contribution of the electronic entropy (Selec) decreases the free energy of R phase and hence induces the reduction of Tc. It is noticed that the phase transition temperature is 347.9 K with the U value of 1.5 eV (Fig. 4(d)). The effective Hubbard U is determined to be 1.5 eV by successfully fitting phase transition temperature.
-
In practice, an optimal Hubbard U value is available to correctly describe fundamental properties of both the VO2 phases. In order to check the efficiency and reliability of the determined U mentioned above, we choose to examine the thermal properties of M-VO2 and the electronic band structures of both the phases with the U value of 1.5 eV as the examples. The calculated temperature-dependent free energy, heat capacity and entropy are obtained and presented in Fig. 5(a). The heat capacity CV simulated by the quasi-harmonic approximation (the red filled stars with guided line in Fig. 5(a)) can be fitted according to the following equation deducted from the Debye approximation:
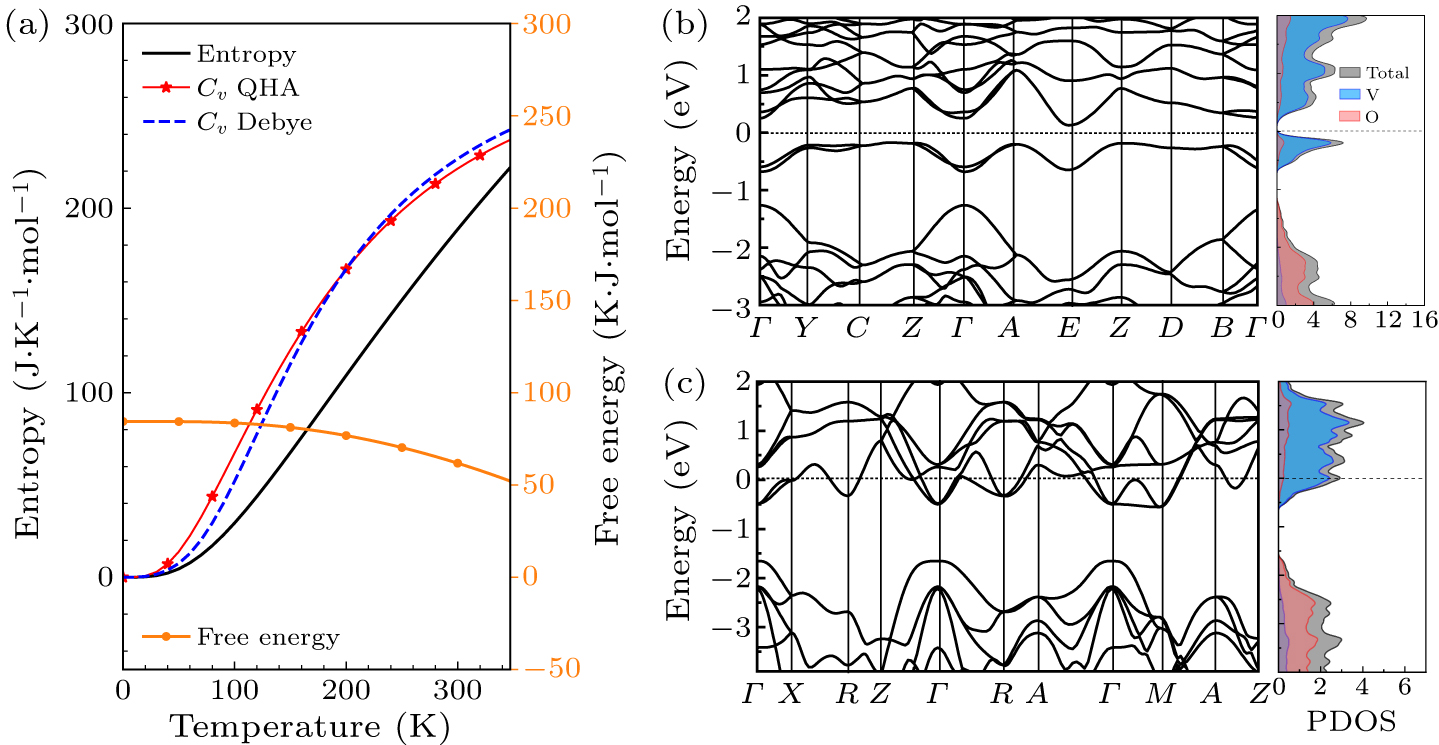
The parameter TD is fitted to be 728.4 K, agreeing with the experimental value of 750 K.[66] This good agreement provides a direct proof that the QHA method and the U parameter determined by Tc demonstrate the good performance for evaluating thermal properties of VO2. The electronic band structures of both the M and R phases are also presented in Figs. 5(b) and 5(c) to further verify the efficiency of the determined U. Obviously, the energy zero is shifted to the Fermi energy position in both the figures. The DFT + U with U = 1.5 eV give a ∼0.3 eV indirect band gap for the insulating M phase, and characterizes the metal nature of R phase. The shapes of band curves near Fermi level are comparable to the previous DFT results.[34,49] The partial density of states (PDOS) shown in the right panel of Figs. 5(a) and 5(b) provide more clear evidence of the instinct characteristic of M phase and R phase. As shown in the right panel of Fig. 5(b), the partial density of states of monoclinic VO2 is separated near the Fermi level by a gap of ∼0.3 eV, which agrees with the property of its band structure discussed above. The top of valence-band sates predominantly is made up of V atoms contributions, while significant components from V atoms also contribute mainly to the lower conduction-band states. The PDOS of rutile VO2 is shown in the right part of Fig. 5(b). It can be noticed that Fermi level is located in the conduction bands, which indicates the metallic nature of R phase. The lower group of states below the energy −1.5 eV is mainly originated from the O atoms. The states crossing the Fermi level in the energy ranges between −0.5 eV and 2 eV are dominated by the states of vanadium atoms. It should be kept in mind what really matters is the nature of insulating M phase and metallic R phase, but not the exact value band gap. One cannot expect that the electronic band gap of the ground state always matches with the optical gap, especially in the strong correlated materials. In a word, the magnitude of the resulting U determined by Tc based on QHA is physically reliable.
3.1. Structural properties and band gap
3.2. Phonon dispersion and phase transition temperature
3.3. Thermal properties and band structures with determined U
-
Using first-principles calculations with the quasi-harmonic approximation, the temperature-dependent Gibbs free energy curves of insulating M phase and metallic R phase of VO2 with a certain Hubbard U can be plotted. The transition temperature Tc is determined by identifying the cross point of Gibbs free energy curves during the phase transition. By comparing the calculated Tc with the experimental reference value, the effective Hubbard U value is turned out to be 1.5 eV for VO2. Moreover, the calculations with this U value may correctly capture the metallic and insulating properties of the M and R phases, respectively. In conclusion, this work demonstrates that the first-principles calculations in combination with QHA can be used to determine the effective Hubbard U value of VO2 by analyzing the phase transition temperature Tc. This approach is promising for determining U of other strongly correlated materials.
 DownLoad: